Interacting with 2D Structures
Most biologists explore RNA structure by looking at secondary structure diagrams. Fewer attempt to explore the 3D structure and those that do find it hard to move from the 2D to the 3D. Finding the same region in 2D and 3D can be challenging. We are seeking to fix this problem by developing new tools which integrate information from 3D with the 2D structures.
We have prototyped a new tool to interact with RNA 2D structures. This tool allows users to visualize annotated interactions and motifs in 2D and 3D. The site is located at: http://rna.bgsu.edu/experiments/2d/.
Data Sources
Our new tool integrates a 2D structure with a 3D visualization provided by Jmol along with structural annotations from the RNA 3D Hub. It shows the 16S E. coli secondary structure from the the Comparative RNA Web Site (CRW) with structural annotations from2AW7. To display the 2D diagram we extracted the layout of the 16S rRNA from the CRW Site. We then retrieved the interaction annotations from the RNA 3D Hub and the motif annotations in the Motif Atlas.
Future work may use other sources of basepair annotations, such as those produced by RNAView or MC-Annotate. We are also interested in other sources of 2D diagrams, such as those produced by automated programs like R2R and VARNA.
Visualizing Regions on the 2D Diagram in 3D
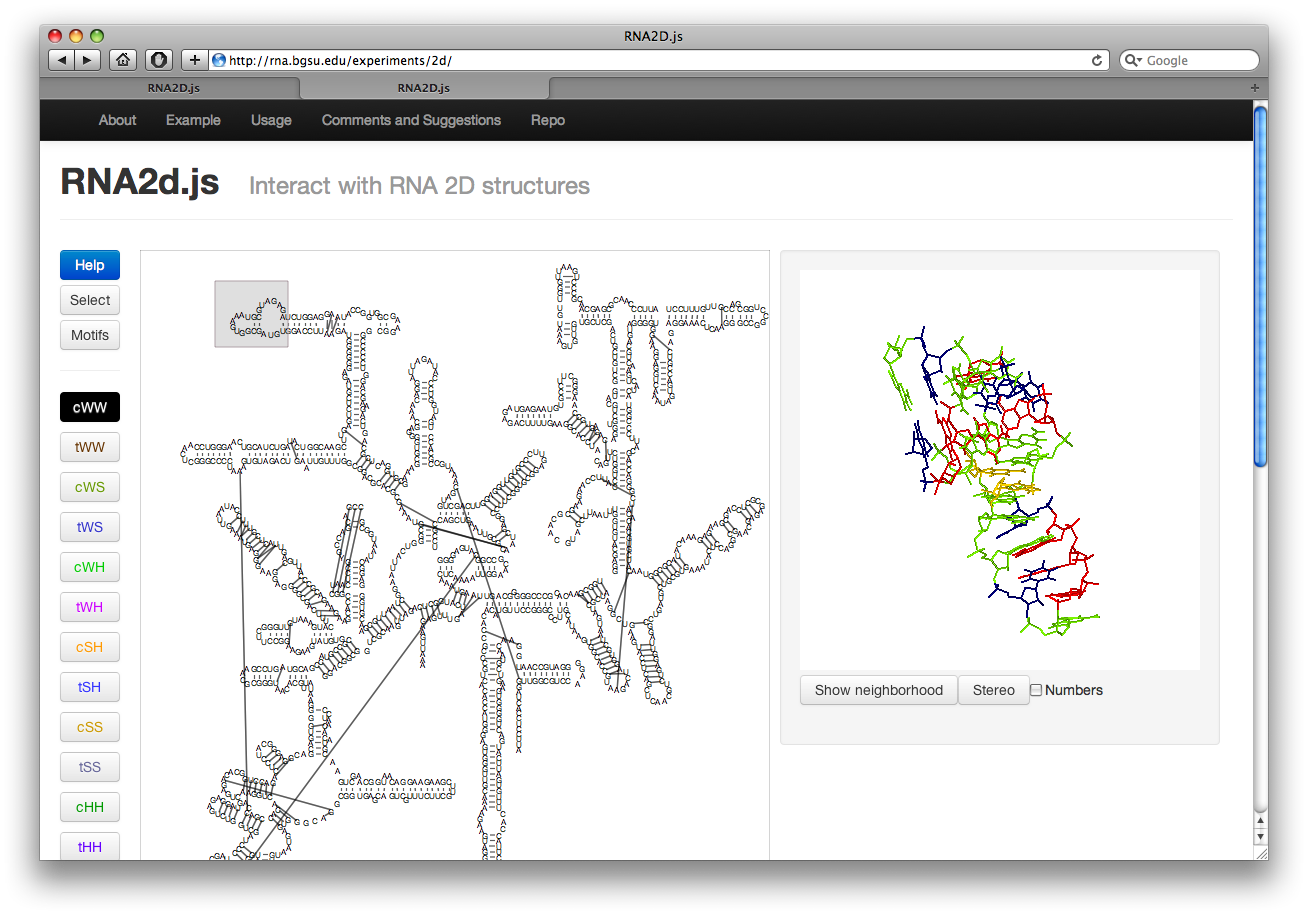
When the page loads, there is a grey box around the upper left corner of the 2D structure and the corresponding 3D structure on the right. This box is the selection. Selecting by clicking and dragging other nucleotides will display them in the Jmol window on the right. Currently only 200 nucleotides at a time may be displayed.

Visualizing Interactions
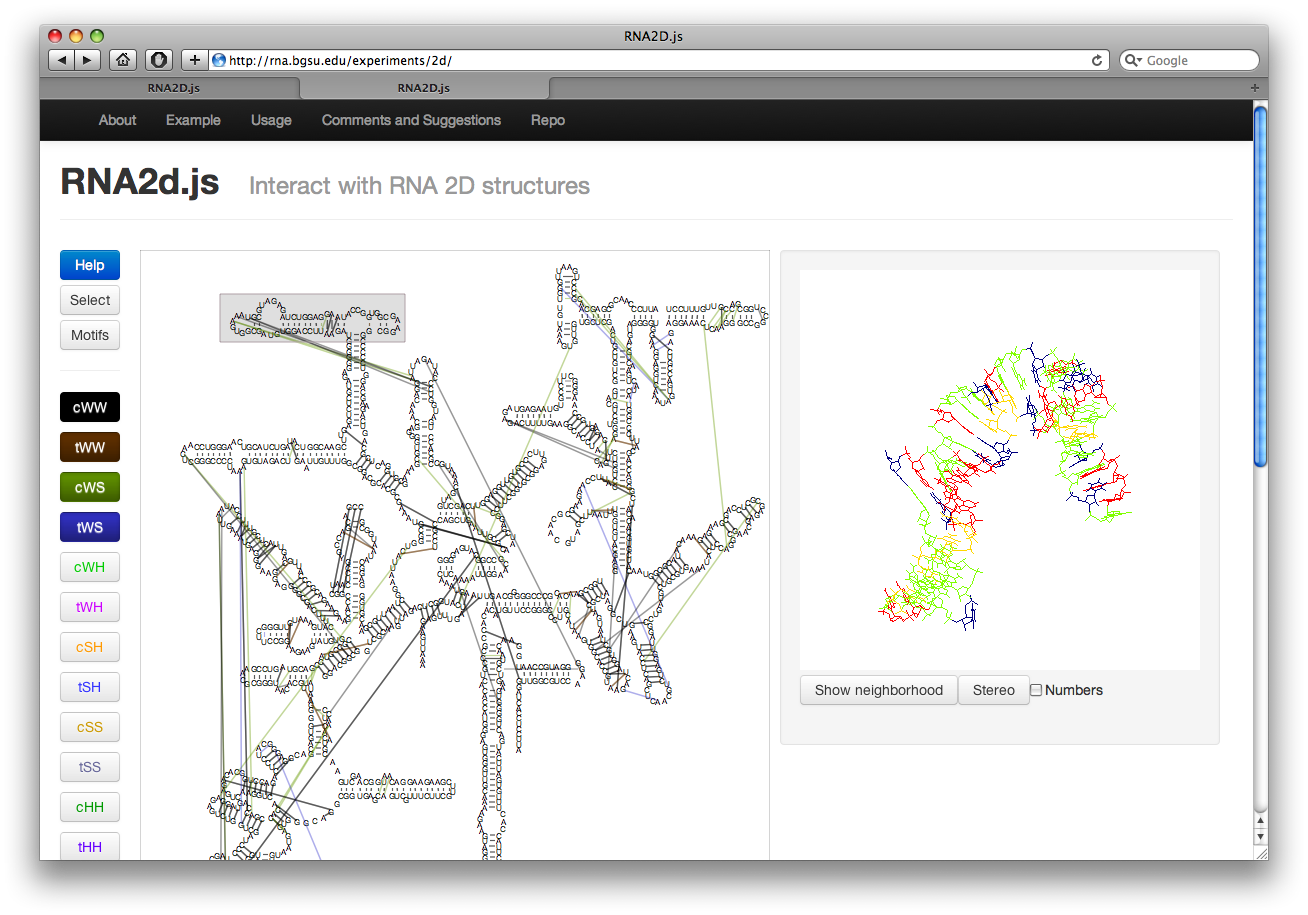
Along the left there are several buttons. The buttons labeled cWW, tWW, etc, toggle the display of corresponding basepair interactions according to the Leontis-Westhof nomenclature. The interactions are colored as shown in the button. Currently this includes the “near” interactions as well.

Visualizing Motifs
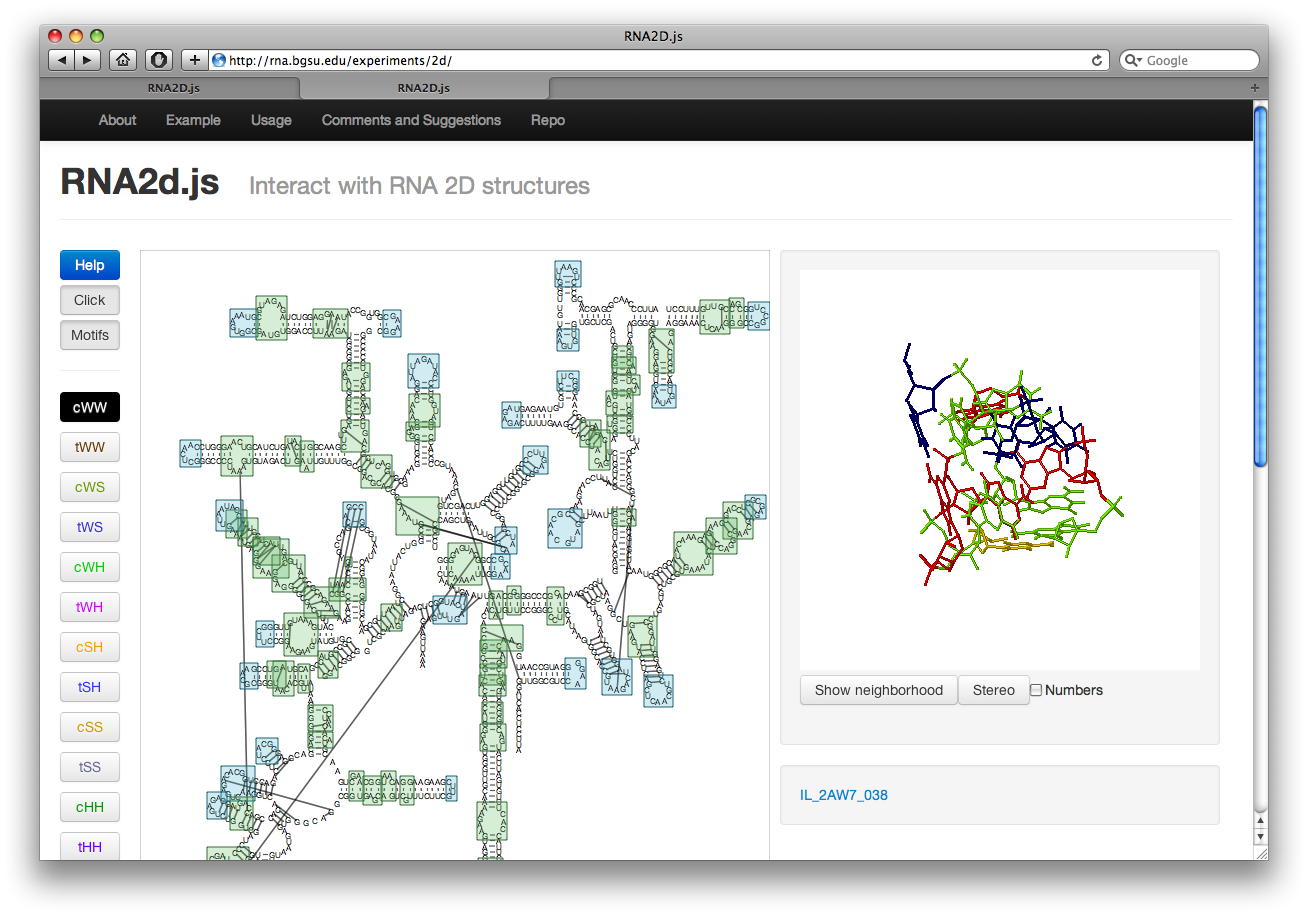
The button labeled Motif on the left will highlight all motifs in the structure. The internal loops are shown in green while hairpin loops are in blue. Junction loops are not shown. The motifs are taken from our Motif Atlas. Clicking on the boxes will display the loop structure along with a link to the loop page in the Motif Atlas. This also switches to click mode.

Click and Select Modes
In click mode it is possible to click on motifs and interactions. It is not yet possible to click on nucleotides. Clicking on an interaction or motif will display it. In addition, mousing over an interaction or nucleotide in click mode will highlight it. Nucleotides will be displayed larger and any interactions out of that nucleotide will be bolded. Hovering over an interaction will bold the line and the nucleotides involved in the interaction. To go back to select mode click the Click button. To get back to click mode click the Select button.
Technology
This tool is based off of the D3 Javascript library for drawing the SVG and uses JmolTools for visualizing the 3D structure. The code is available at the github repository.
Similar Tools
There are other similar tools, such as S2S and RNA2DMap. Our tool differs from these in that it is intended to easily integrate into any web page, is open source, and can integrate with different data sources.
Issues
Currently, Jmol does not work well in Chrome on some operating systems. For this reason we recommend using some other browser, such as Firefox or Safari. In addition, old browsers such as IE8 and below cannot work with this tool.
Comments
The tool is still a prototype so any comments are welcome. They can be left at the bottom of the tool’s page or emailed using thecontact us page.
Updated: 08/01/2025 05:42PM
