Grandparenthood in the U.S.: Residence Status of Grandchildren
Family Profile No. 03, 2023
Author: Krista K. Westrick-Payne
In 2021, there were more than 67 million grandparents aged 40 and older in the United States, according to the Survey of Income and Program Participation (SIPP). This figure represents 42% of adults aged 40 and older. The SIPP is a nationally representative household-based survey and is designed to provide comprehensive family and social information on individuals and families. Because the SIPP gathers information on all individuals who lived in a surveyed household, and directly asks respondents if they are a grandparent, it is one of the few surveys that identifies both non-resident and resident grandparents. Using data from the 2021 SIPP, this profile updates FP-18-05 written by Wu (2018) and FP-14-12 written by Stykes, Manning, and Brown (2014) to examine grandparents’ age composition, race/ethnicity, educational attainment, and relationship status by residential status of grandchildren. This is the 3rd profile in our updated series on grandparents in the U.S.
Prevalence of Grandparents Residing with Grandchildren
- Overall, in 2021 only 8% of grandparents aged 40 and older resided with their grandchild(ren). This is just slightly lower than the share in 2018 when 9% of grandparents resided with their grandchild(ren) (not shown).
Age Composition of Grandparents by Resident Status of Grandchildren
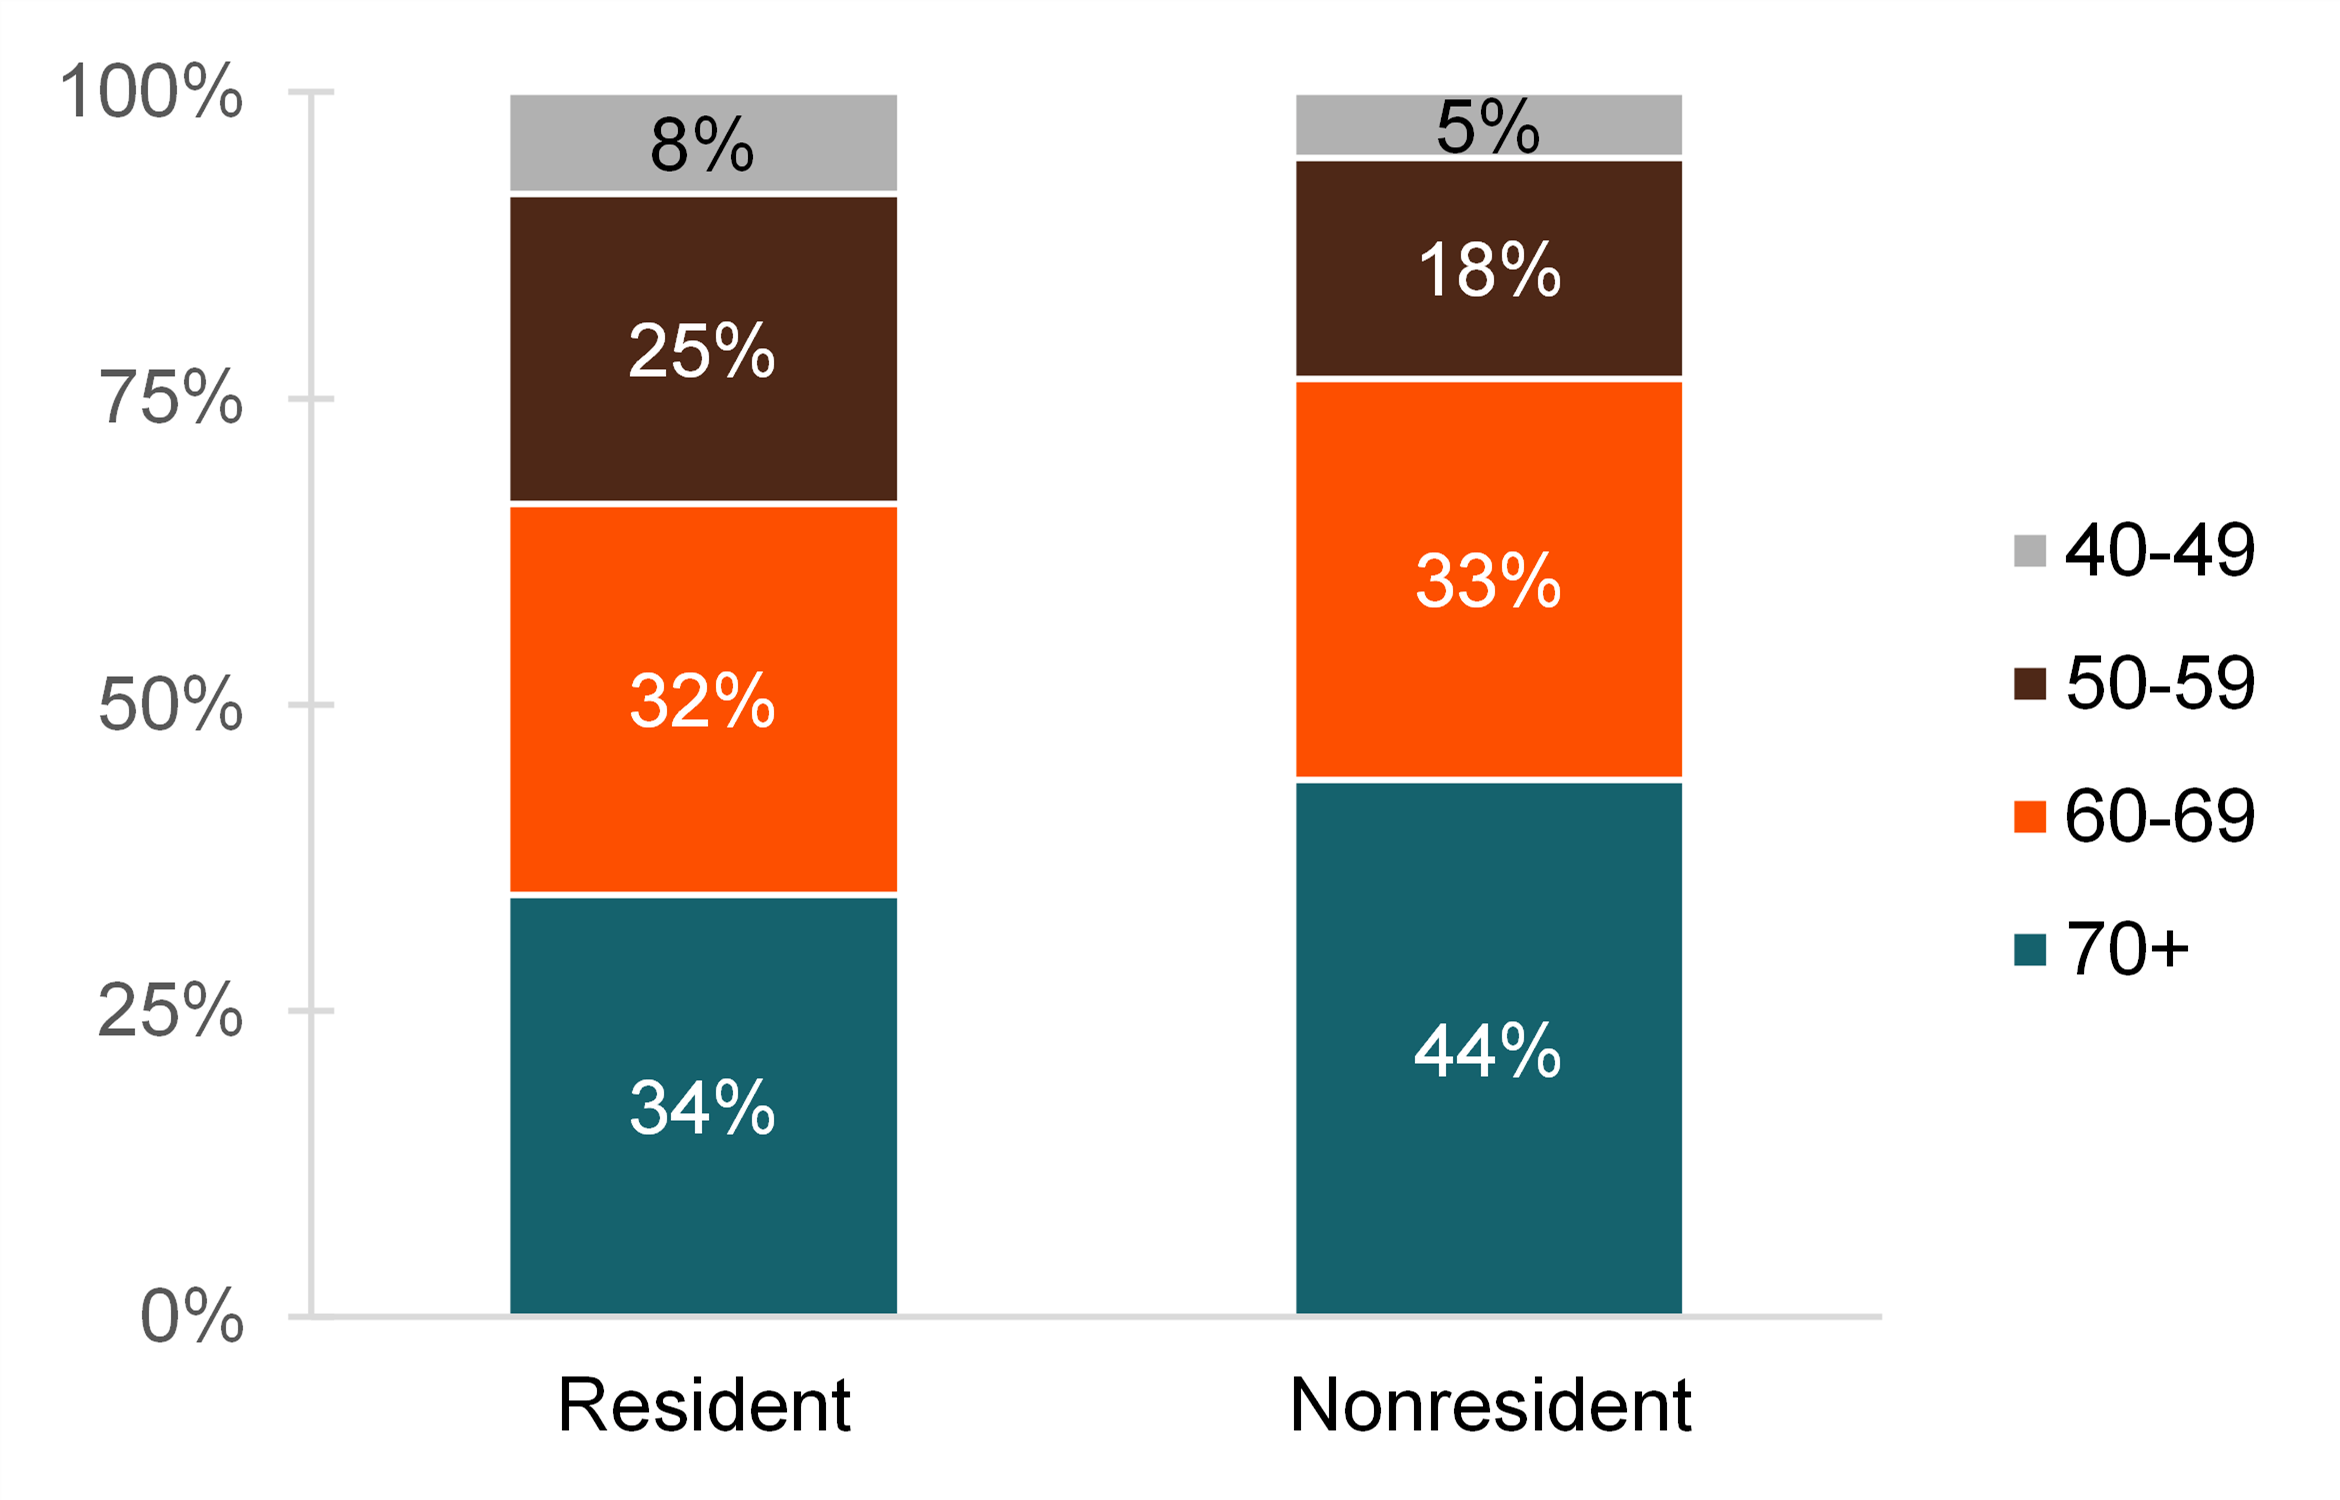
- On average, resident grandparents were 3 years younger than nonresident grandparents (median age of 65 versus 68).
- One-third of resident grandparents (33%) were under age 60, whereas about one-quarter (23%) of nonresident grandparents were under age 60.
Figure 1. Age Composition of Grandparents by Resident Status of Grandchildren, 2021

Race/Ethnicity of Grandparents by Resident Status of Grandchildren
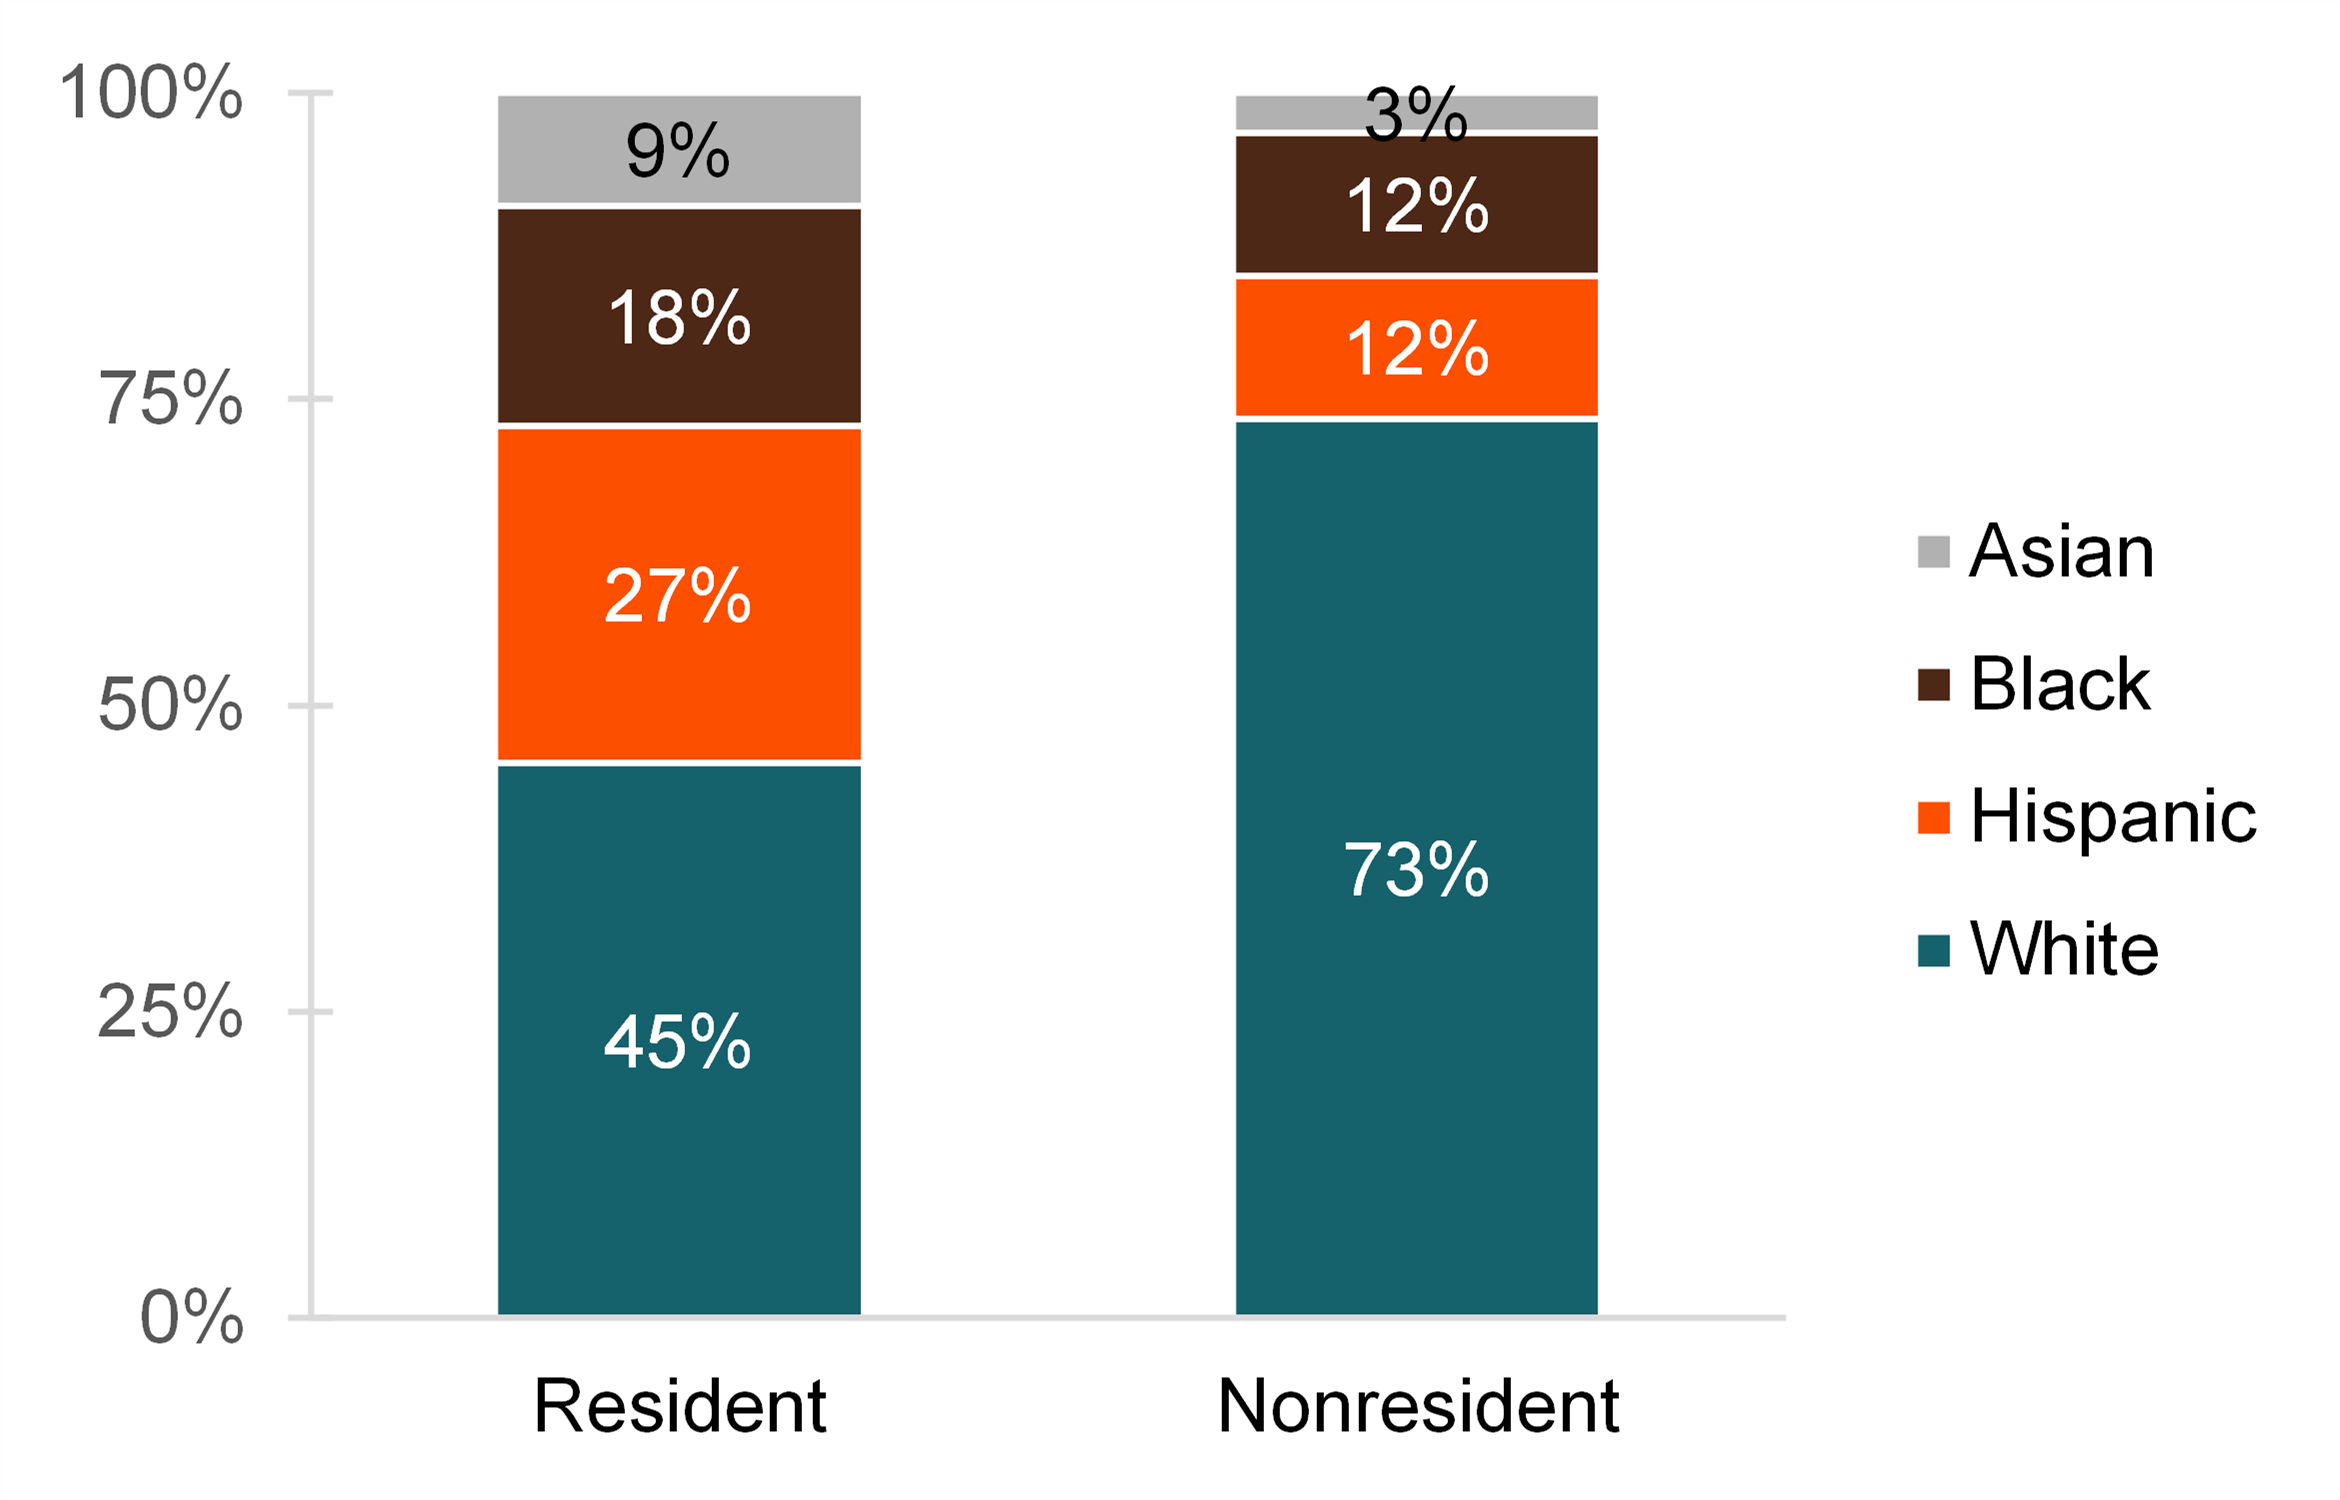
- A larger share of grandparents with resident grandchildren belonged to a racial/ethnic minority group (55%) compared to nonresident grandparents (27%).
- Among non-Whites, Hispanics constituted the largest share of resident grandparents (27%). However, among nonresident grandparents, only about one-ten (12%) were Hispanic.
- A higher percentage of resident than nonresident grandparents were Black (18% and 12%, respectively).
- Three times as many resident than nonresident grandparents were Asian (9% versus 3%).
Figure 2. Race/Ethnicity of Grandparents by Resident Status of Grandchildren, 2021

Educational Attainment of Grandparents by Resident Status of Grandchildren
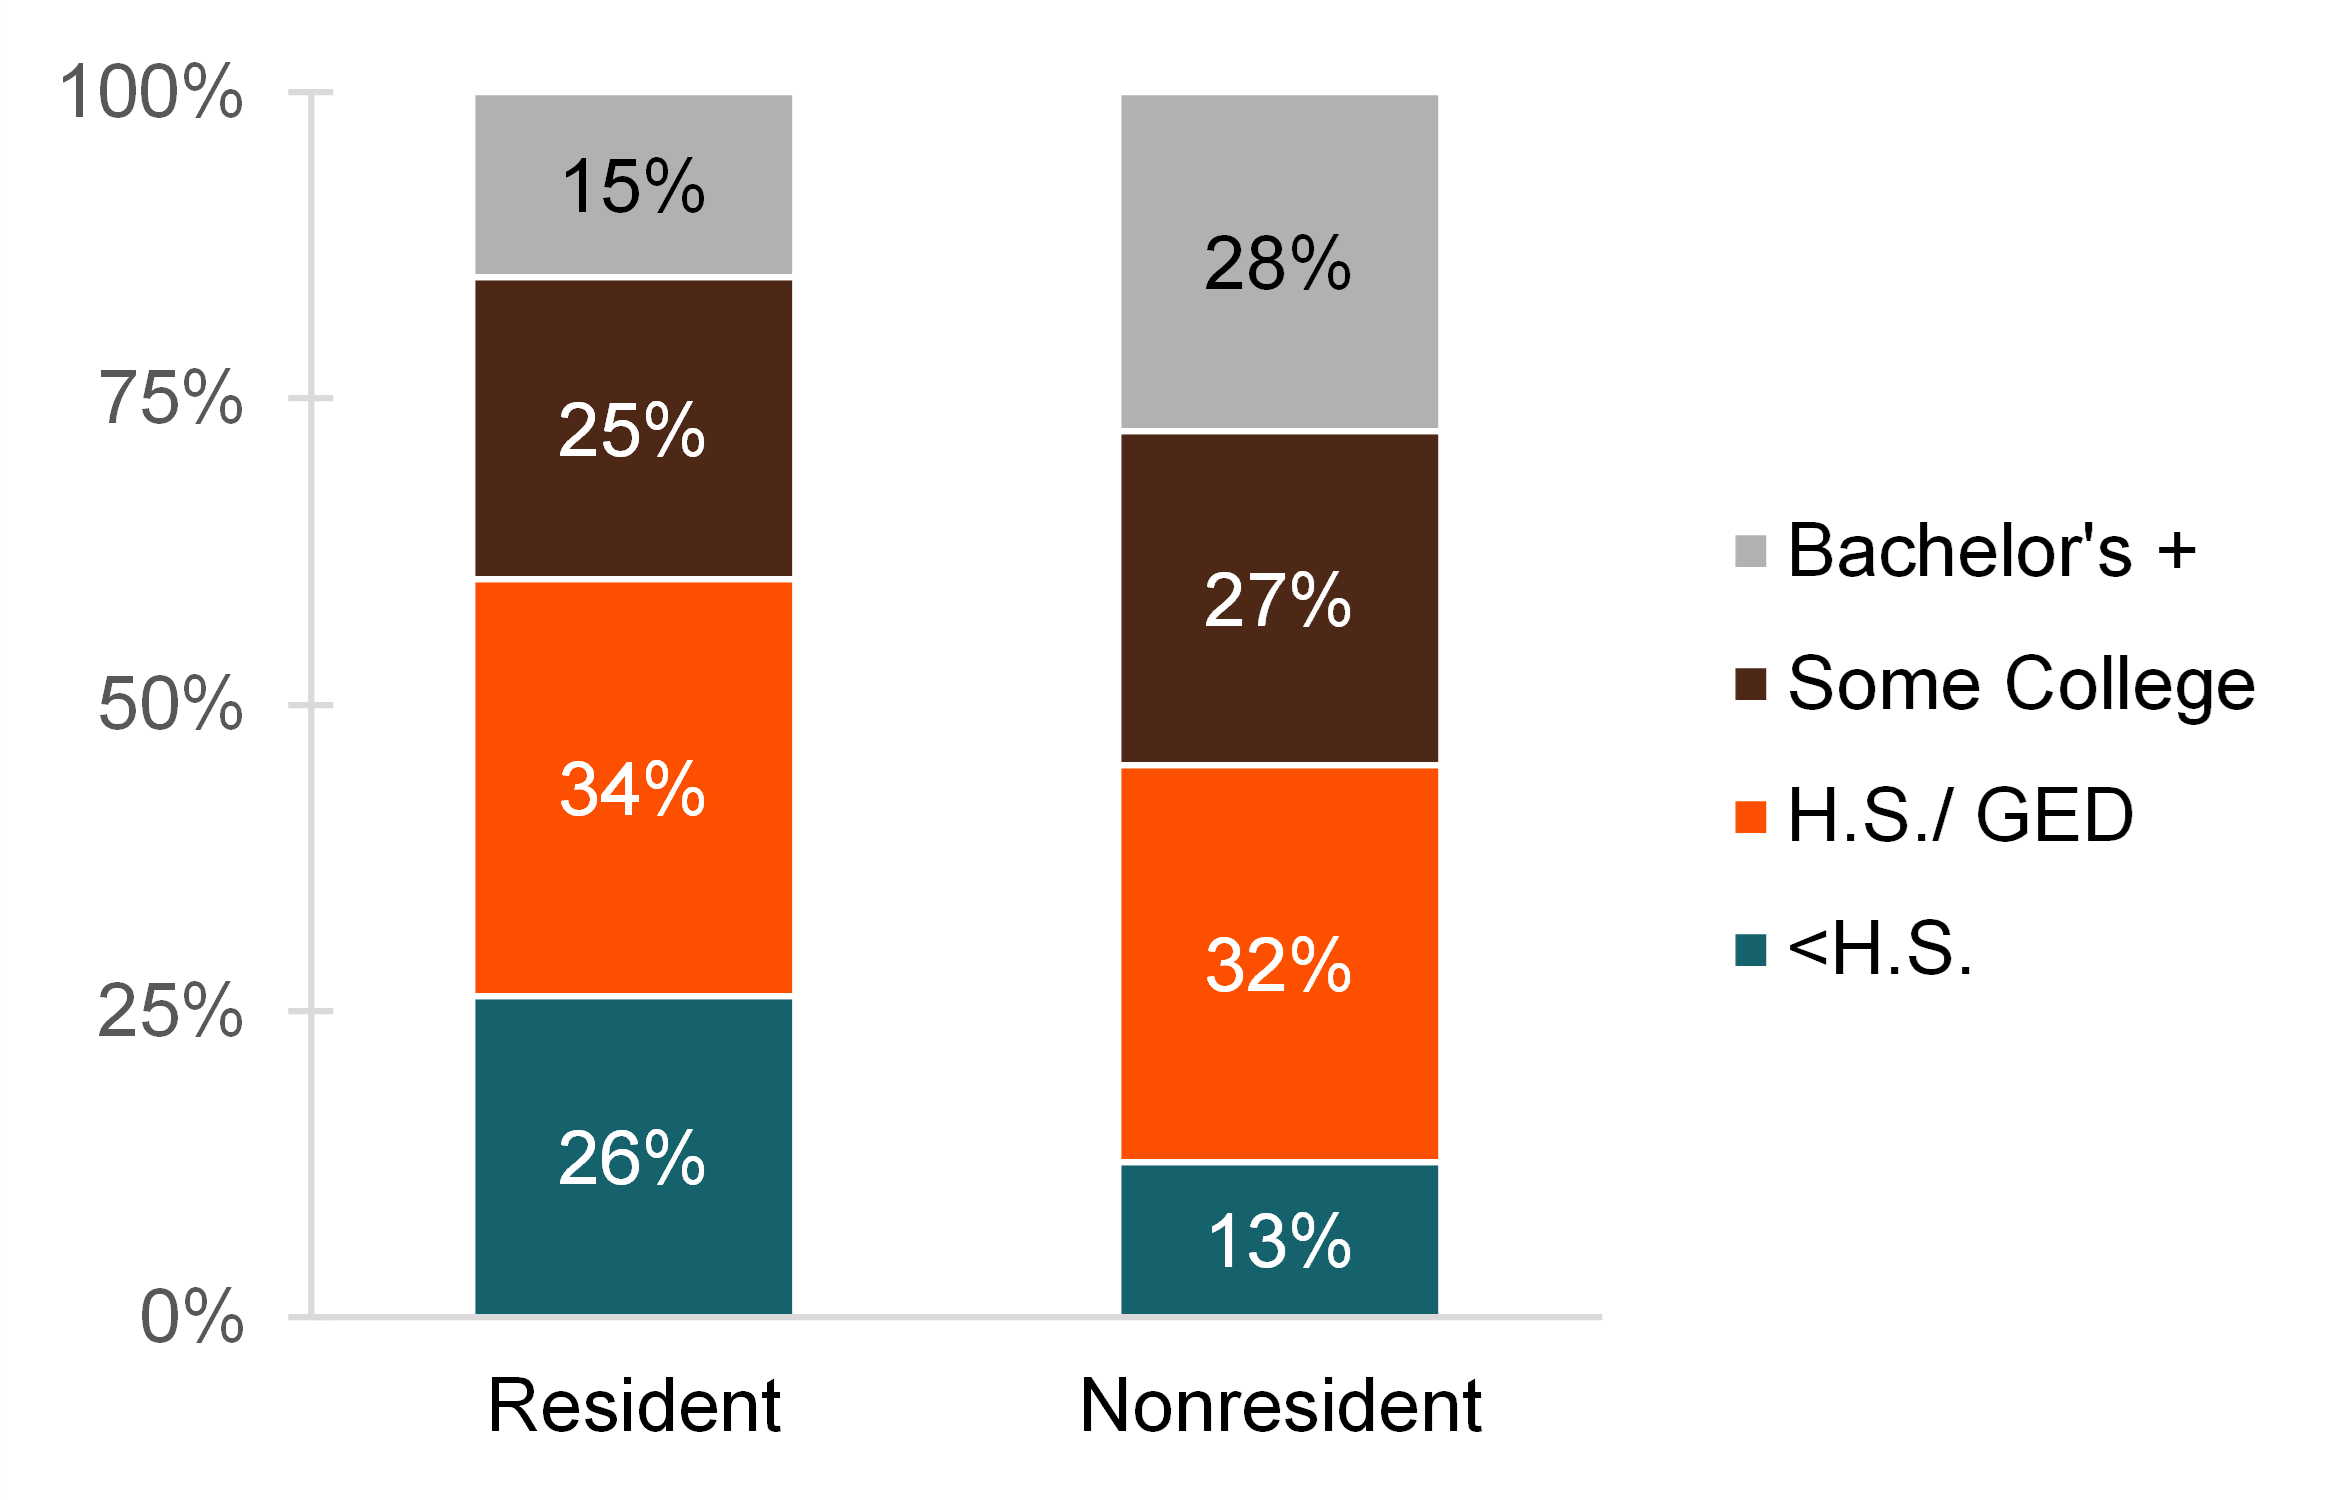
- Resident grandparents had lower levels of educational attainment than nonresident grandparents did.
- About one-quarter (26%) of resident grandparents had less than a high school education compared to 13% of nonresident grandparents.
- About one-third of grandparents had a high school diploma or GED—34% among resident and 32% among nonresident grandparents.
- About one-quarter of grandparents had some college—25% among resident and 27% among nonresident grandparents.
- Fifteen percent (15%) of resident grandparents had at least a bachelor’s degree, whereas 28% of nonresident grandparents were college graduates.
Figure 3. Educational Attainment of Grandparents by Resident Status of Grandchildren, 2021

Relationship Status of Grandparents by Age
- The relationship status of grandparents varied by their residency status with their grandchild(ren).
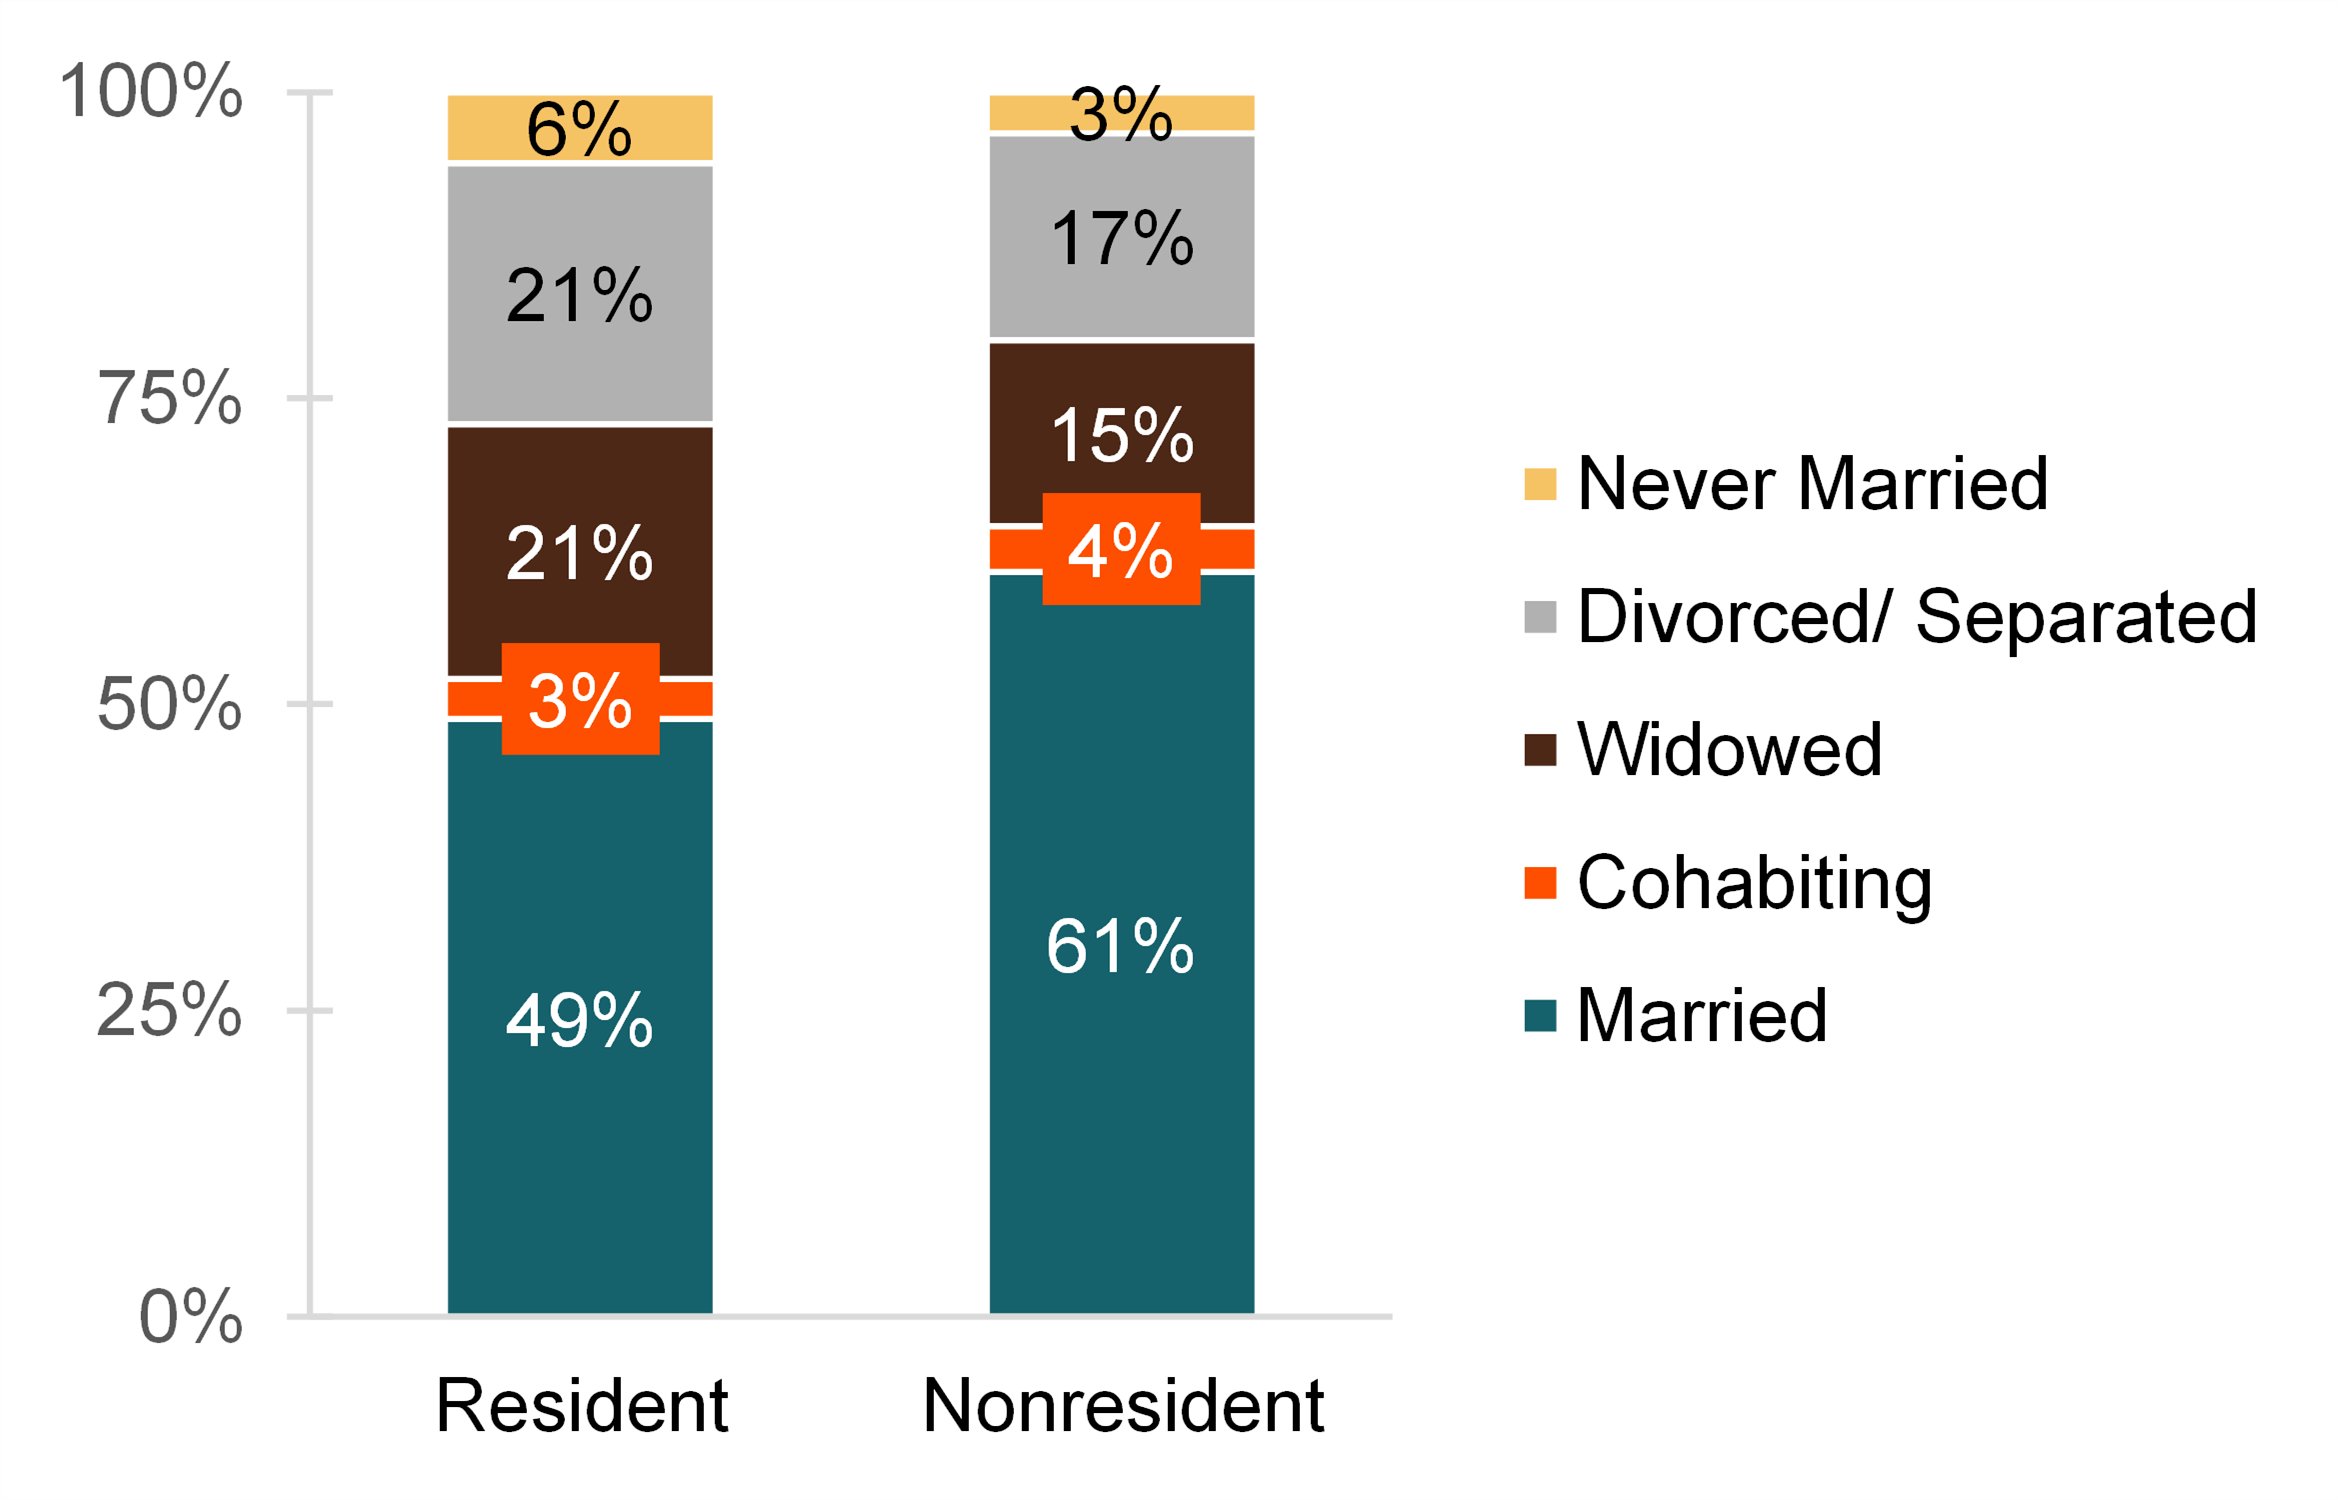
- The share of married grandparents was higher among nonresident grandparents compared to resident grandparents. About one-half (49%) of resident grandparents were married compared to three-fifths (61%) of nonresident grandparents.
- Similar shares were in a cohabiting relationship—3% among resident and 4% among nonresident grandparents.
- The share currently widowed was larger among resident grandparents, 21% versus 15%. Similarly, among resident grandparents 21% were divorced or separated compared to 17% among nonresident grandparents.
- Although the shares who were never married was small the share among resident grandparents was twice as large (6%) compared to that among nonresident grandparents (3%).
Figure 4. Relationship Status of Grandparents by Resident Status of Grandchildren, 2021

Data Source:
U.S. Census Bureau, Survey of Income and Program Participation 2014, Wave 1, and 2021. https://www.census.gov/programs-surveys/sipp.html
References:
Stykes, B., Manning, W. D., & Brown, S. L. (2014). Grandparenthood in the U.S.: Residency status of grandparents. Family Profiles, FP-14-12. Bowling Green, OH: National Center for Family & Marriage Research. https://www.bgsu.edu/content/dam/BGSU/college-of-arts-and-sciences/NCFMR/documents/FP/FP-14-12- grandparents-us.pdf
Wu, H. (2018). Grandparenthood in the U.S.: Residence status of grandchildren. Family Profiles, FP-18-05. Bowling Green, OH: National Center for Family & Marriage Research. https://doi.org/10.25035/ncfmr/fp-18-05
Suggested Citation:
Westrick-Payne, K. K. (2023). Grandparenthood in the U.S.: Residence status of grandchildren. Family Profile, FP-23-03. National Center for Family & Marriage Research. https://doi.org/10.25035/ncfmr/fp-23-03
Updated: 11/12/2025 09:59AM


