Distributions of Age at First Birth, 1960-2018
Family Profile No. 11, 2020
Author: Valerie Schweizer and Karen Benjamin Guzzo
Rising average ages at first birth have been well documented (FP-18-25; FP-19-16). However, we know less about whether the age range of mothers at first births has widened or narrowed over time. Using 1960 and 1990 Vital Statistics data and the 2018 vital statistics from CDC WONDER, this profile examines changes in the age distributions of women’s age at first birth. We first present estimates of the age distributions over time, and then we investigate these distributions across racial/ethnic and educational groups in 2018. We use the diversity index, which measures the amount of variation in a population’s characteristics or experiences, to compare variation. Higher scores represent more diverse experiences (i.e., a wider age range of women at first birth). This profile builds on work by Cohen (2013). For companion profiles on the distribution of the ages at first marriage and remarriage, see FP-20-09 and FP-20-10.
Women’s Age at First Birth Distribution
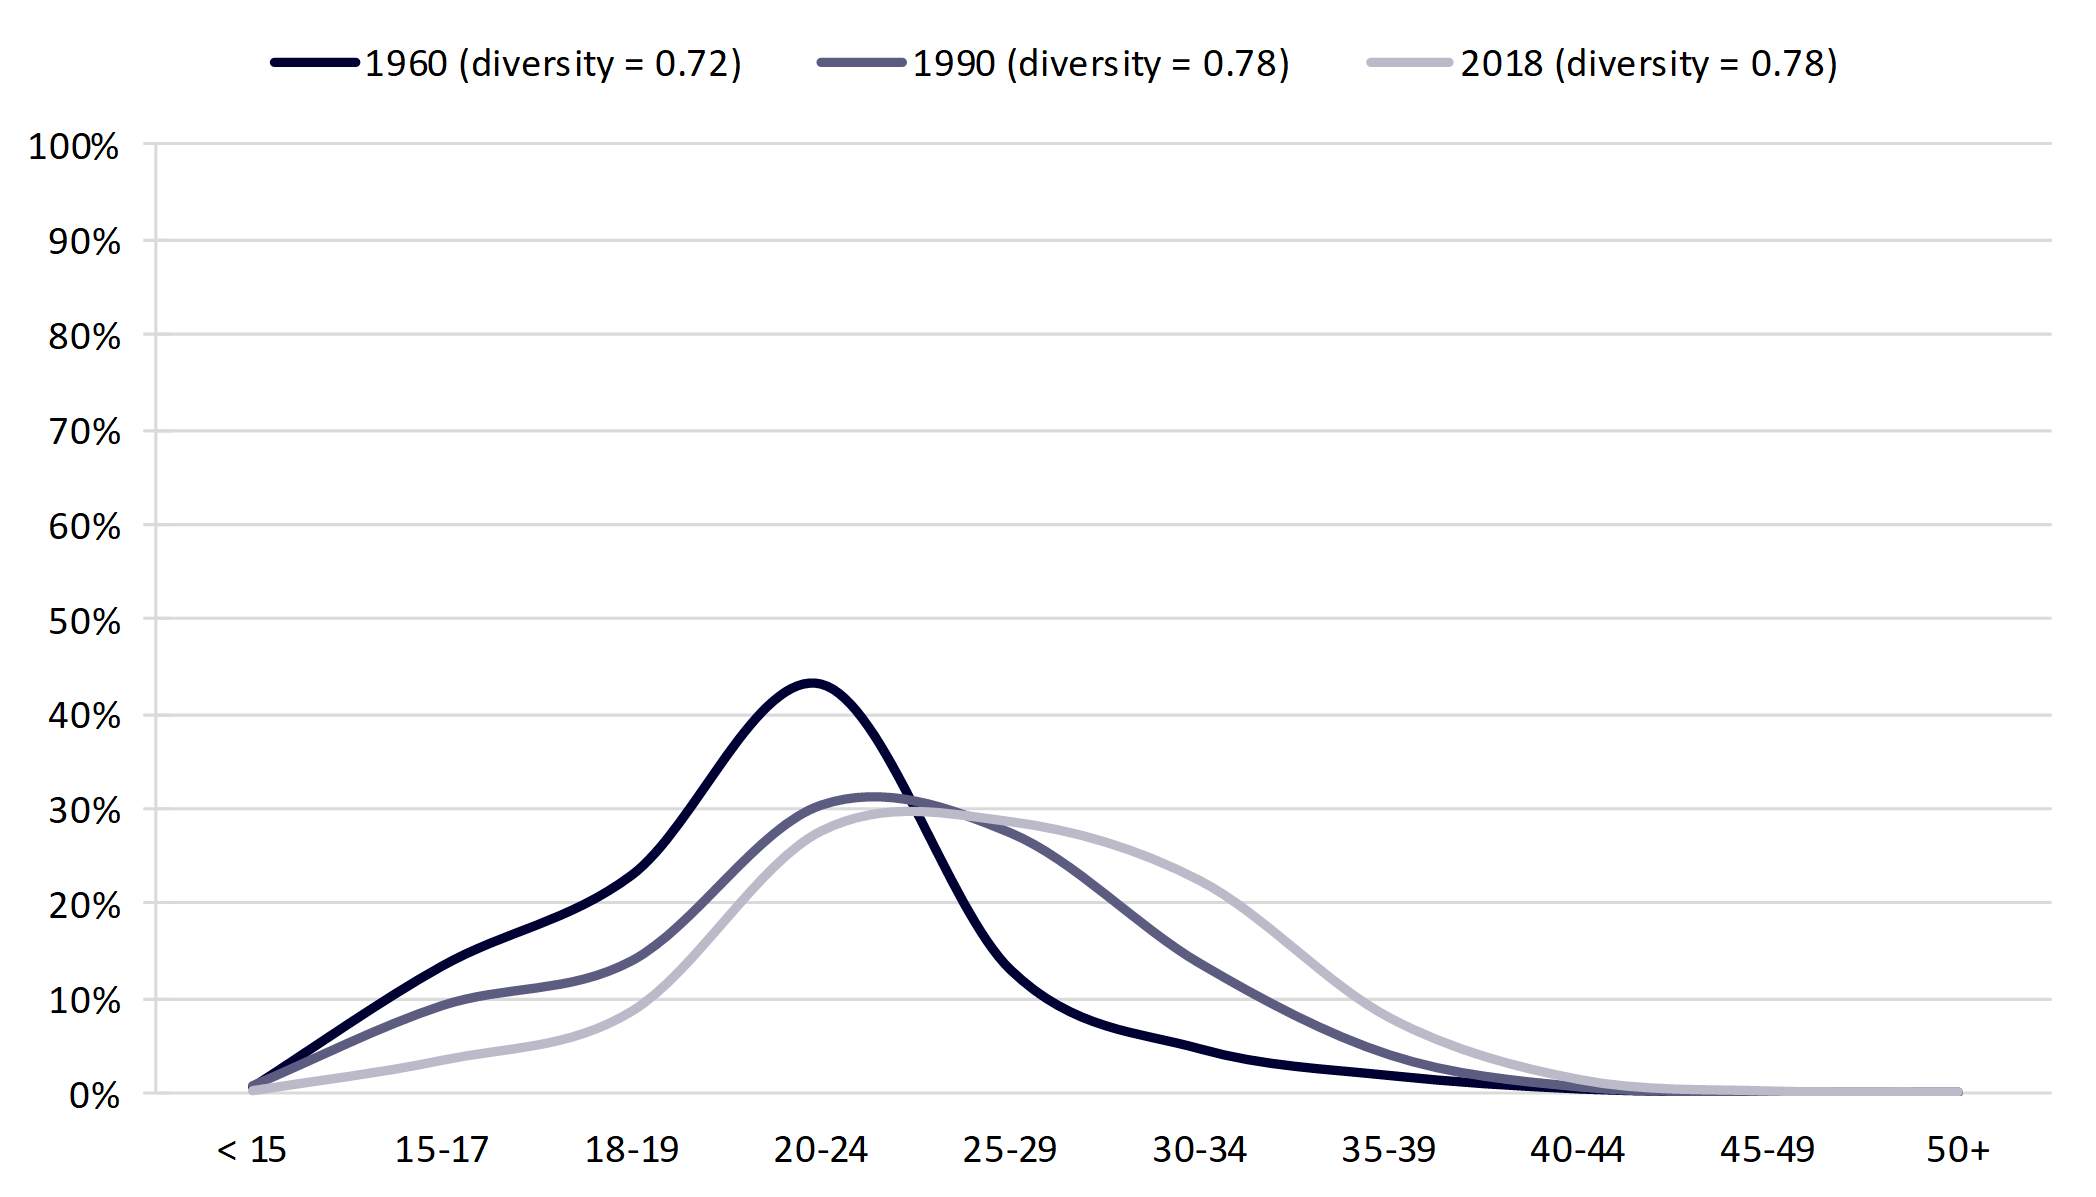
- The values of the diversity index indicate that the ages at first birth widened between 1960 and 1990 but did not change appreciably between 1990 and 2018.
- In 1960, the group of women with the largest share of first births was 20 to 24 years old (43%). By 1990, the share experiencing a first birth among this age group had declined to 31%, but it was still the most common age group.
- In 2018, first births among women occurred most often between ages 25 to 29 (29%).
Figure 1. Distributions of Women’s Age at First Birth, 1960, 1990, & 2018

Variation by Race/Ethnicity
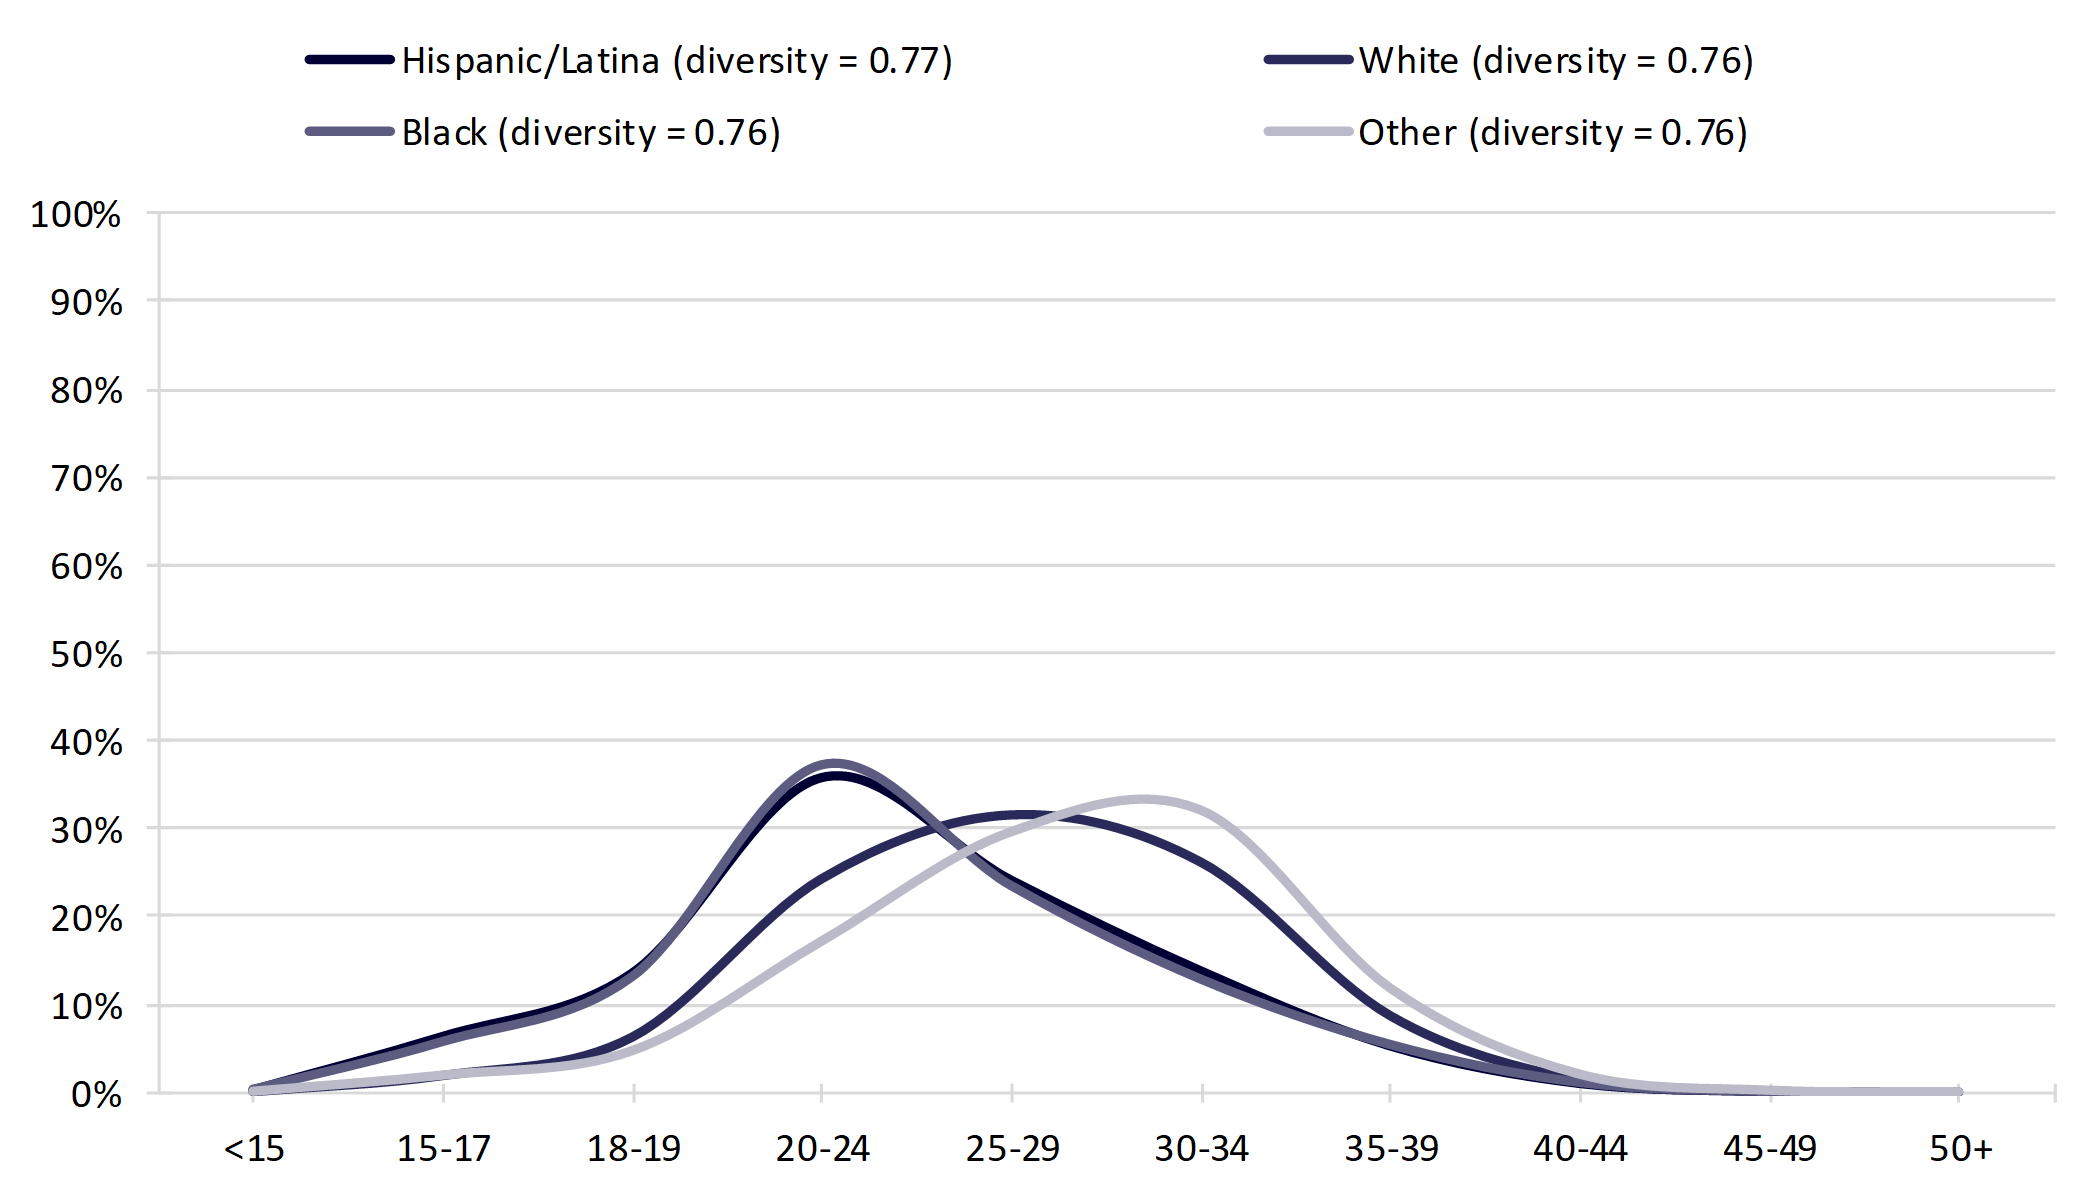
- Although the age interval in which the largest share of births occurs differs across groups, the diversity index values are essentially identical, meaning that although there is a wide range of ages for the transition to a first birth, the level of diversity varies little by race/ethnicity.
- Over one-third (36%) of Hispanic and Black women (37%) experienced a first birth between the ages of 20 and 24.
- Among White women, the age interval with the largest share of births was 25 to 29 (31%).
- Racial and ethnic Other women had the oldest ages at first birth, with about one-third (32%) of women experiencing a first birth between the ages of 30 to 34.
Figure 2. Distributions of Women’s Age at First Birth by Race/Ethnicity, 2018

Variation by Educational Attainment
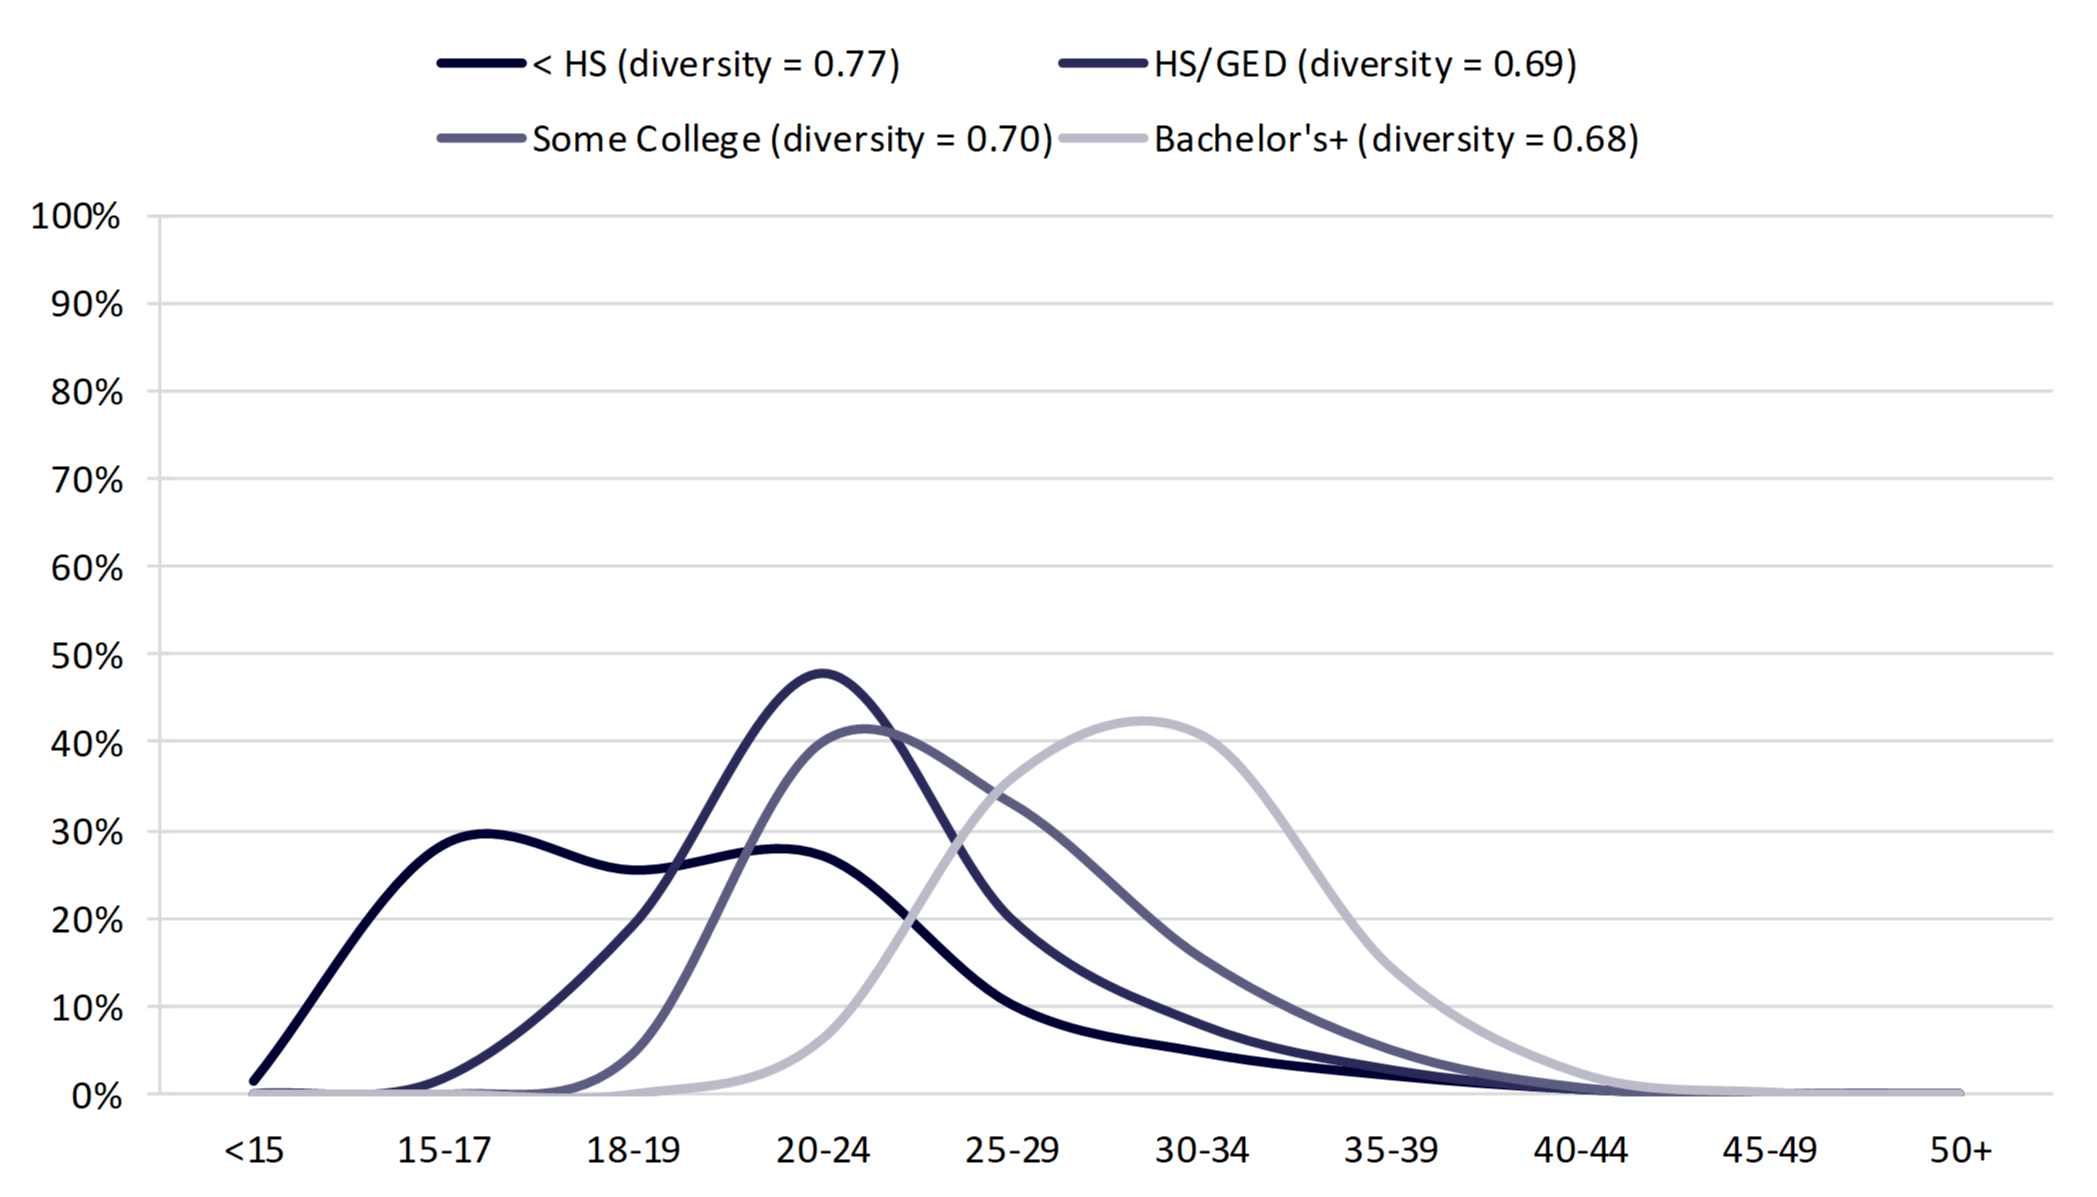
- The diversity index across educational categories ranges from 0.68 (bachelor’s degree or more) to 0.77 (less than high school), demonstrating that there is a wider age range for first births for women with the least education compared with their more educated counterparts.
- Women with less than a high school degree experienced the youngest ages at first birth, with over one-fourth (28%) having had a first birth between the ages of 15 and 17.
- Almost half (48%) of women with a high school diploma or GED had a first birth from 20 to 24 years old. This was also the most common age for women with some college (40%).
- Those with a bachelor’s degree or higher had the oldest ages at first birth, with 41% experiencing their first birth from 30 to 34 years old.
Figure 3. Distributions of Women’s Age at First Birth by Education, 2018

References
- Guzzo, K. B. & Payne, K. K. (2019). Average age at first birth, 1970 & 2017. Family Profiles, FP-18-25. Bowling Green, OH: National Center for Family & Marriage Research. https://doi.org/10.25035/ncfmr/fp-18-25
- Hemez, P. (2019). Family formation experiences: Women’s median ages at first marriage and first birth, 1979 & 2016. Family Profiles, FP-19-26. Bowling Green, OH: National Center for Family & Marriage Research. https://doi.org/10.25035/ncfmr/fp-19-16
Suggested Citation
- Schweizer, V. J. & Guzzo, K. B. (2020). Distributions of age at first birth, 1960-2018. Family Profiles, FP-20-11. Bowling Green, OH: National Center for Family & Marriage Research. https://doi.org/10.25035/ncfmr/fp-20-11
Updated: 11/12/2025 09:45AM

