Distributions of Age at First Marriage, 1960-2018
Family Profile No. 09, 2020
Author: Paul Hemez
Prior research has documented dramatic change in the ages at which men and women first marry (Manning, Brown, & Payne, 2014; Smock & Schwartz, 2020). In 1960, men’s median age at first marriage was about 22.8, and women first married at a median age of 20.3 (FP-19-06). However, 55 years later, these ages had increased to 29.2 and 27.1, for men and women respectively (FP-19-06). This increase is noteworthy, but it does not reveal whether or how the span or distribution of ages at which men and women marry has widened or shrunk over time. Using 1960 and 1990 vital statistics data from marriage certificates and the 2018 American Community Survey, this profile explores changes in the age distributions of men and women’s first marriages. This profile builds on work by Cohen (2013), and all analyses are restricted to states that were in 1960 Marriage Registration Areas. We use the diversity index, which measures the amount of variation in a population’s characteristics or experiences, to compare variation in distributions of age at first marriage, with higher scores representing more diverse experiences (i.e., a wider age range among first marriages). This Family Profile is part of a series on the age distributions of family formation experiences, with companion profiles exploring how the ages at remarriage and the transition to parenthood have shifted.
Men’s Age at First Marriage Distributions
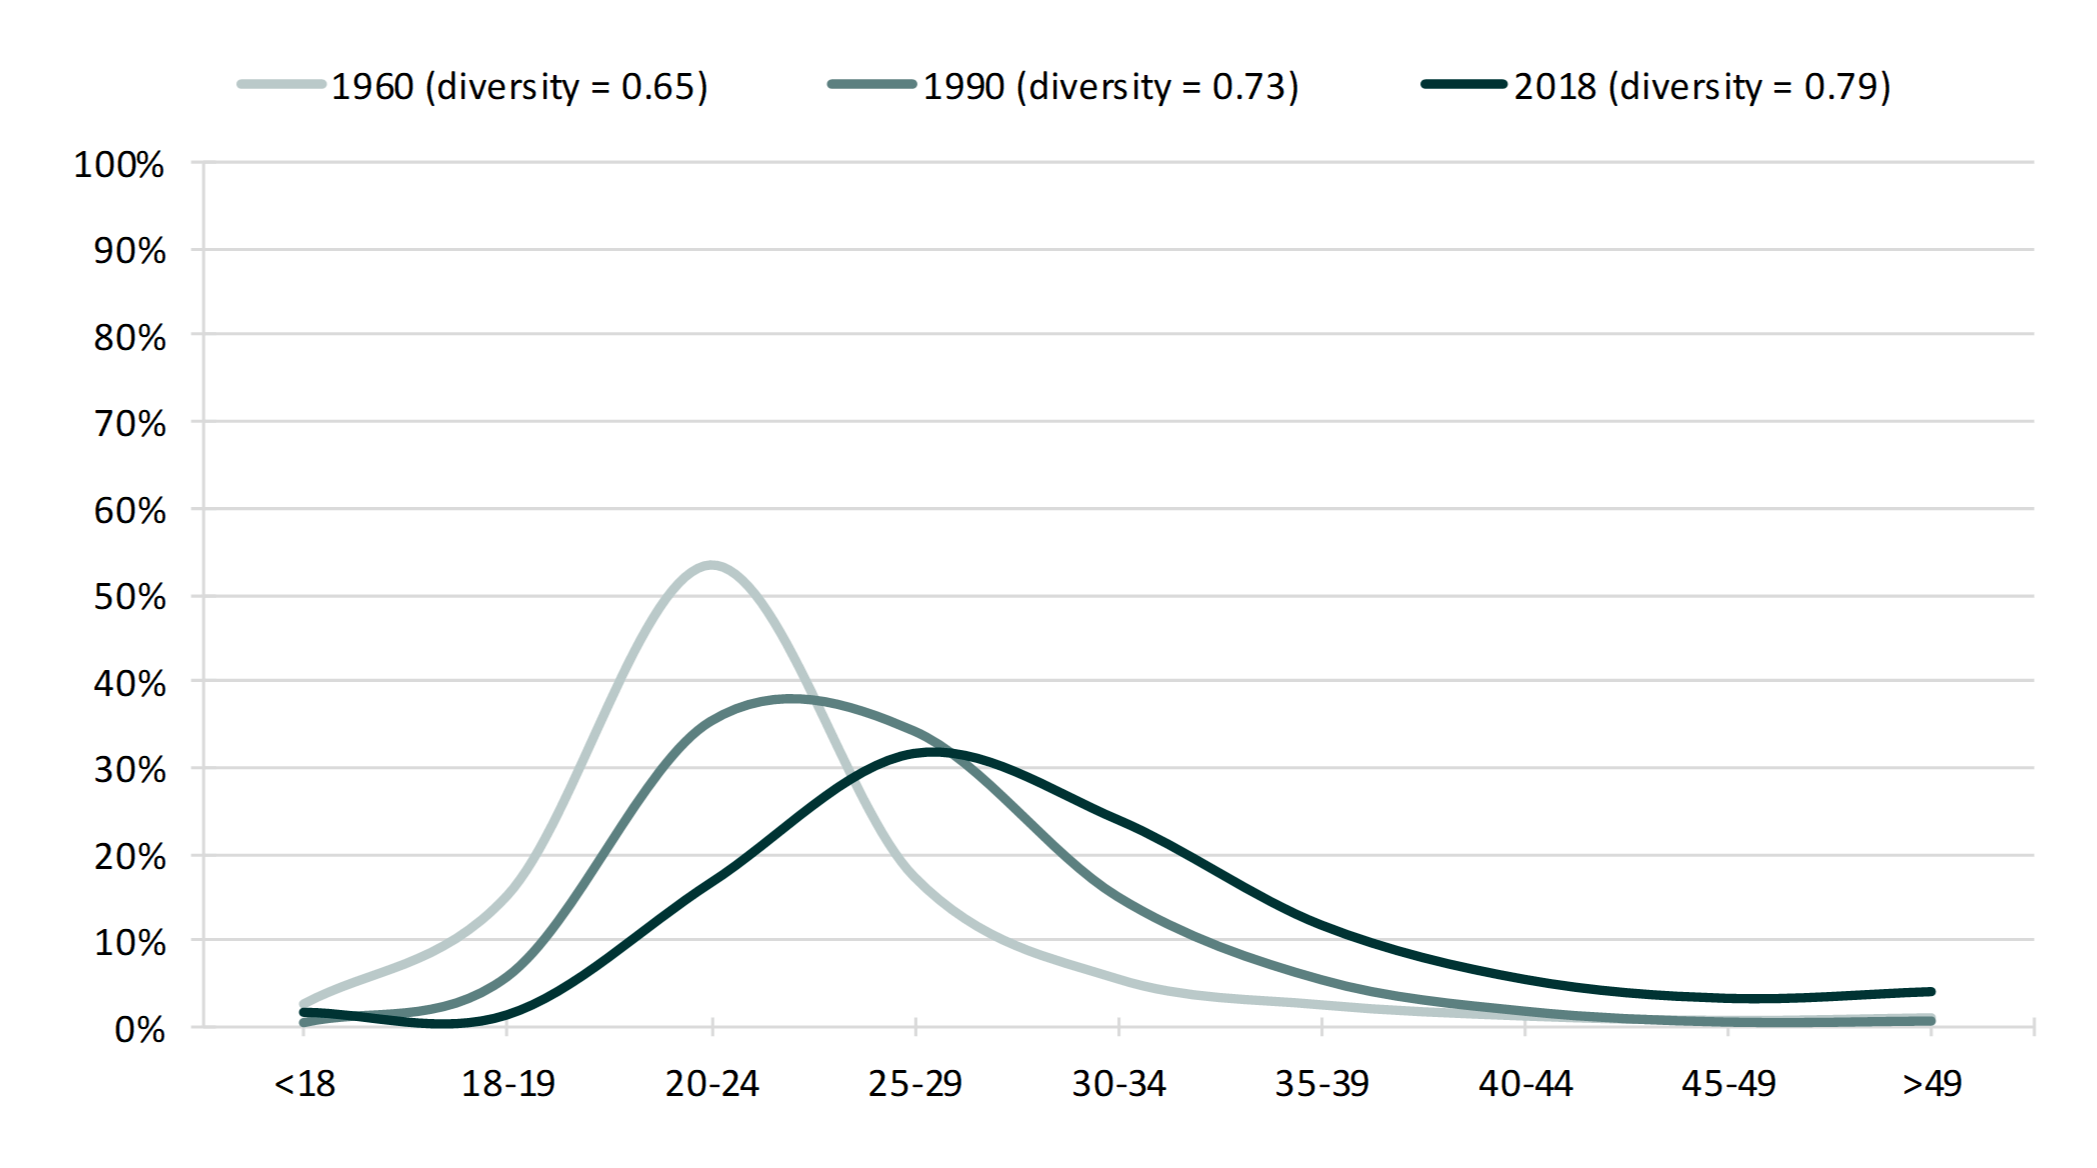
Values of the diversity index indicate the ages at first marriage have become increasingly diverse from 1960 to 2018, a pattern that is visually indicated by the flatter distributions characterizing the more recent time points.
- In 1960, the majority (54%) of men who married for the first time did so between the ages of 20 and 24. By 1990, this share declined to 35%.
- In 2018, the most common age group in which men first married was 25 to 29, with about one-third (32%) of men first marrying between these ages.
- Men who first married before their 20th birthday made up about 18% of newly married men in 1960. By 2018, however, this share declined to 3%.
- Among men who married for the first time, the share who were 30 or older more than quadrupled from 11% in 1960 to 49% in 2018.
Figure 1. Men’s Distributions of Age at First Marriage

Women’s Age at First Marriage Distributions
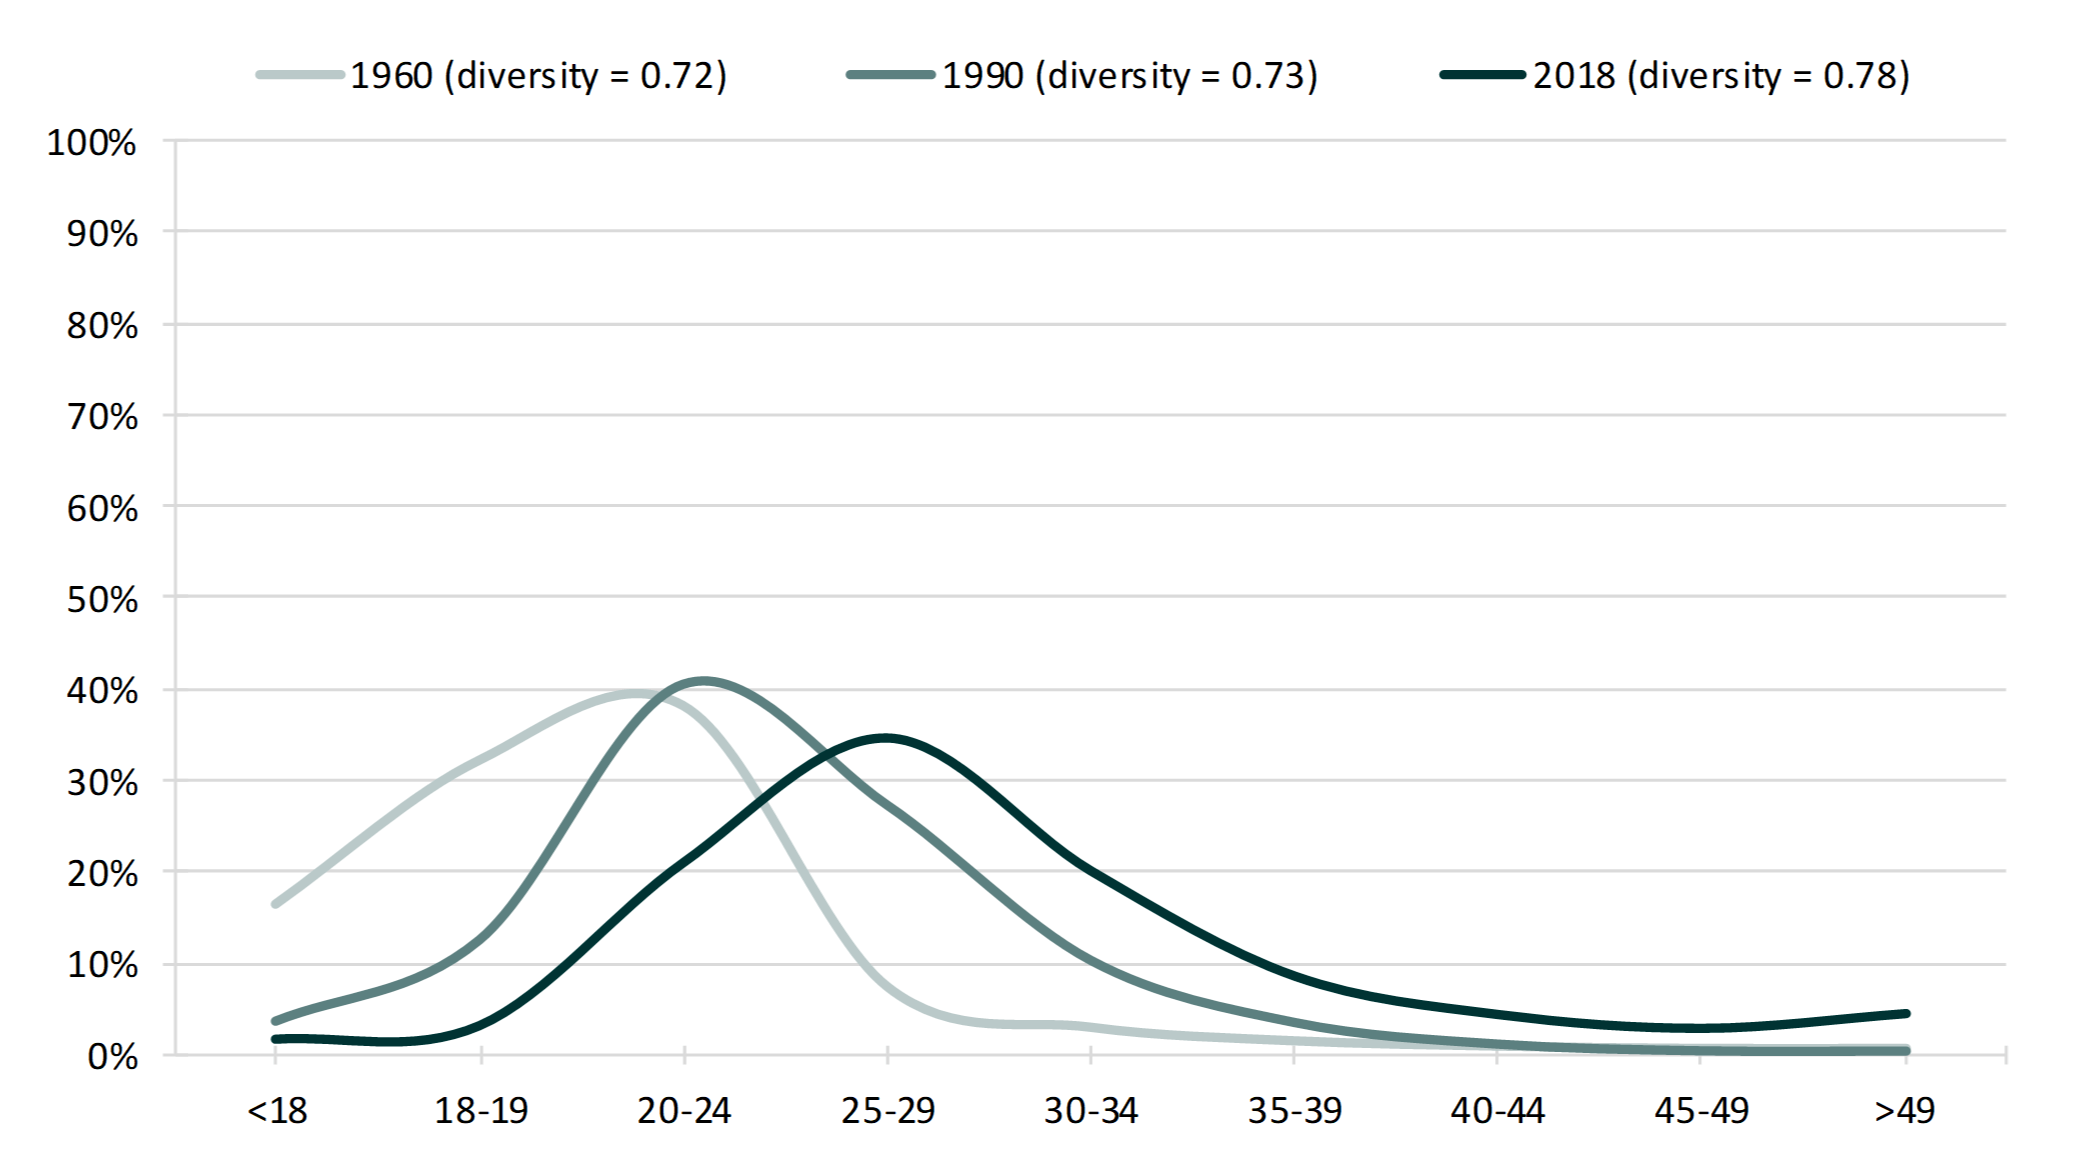
Between 1960 and 1990, there was little change in the diversity of women’s age at first marriage. By 2018, however, women’s ages at first marriage became more diverse.
- In 1960, about one in six (16%) women who married for the first time were younger than the age of 18, and only about one in fifteen (6%) of these women were 30 or older when they first married. Thirty years later (in 1990), these shares had reversed; about 4% of women had experienced a first marriage before age 18, and about 16% were 30 or older.
- By 2018, fewer than 2% of women’s first marriages occurred to those aged less than 18, whereas 40% of women were 30 or older.
- In 1990, 41% of women who married for the first time were 20-24 (the modal age group). This proportion nearly halved by 2018 (21%) as the modal age group shifted to 25-29.
Figure 2. Women’s Distributions of Age at First Marriage


References
- Cohen, P. N. (2013). Data visualization: Is U.S. society becoming more diverse? Family Inequality. https://familyinequality.wordpress.com/2013/02/17/data-visualizations-is-u-s-society-becoming-more-diverse/
- Manning, W. D., Brown, S. L., & Payne, K. K. (2014). Two decades of stability and change in age at first union formation. Journal of Marriage and Family, 76(2), 247-260.
- Payne, K. K. (2019). Median age at first marriage, 2017. Family Profiles, FP-19-06. Bowling Green, OH: National Center for Family & Marriage Research. https://doi.org/10.25035/ncfmr/fp-19-06.
- Smock, P. J., & Schwartz, C. R. (2020). The demography of families: A review of patterns and change. Journal of Marriage and Family, 82(1), 9-34.
Suggested Citation
- Hemez, P. (2020). Distributions of age at first marriage, 1960-2018. Family Profiles, FP-20-09. Bowling Green, OH: National Center for Family & Marriage Research. https://doi.org/10.25035/ncfmr/fp-20-09

This project is supported with assistance from Bowling Green State University. From 2007 to 2013, support was also provided by the U.S. Department of Health and Human Services, Office of the Assistant Secretary for Planning and Evaluation. The opinions and conclusions expressed herein are solely those of the author(s) and should not be construed as representing the opinions or policy of any agency of the state or federal government.
Updated: 04/06/2021 02:08PM


