First-Birth Timing Expectations Among Adults Intending Children
Family Profile No. 06, 2022
Author: Karen Benjamin Guzzo
Childbearing behaviors have changed dramatically in the U.S. over the past few decades, driven in large part by increases in first-birth timing (FP-19-28). As the age at first birth continues to rise, understanding expected first-birth timing among those who intend, but do not yet have, any children may provide insight into likely future birth trends. This profile uses the 2015-2019 National Survey of Family Growth (NSFG) to examine first-birth timing expectations among adults aged 18-49 who did not have any children but intended to have children in the future. We consider timing expectations for men and women separately and, within gender, examine age and marital status differences. The data are weighted and represent the year 2017.
First-birth Timing by Gender
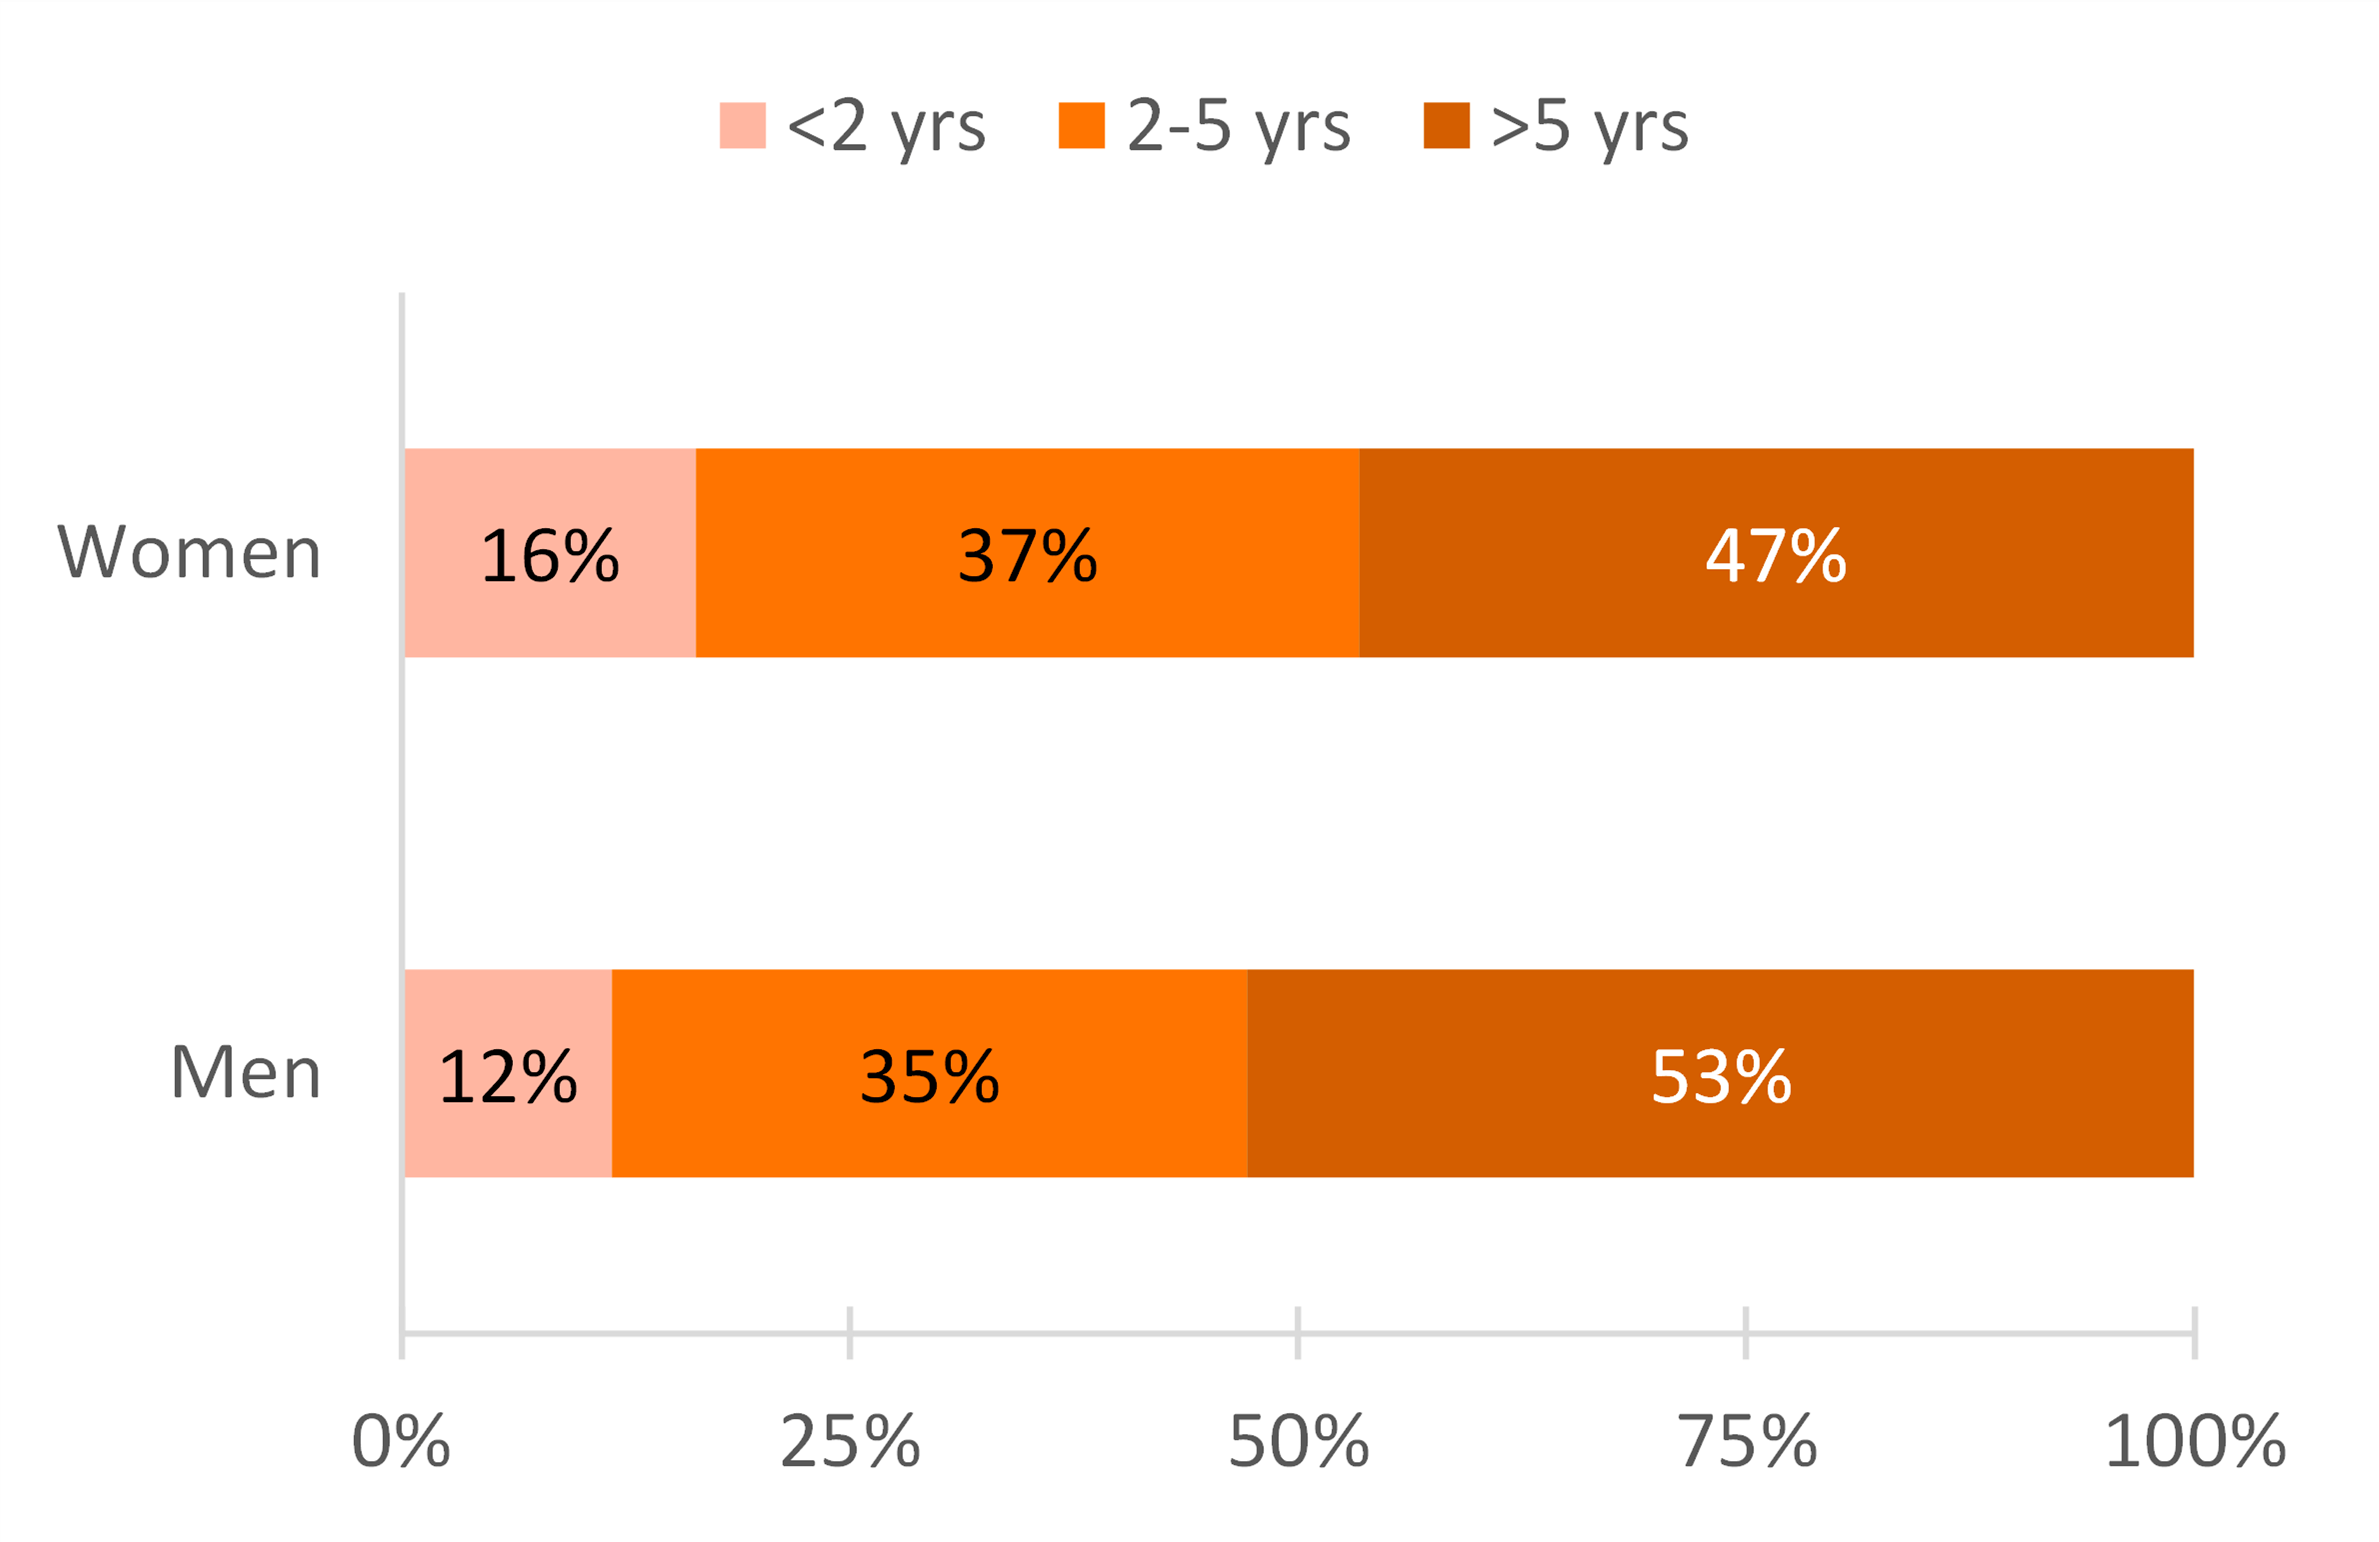
- Among those who did not yet have children but intended to do so, men’s expected timeframe for becoming a parent was later than women’s.
- About one in six women expected to have their first child within the next two years, with 37% expecting to have their first child within two to five years, and just under half (47%) expecting to have a child more than five years later.
- Just over half of men expected to have their first child more than five years later, with only 12% expecting to do so within the next two years.
Figure 1. First-birth Timing Expectations by Gender

First-birth Timing by Age and Gender
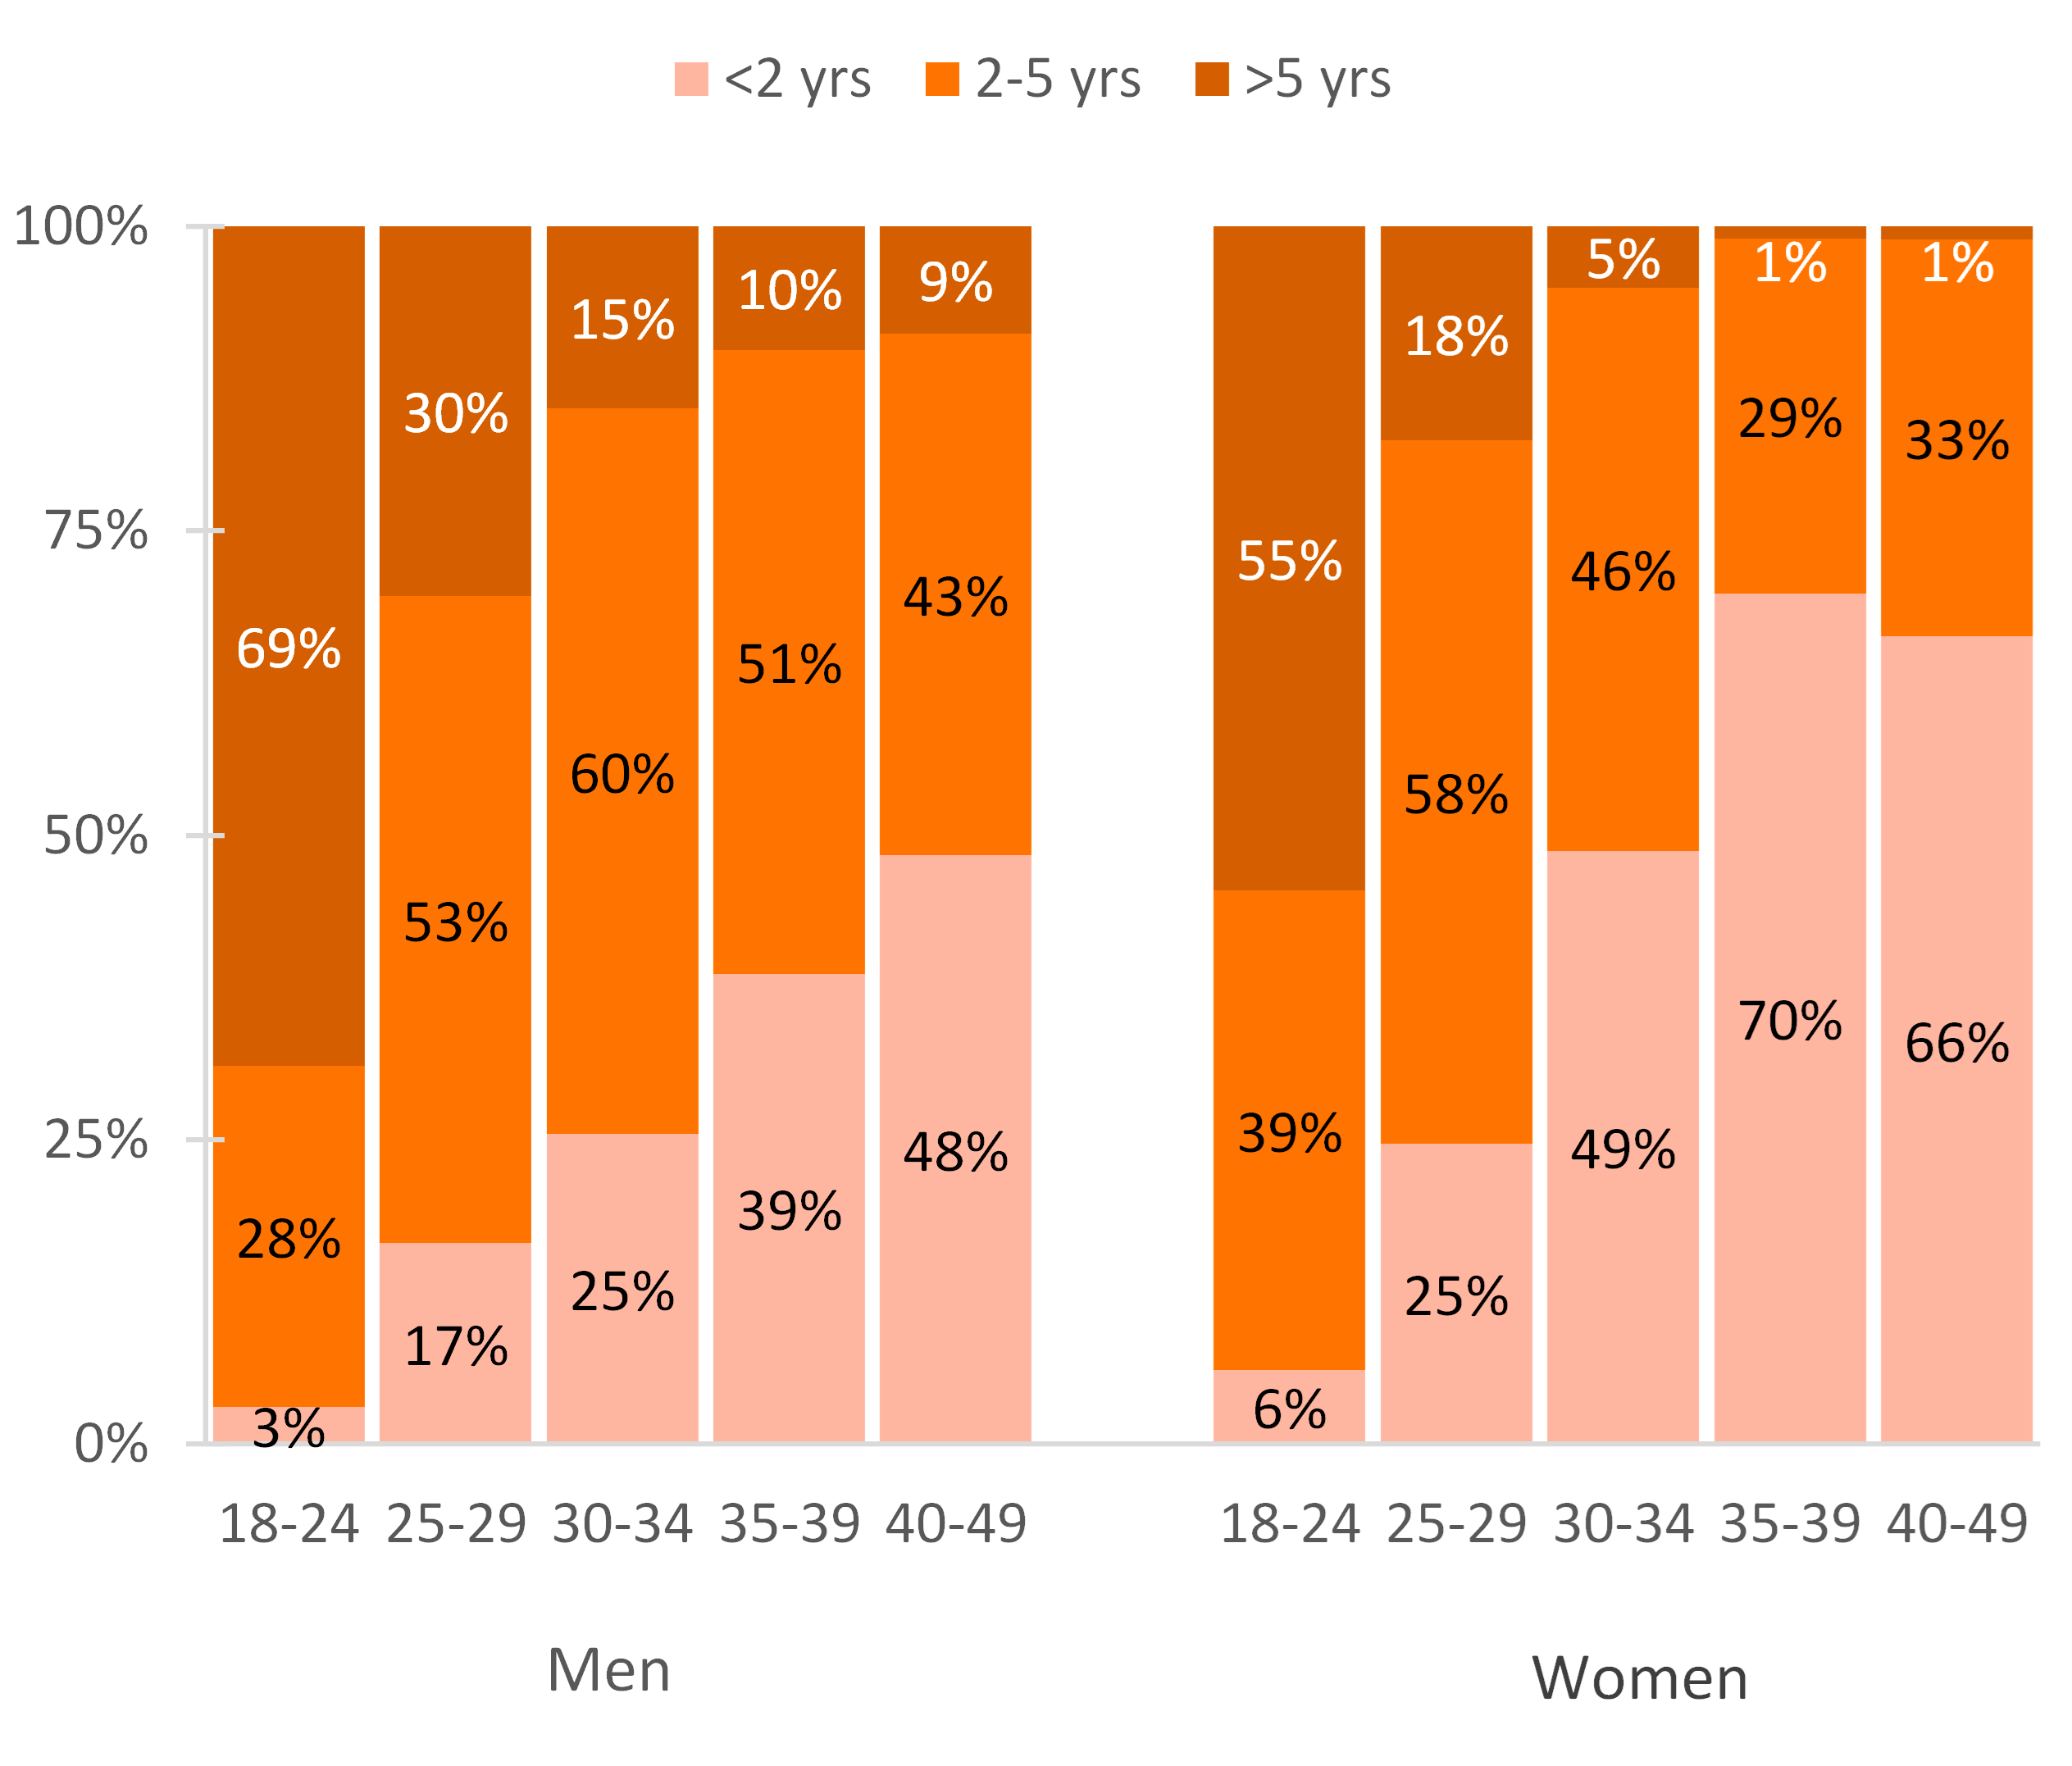
- Younger men and women without children but with intentions to have children had longer expected timeframes for their anticipated transition to parenthood than their older counterparts.
- Gender differences existed across age groups and widened in the 30s.
- Among those aged 18-24, 69% of men expected to have their first birth more than five years later compared to 55% of women.
- In the late 20s, one in four women who intended to have a child expected to do so within the next two years, but only one in six men in this age group expected to have a child as soon.
- About twice as many women than men aged 30-34 expected to have their first child within the next two years (49% and 25%, respectively).
- Only 30% of women aged 35-39 thought they would have a birth more than two years later, whereas just over 60% of men in this age group expected to do so.
- Among adults in their 40s who intended children, two-thirds of women expected to become a parent within two years, compared to less than half of men.
Figure 2. First-birth Timing Expectations by Age and Gender

First-birth Timing by Marital Status and Gender
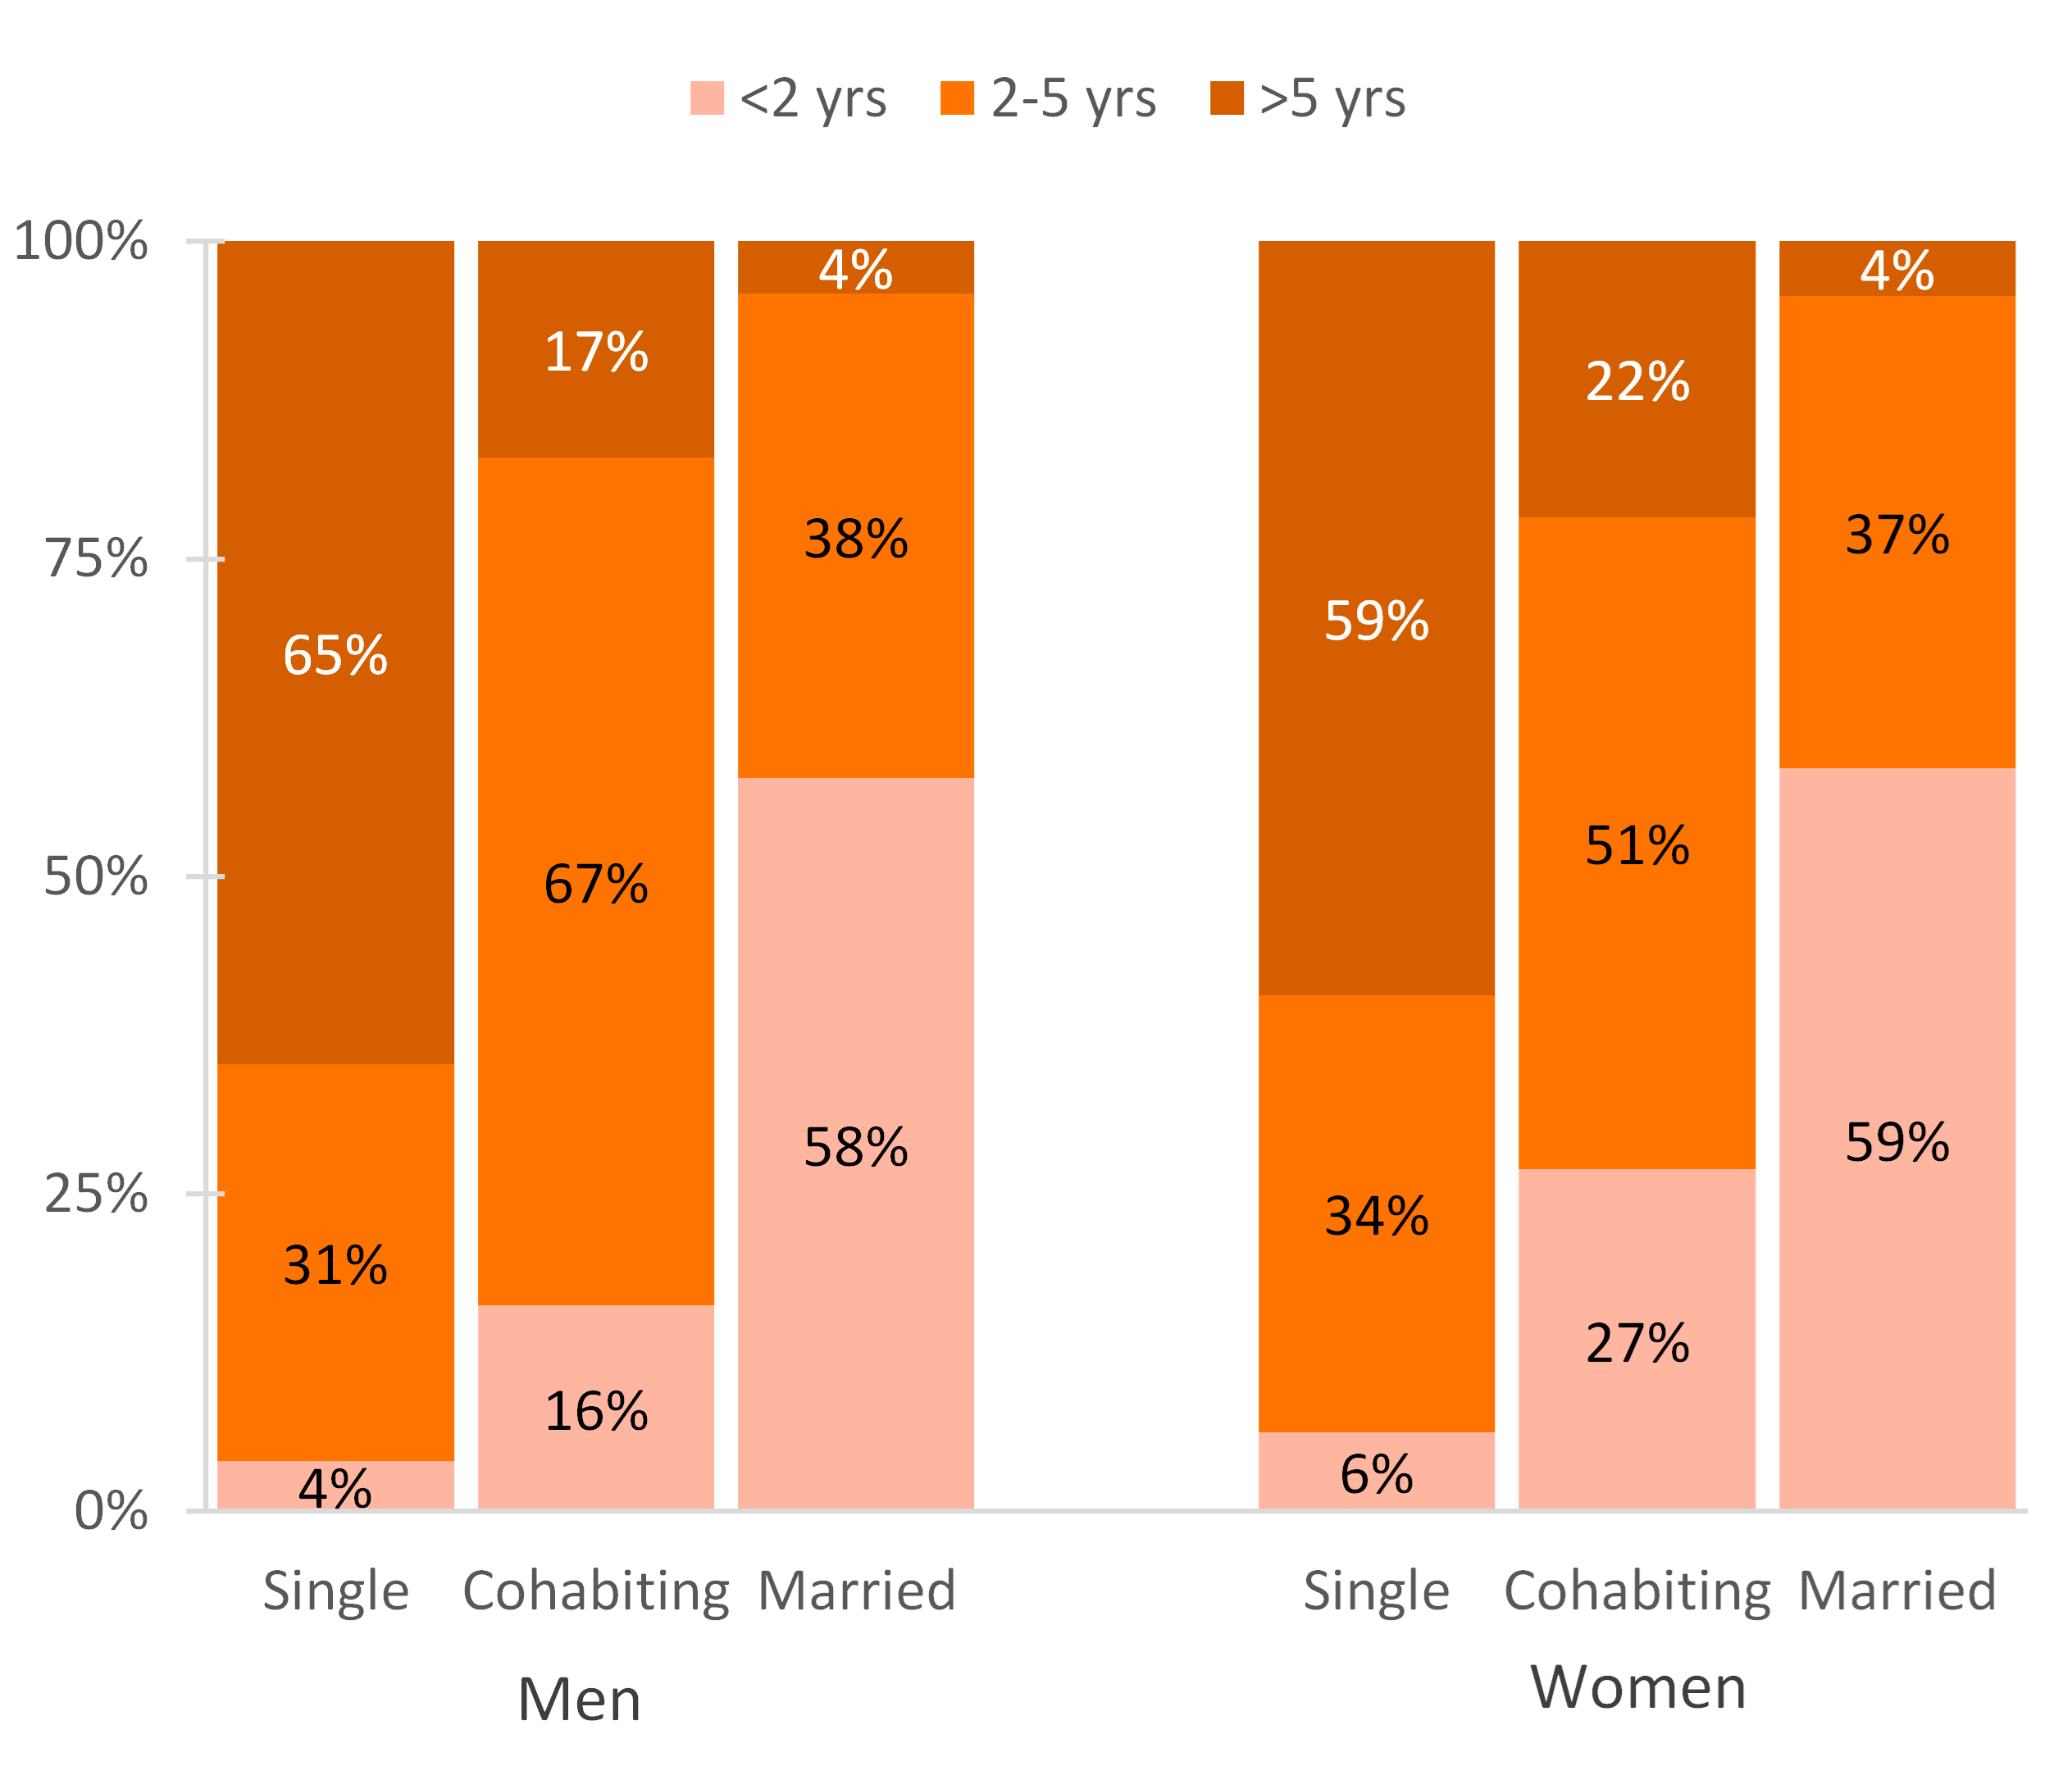
- Single men and women who intended to become parents had the longest expected timeframe for having their first birth, and married men and women had the shortest.
- Gender differences were minimal for married adults without children but remained for single and cohabiting adults.
- Just under two-thirds (65%) of single men expected to have their first child more than five years later compared to 59% of single women.
- Among cohabiting adults, slightly more than one in four women expect to have a birth within the next two years, with half expecting to do so within two to five years. For men, only about one in six men expected to have a birth within two years, and two-thirds expected to have their first birth within two to five years.
- For married men and women, the share who expected to have a birth within two years is similar, at 58% and 59%, respectively.
Figure 3. First-birth Timing Expectations by Marital Status and Gender


Among those who did not yet have children but intended to do so, men’s expected timeframe for becoming a parent was later than women’s.

Data Source:
National Center for Health Statistics (NCHS). 2015-17 and 2017-2019 National Survey of Family Growth Public-Use Data and Documentation. Hyattsville, MD: CDC National Center for Health Statistics. https://www.cdc.gov/nchs/nsfg/index.htm
References:
Schweizer, V. J. (2019). 30 Years of change in men’s entry into fatherhood, 1987-2017. Family Profiles, FP-19-28. Bowling Green, OH: National Center for Family & Marriage Research. https://doi.org/10.25035/ncfmr/fp-19-28
Suggested Citation:
Guzzo, K. B. (2022). First-birth timing expectations among childless adults intending children. Family Profiles, FP-22-06. Bowling Green, OH: National Center for Family & Marriage Research. https://doi.org/10.25035/ncfmr/fp-22-06

This project is supported with assistance from Bowling Green State University. From 2007 to 2013, support was also provided by the U.S. Department of Health and Human Services, Office of the Assistant Secretary for Planning and Evaluation. The opinions and conclusions expressed herein are solely those of the author(s) and should not be construed as representing the opinions or policy of any agency of the state or federal government.
Updated: 04/11/2022 03:57PM


