High School Seniors’ Expectations to Marry, 2017
Family Profile No. 11, 2019
Author: Colette Allred
The marriage rate in the United States has decreased from 76.5 marriages per 1,000 unmarried women in 1970 to 32.2 in 2017 (FP-18-20). Although women and men are delaying marriage (FP-19-06), with a growing proportion never marrying (U.S. Census Bureau; FP-18-17), most adolescents still expect to marry at some point in the future. The current profile examines a four-decade shift in whether high school seniors expect to marry by parental educational attainment, race/ethnicity, and gender. This profile is an update to analyses using 2014 data (FP-16-14) and is the second in a three-part series using Monitoring the Future data to analyze high school seniors’ attitudes toward and expectations regarding cohabitation and marriage.
Expectations to Marry Over Time
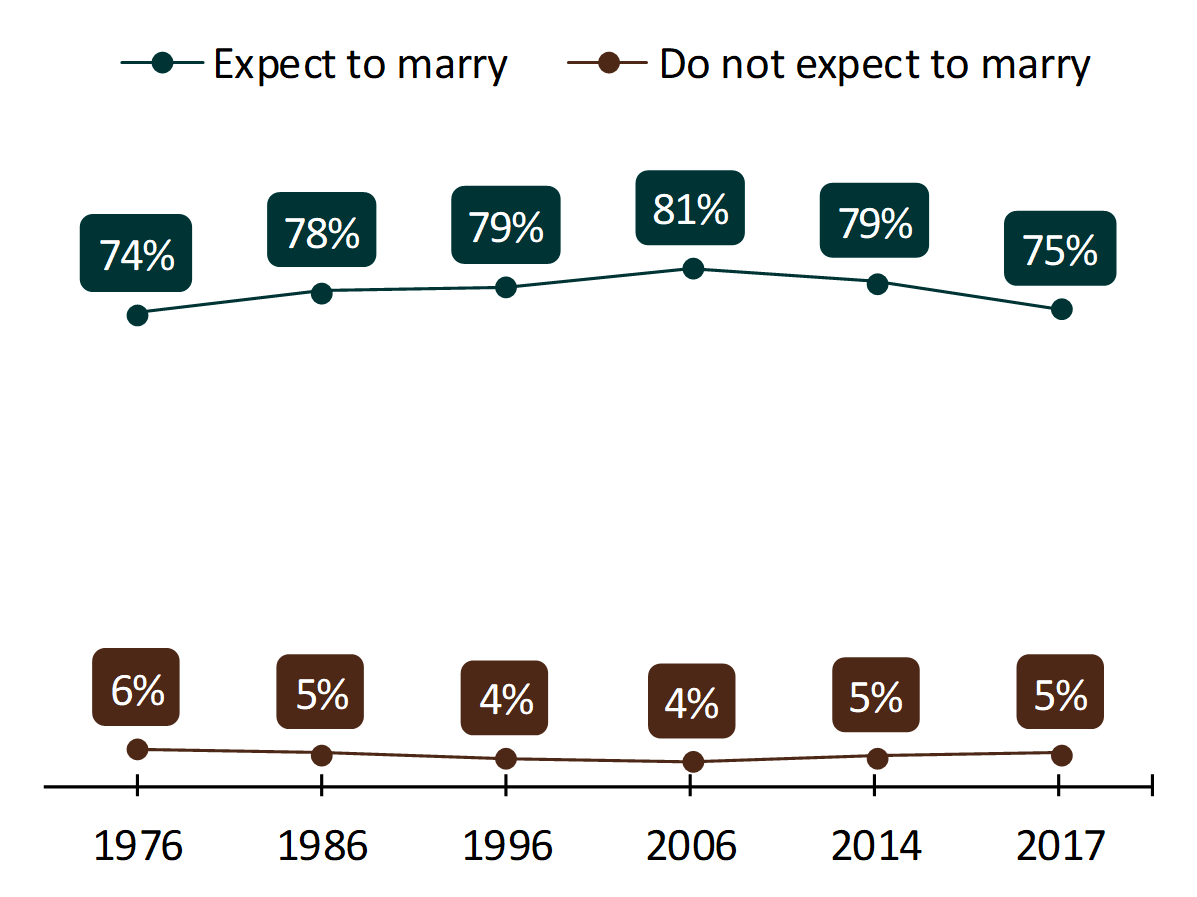
- Despite a 58% decrease in the U.S. marriage rate since 1970, the share of high school seniors who expect to marry has changed little.
- Since 1976, the vast majority (at least three-fourths) of high school seniors report they expect to marry in the future.
- Very few (about 5%) high school seniors reported they do not expect to marry.
- The graph does not display responses from those who either have “no idea” (19% in both 1976 and 2017) or were already married.
Figure 1. High School Seniors’ Expectations to Marry, 1976-2017

Source: NCFMR analyses of Monitoring the Future, 1976-2017
Expectations to Marry by Parental Educational Attainment
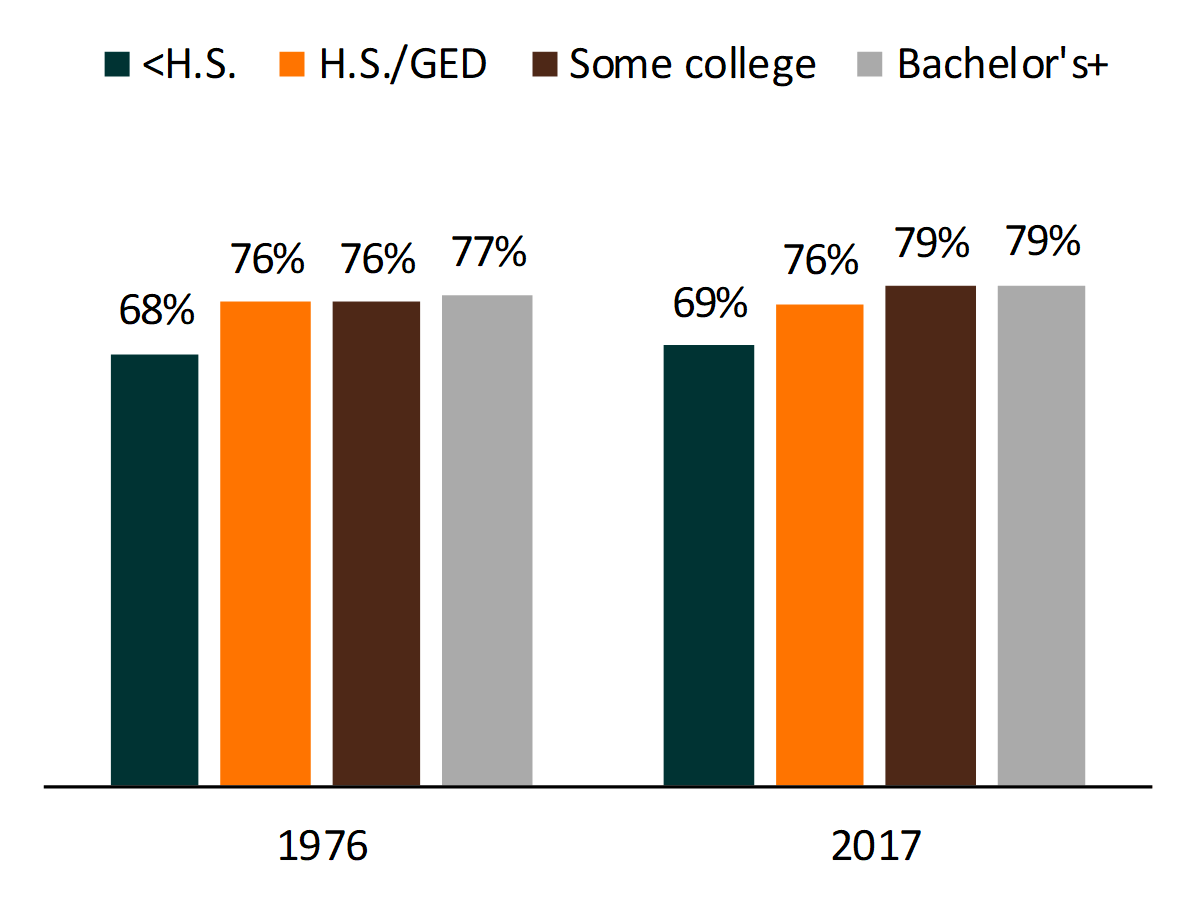
- The education gradient in expectations to marry persists. High school seniors whose parents had higher levels of education more often reported expecting to marry than those whose parents had lower levels of education.
- About two-thirds (69%) of high school seniors who have parents without a high school degree expected to marry in contrast to 79% of high school seniors who have parents with a college degree.
Figure 2. High School Seniors Who Expected to Marry by Parental Education, 1976 and 2017

Source: NCFMR analyses of Monitoring the Future, 1976-2017
Expectations to Marry by Race & Ethnicity
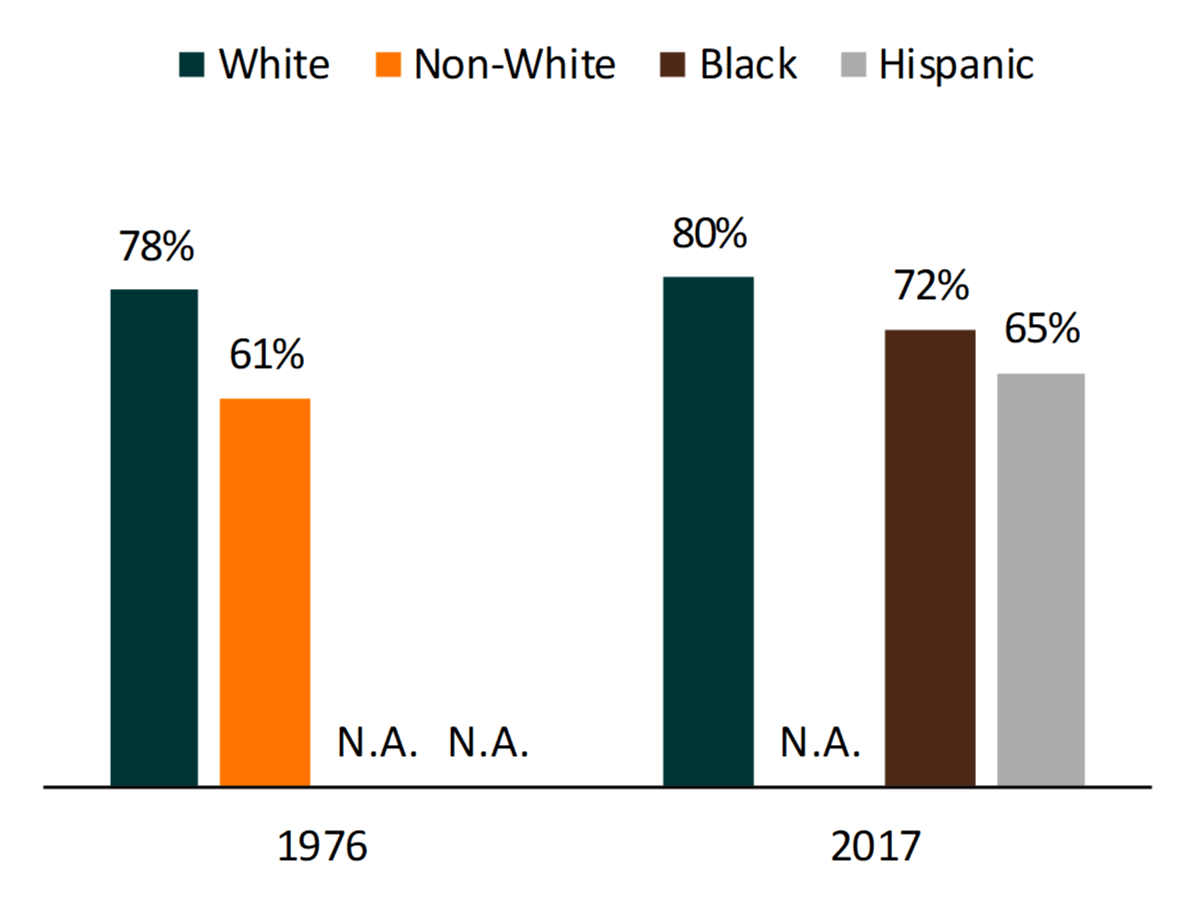
- Over the past four decades, a higher share of White high school seniors reported they expect to marry than other racial/ethnic groups.
- In 1976, 61% of non-White high school seniors reported they expect to marry. By 2017, the shares among nonWhites seems to have increased with 72% expecting to marry among Blacks and 65% among Hispanics.
- Nearly 8 in 10 White high school seniors expected to marry in 1976 as well as in 2017.
Figure 3. High School Seniors Who Expected to Marry by Race/Ethnicity, 1976 and 2017

Source: NCFMR analyses of Monitoring the Future, 1976-2017
Expectations to Marry by Gender and Race & Ethnicity
Overall, 73% of young men and 78% of young women expected to marry in 2017 (not shown). This level is similar to the shares in 1976 when 70% of men and 80% of women expected to marry. The gender gap has diminished slightly over time, with the share of men who expect to marry increasing, while the share of women who expect to marry has decreased.
The gender gap in expectations to marry differs according to race and ethnicity.
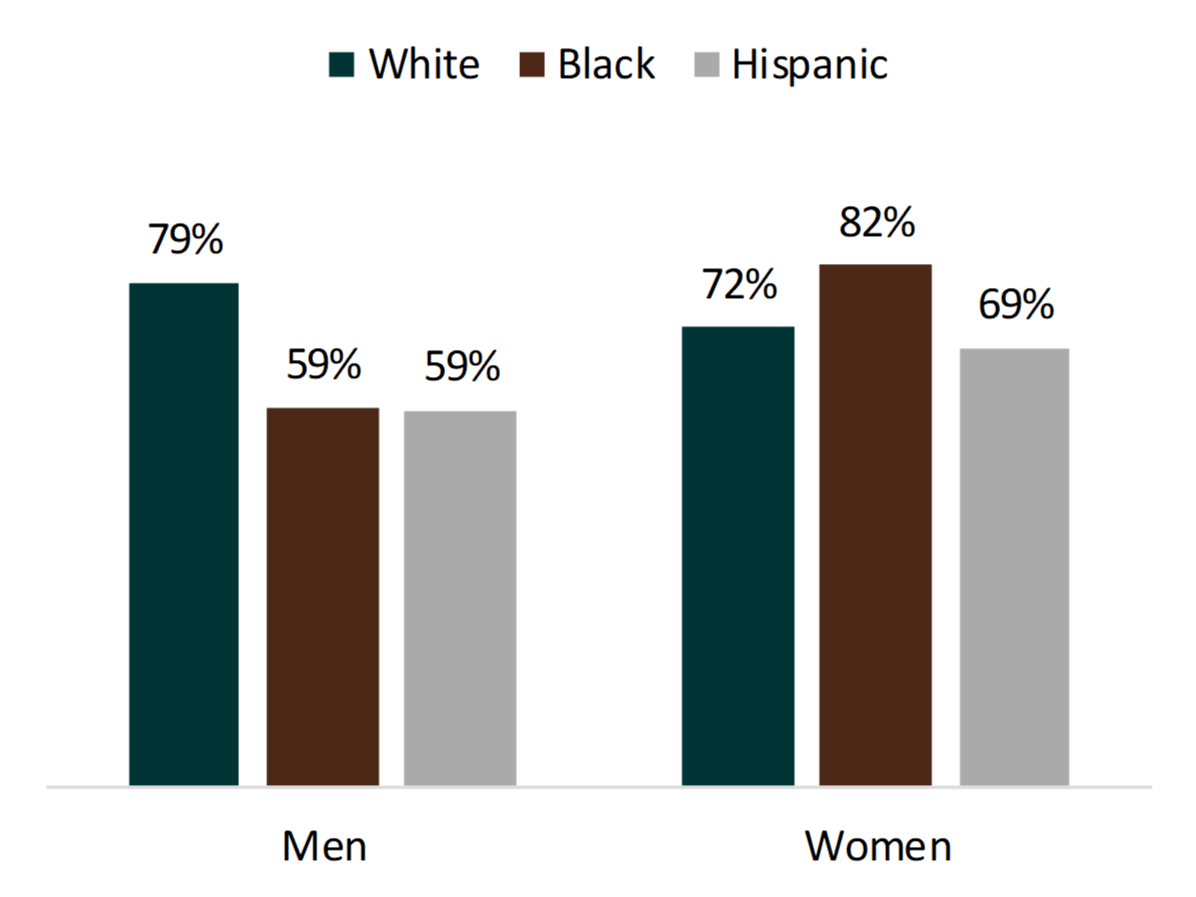
- In 2017, 8 in 10 young White men expected to marry, while only 6 in 10 young Black and Hispanic men did so.
- A higher share of young Black women reported they expect to marry than did White or Hispanic women, even though lower shares of Black women were married (FP 18-17).
- A higher share of White male than female high school seniors reported expecting to marry. Among Black and Hispanic high school seniors, higher shares of women reported they expect to marry than their male counterparts of the same racial/ethnic category.
Figure 4. High School Seniors Who Expected to Marry by Race/Ethnicity and Gender, 2017

Source: NCFMR analyses of Monitoring the Future, 1976-2017
References
- Allred, C. A. (2018). Marriage: More than a century of change, 1900-2016. Family Profiles, FP-18-17. Bowling Green, OH: National Center for Family & Marriage Research. https://doi.org/10.25035/ncfmr/fp-18-17
- Payne, K. K. (2019). Median age at first marriage, 2017. Family Profiles, FP-19-06. Bowling Green, OH: National Center for Family & Marriage Research. https://doi.org/10.25035/ncfmr/fp-19-06
- Schweizer, V. (2018). Marriage rate in the U.S.: Geographic variation, 2017. Family Profiles, FP-18-20. Bowling Green, OH: National Center for Family & Marriage Research. https://doi.org/10.25035/ncfmr/fp-18-20
- U.S. Census Bureau (1950-2018). Historical marital status tables. Figure MS-1a. Men’s marital status.
- U.S. Census Bureau (1950-2018). Historical marital status tables. Figure MS-1a. Women’s marital status.
Suggested Citation
- Allred, C. (2019). High school seniors’ expectations to marry, 2017. Family Profiles, FP-19-11. Bowling Green, OH: National Center for Family & Marriage Research. https://doi.org/10.25035/ncfmr/fp-19-11.
Updated: 11/07/2025 02:37PM


