Men's Birth Expectations
Family Profile No. 12, 2018
Authors: Colette A. Allred & Karen B. Guzzo
Having children remains a central part of American men and women's lives, yet most research on childbearing behaviors and expectations focuses on women. In this profile, we use data from the 2011-2015 cycles of the National Survey of Family Growth to examine birth expectations among men aged 15-44. We examine the proportion who report expecting any births in the future, the total number of expected births (combining current number of children with number of expected births), and the expected timing of the next (or first) birth by key demographic factors. In this sample of men, 62% had no children, 15% one child, 13% two children, and 10%had three or more children.
Birth Expectations by Number of Current Children
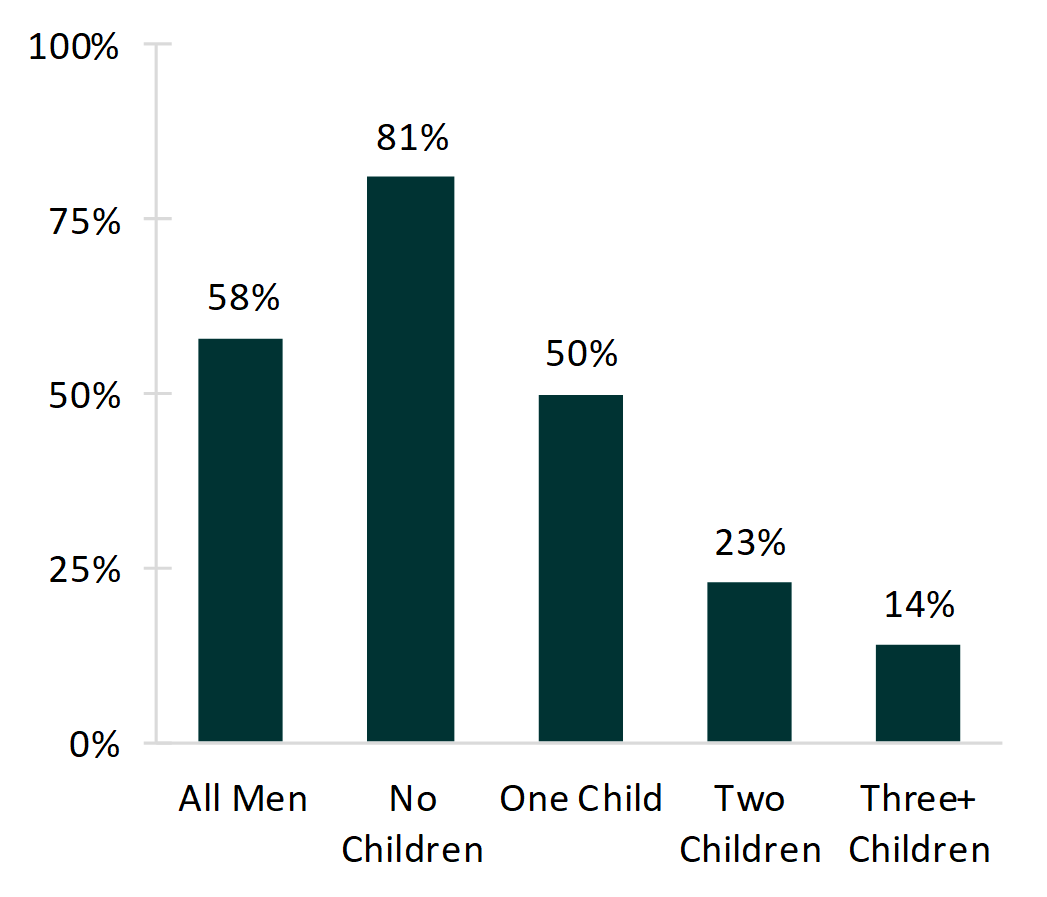
- Overall, almost 60% of men aged 15-44 expected to have a child in the future, but this varied widely by the number of children they had.
- Four out of five childless men expected to have a child in the future–only one in five men who did not have biological children did not intend to have any children.\
- Half of men with one child wished to have another child in the future.
- Only 23% of men with two children and 14% of men with three or more children expected to have more children.
Figure 1. Percentage of Men Aged 15-44 Who Expected to Have a Child in the Future by Current Number of Biological Children, 2013

Total Number of Expected Children
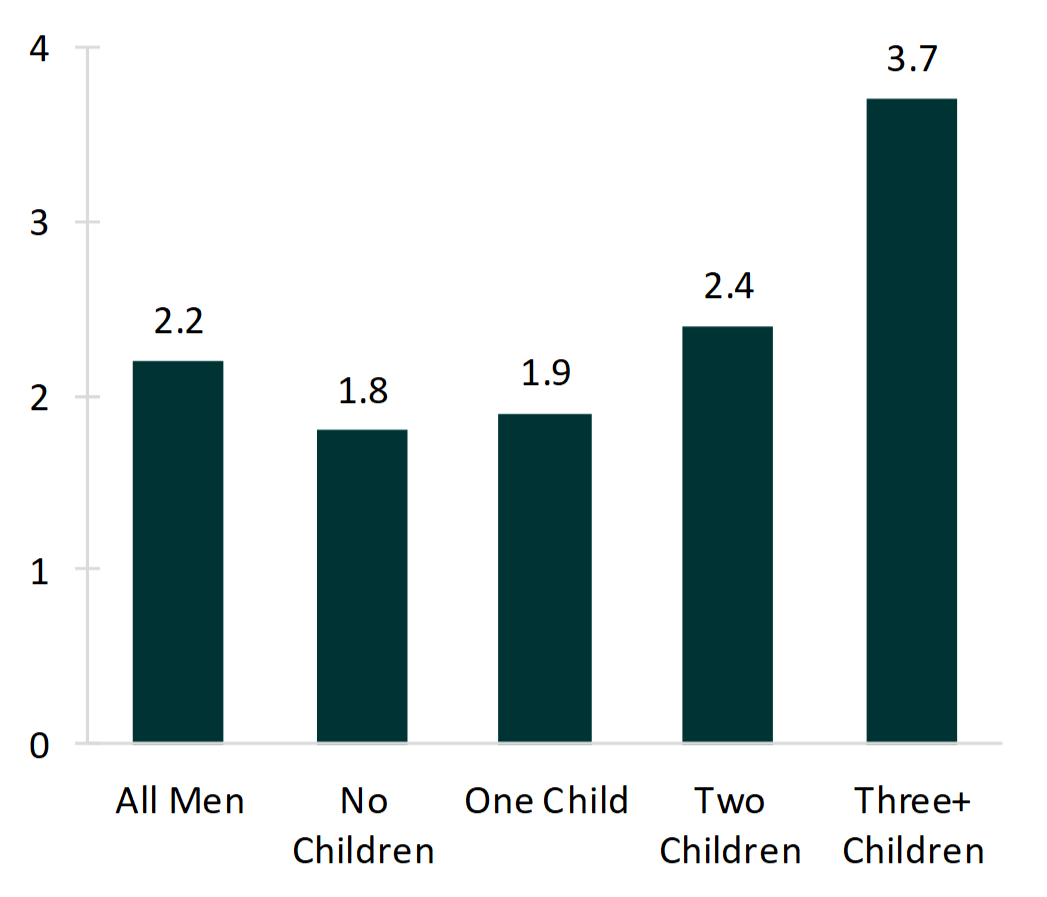
- Overall, men expected to have an average of 2.2 total children (combining current number of children and the number of expected children).
- The average number of expected children in total increased as the number of current children increased.
- Men with no children and men with one child expected to have a total of just under two children on average, at 1.8 and 1.9, respectively.
- The average number of total expected children for men with three or more children was 3.7, which differs from the overall average (2.2) by 1.5 children, and was the largest variation observed.
Figure 2. Total Number of Expected Children Among Men Aged 15-44 by Current Number of Biological Children, 2013

Variation in Total Number of Expected Children, by Demographic Characteristics
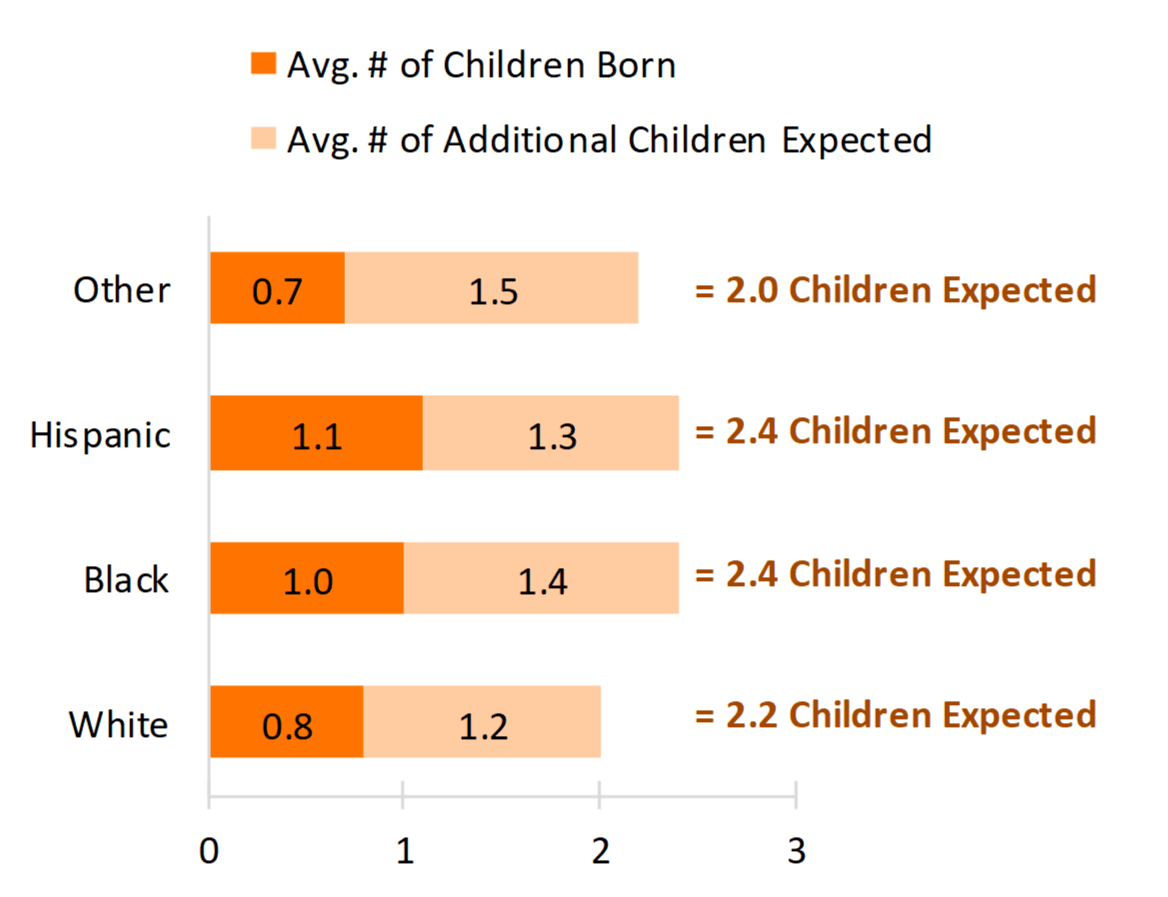
There was little variation in the total number of expected children by age or education (not shown). However, there was some variation by race and ethnicity.
- At 2.0 total expected births, White men had the lowest expected children of any race or ethnic group.
- Both Black and Hispanic men expected to have an average of 2.4 children, with similar numbers of children already born and additional children expected.
- Men in the “Other” category had the fewest current number of biological children and the highest number of additional children expected, with a total expected of 2.2 children.
Figure 3. Average Number of Children Already Born, Additional Children Expected, and Total Births Expected Among Men by Race, 2013

Timing of Expected Childbearing
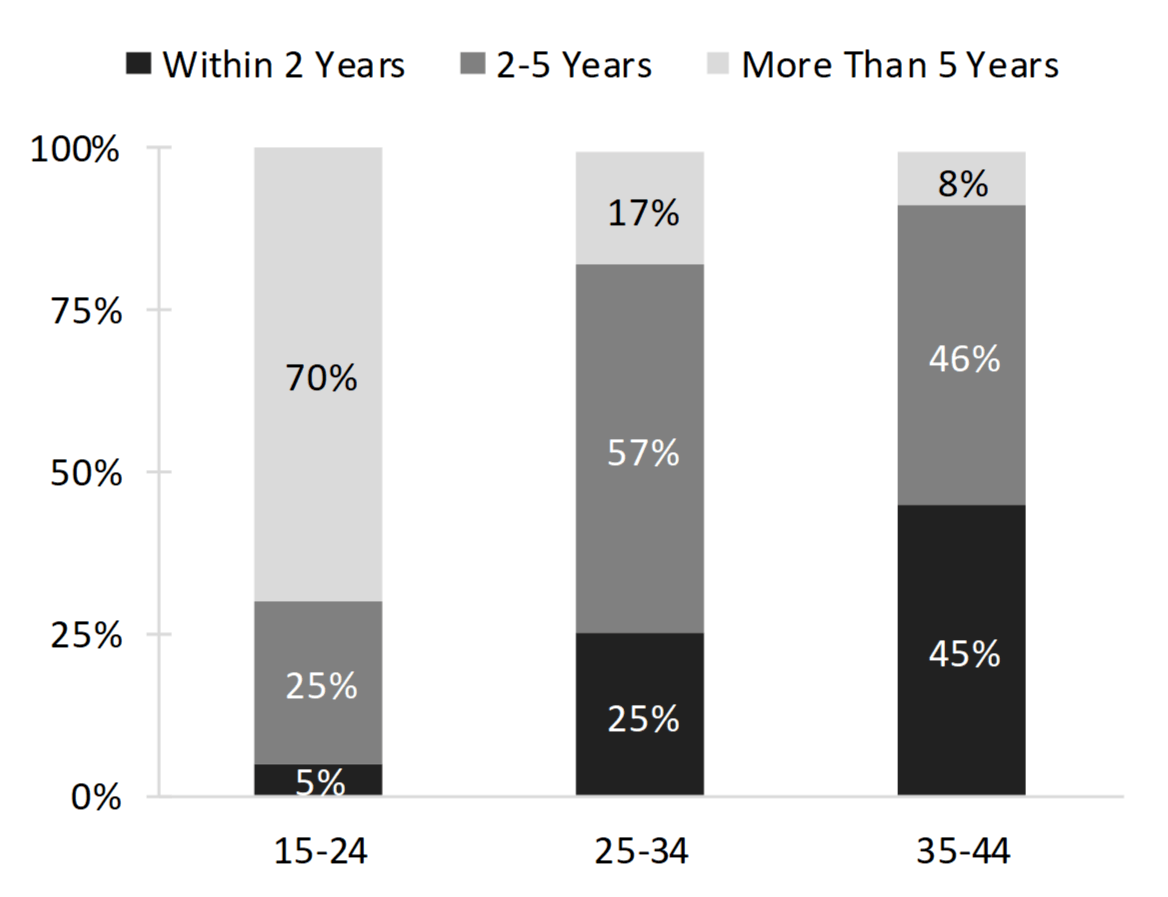
As men grow older, those who have not yet reached their desired number of children shortened their childbearing timeline.
- Among men in the youngest age group who expected to have a child in the future, only 5%intended to have a child in the next two years and 25% within a two to five-year timeframe.
- Among men aged 25-34 who expected a child in the future, nearly 60% intended to have a child within the next two to five years.
- Nearly half (45%) of older men (35-44) who expected to have a child in the future intended to do so within two years, and a nearly equal percentage (46%) expected to do so in two to five years.
Figure 4. Expected Timing of First or Next Child Among Men Who Do Expect to Have a Child in the Future by Age, 2013

Data Source
- National Center for Health Statistics (NCHS). (2016). 2011-2013, 2013-2015 National Survey of Family Growth Public Use Data and Documentation. Hyattsville, MD: CDC National Center for Health Statistics. Retrieved from https://www.cdc.gov/nchs/nsfg/index.htm
Suggested Citation
- Allred, C. A. & Guzzo, K. B. (2018). Men's birth expectations. Family Profiles, FP-18-12. Bowling Green, OH: National Center for Family & Marriage Research. https://doi.org/10.25035/ncfmr/fp-18-12.
Updated: 11/07/2025 02:34PM

