Cohabitation in Middle and Later Life, 2022
Family Profile No. 14, 2024
Author: Jaden Loo
This Family Profile is
an update to FP-16-20.
The popularity of cohabitation for US adults of all ages has continued to grow in recent years. For older men and women (aged 50+) in 2000, the number of cohabitors was about 1.2 million, or 1.6% of adults in that group (Brown, Bulanda, & Lee 2005). As of 2022, this number has almost quadrupled to 4,205,505. We find that among older adults more men (2,216,977) are cohabiting than women (1,988,528). This sex difference is especially pronounced when comparing cohabitation rates (number of cohabitors per 1,000 unmarried and separated). The cohabitation rate is higher among older men at 118.2 than women at 67.17. This rapid growth is evidence cohabitation has become a more common experience for today’s older adults. A majority of older cohabitors are Non-Hispanic White (69%) with the next closest racial/ethnic group being 14% of older adult cohabitors being Hispanic. 10% were non-Hispanic Black, 4% were non-Hispanic Other race, and 3% were non-Hispanic Asian. Drawing on 2022 American Community Survey (ACS) data, we examine variation in cohabitation trends for older US adults by geographic, demographic, and socioeconomic characteristics. First, we present state variation in cohabitation rates which represent the number of older adult cohabitors per 1,000 unmarried and separated older adults. Second, we examine how poverty rates and marital histories of cohabitors compare to those who are single and married.[1]
[1] Following Stepler (2017), those who are separated are included in the denominator for these estimates of cohabitation rates. This approach differs from that used in FP-16-20 and thus those estimates are not directly comparable to the ones presented here.
Older Cohabitation Rates by State
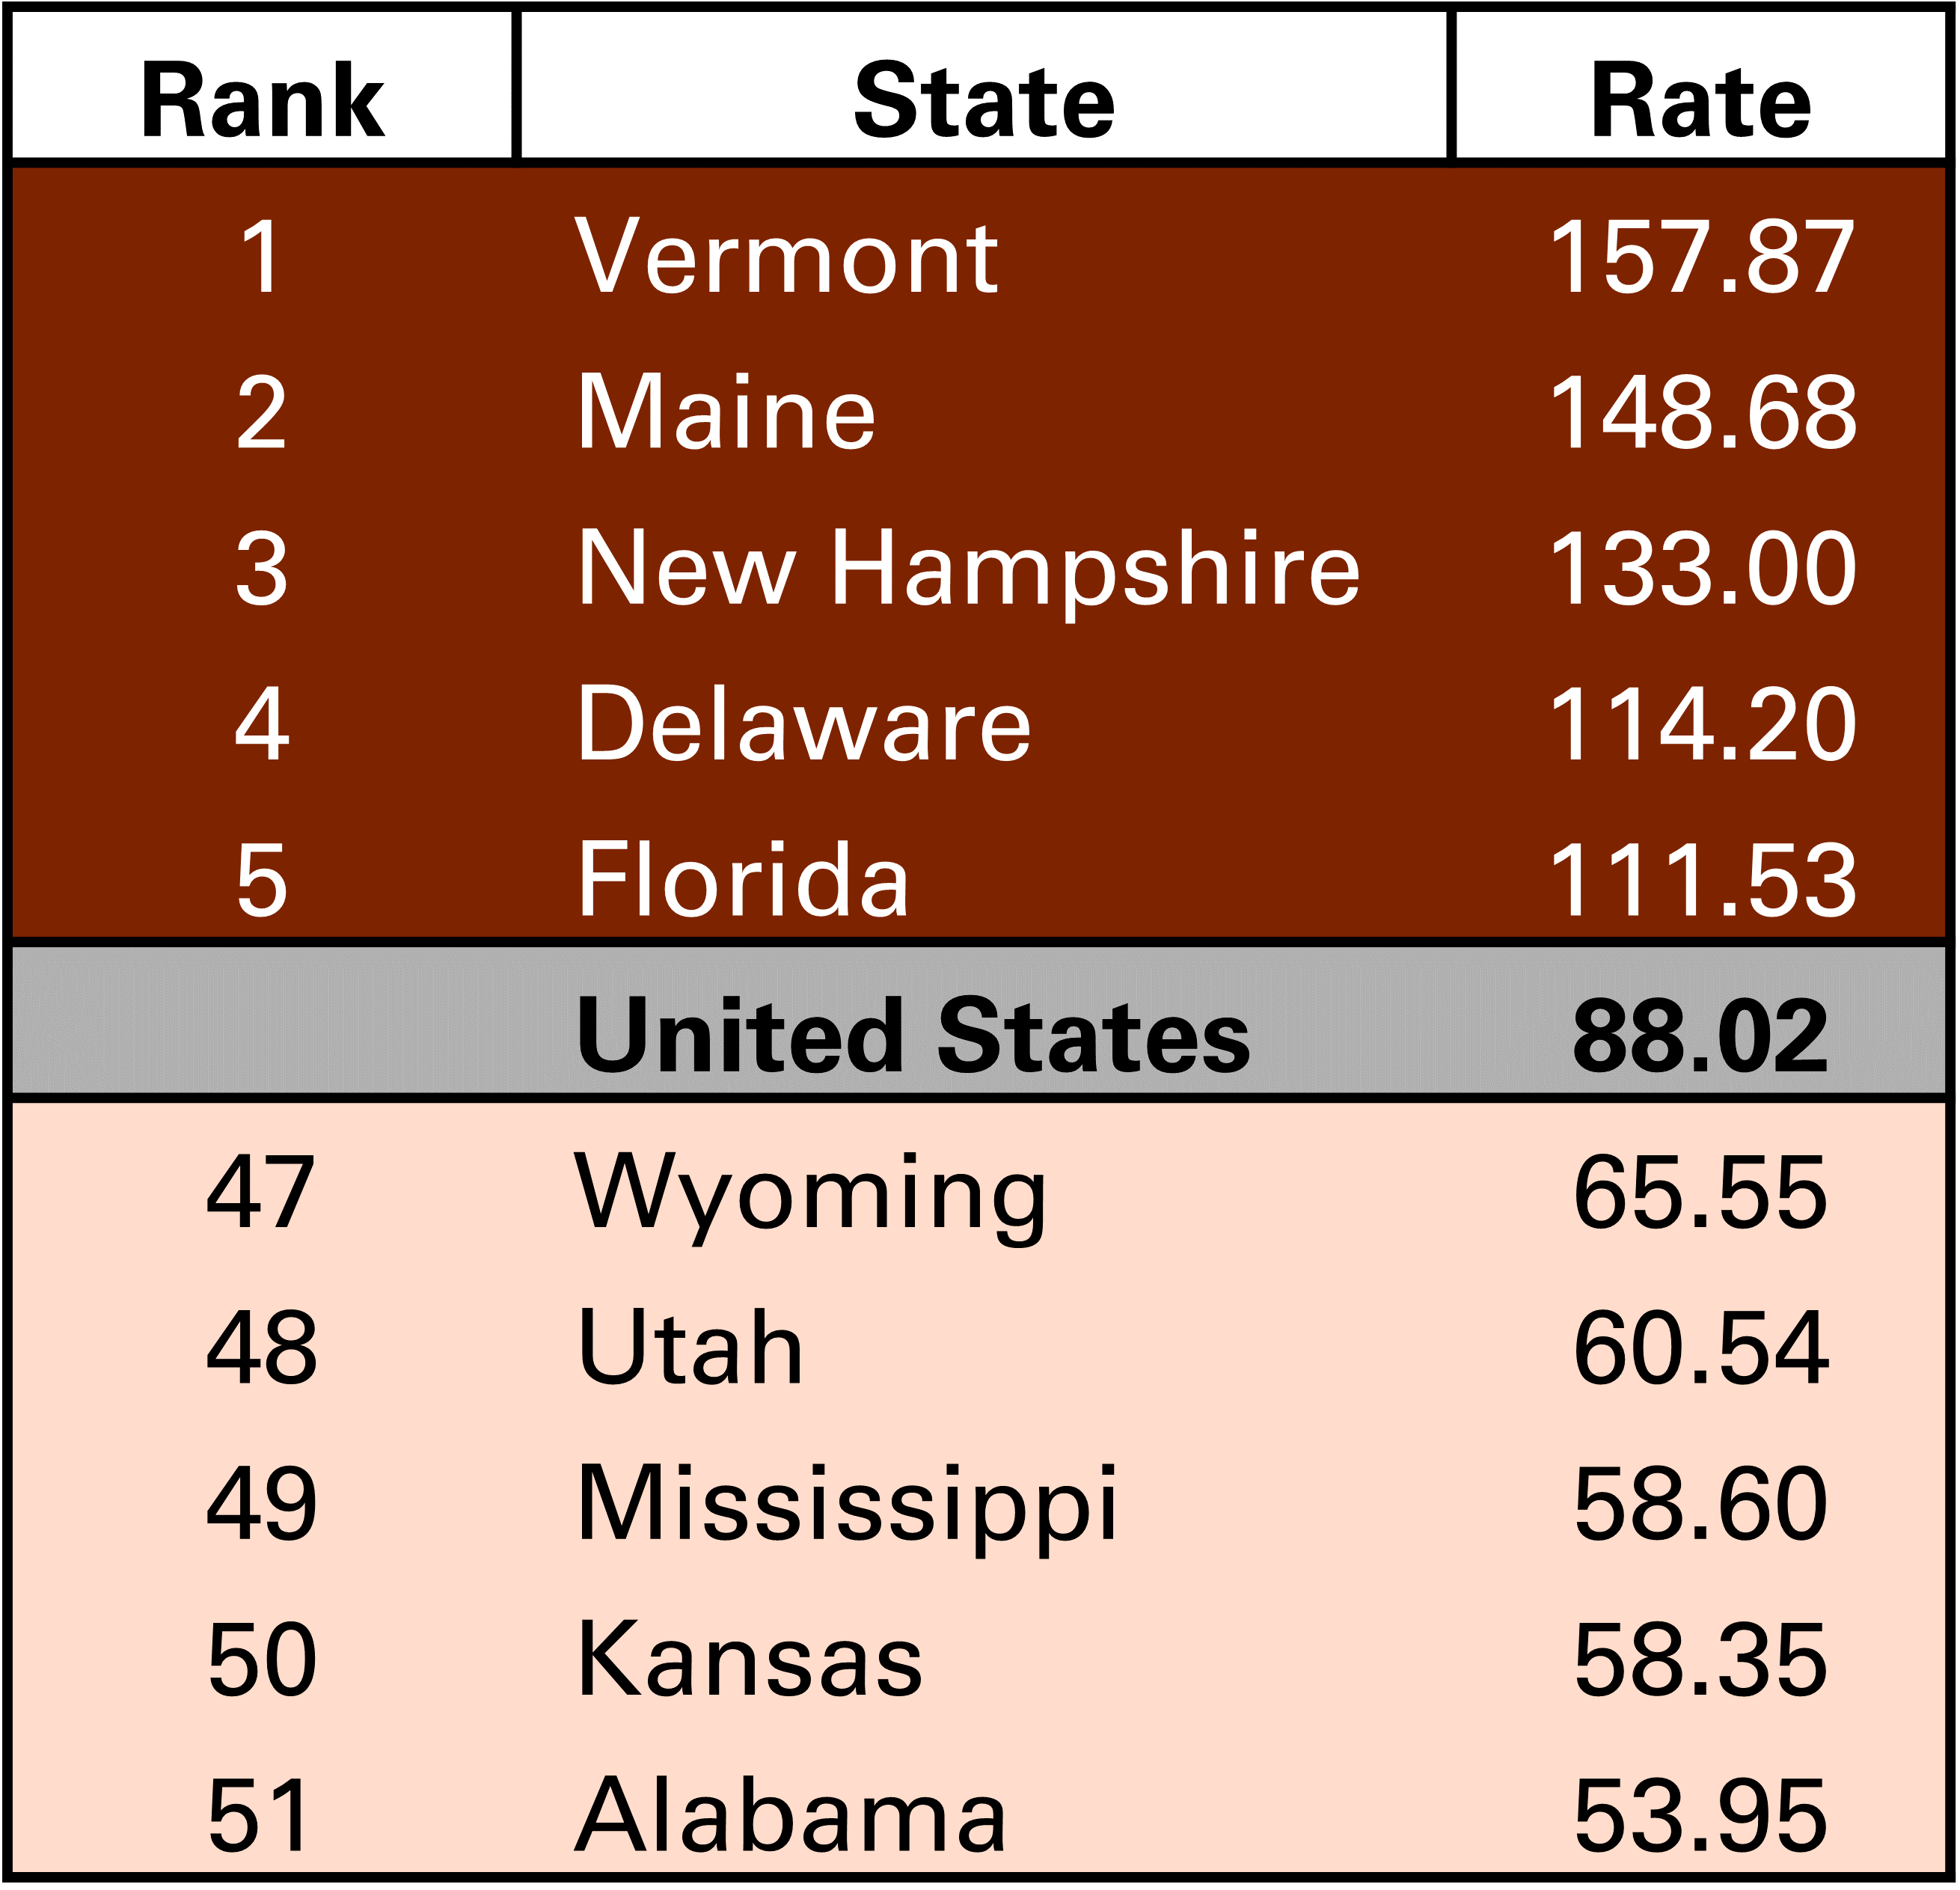
- In 2022, the cohabitation rate for older US adults was approximately 87 cohabitors per 1,000 unmarried and separated individuals, but there was substantial variation by state.
- The highest older adult cohabitation rate for 2022 was seen in Vermont, where there were about 159 older adult cohabitors per 1,000 unmarried and separated older adults.
- Alabama reported the lowest older adult cohabitation rate in 2022 with approximately 52 older adult cohabitors per 1,000 unmarried and separated older adults.
Table 1. Highest and Lowest Cohabitation Rates, 2022

Figure 1. Cohabitation Rates of Individuals Aged 50 or Older, by State, 2022


Poverty Status of Persons Aged 50 and Older
- More single older adults reported being at or below the poverty line[1] in comparison to those who were cohabiting or married.
- Almost 1 in 5 single older adults (18.2%) reported being at or below the poverty line in 2022.
- In 2022, the share of cohabiting older adults at or below the poverty line (6.3%) was slightly greater than the share of married older adults at or below the poverty line (5.4%).
Marital Status of Persons Aged 50 and Older
- Almost 3 in 4 older adults who were single or cohabiting in 2022 reported being married at least once in the past.
- The share of single older adults who have been previously married (74.46%) was slightly greater than the share of previously married cohabiting older adults (72.23%) in 2022.
- Approximately 30% of married older adults have been married at least twice.
Figure 2. Percentage of Older Americans Living in a Household at or below the Poverty Line, by Union Status, 2022

Figure 3. Percentage of Older Adults Previously Married, by Union Status, 2022

[1] The IPUMS variable “POVERTY” assigns all members of each family the same code, rather than each household, meaning that a cohabiting partner’s income is not included in the computation
Data Source:
Flood, S., King, M., Rodgers, R., Ruggles, S., Warren, J. R., Warren, D., Chen, A., Cooper, G., Richards, S., Schouweiler, M., & Westberry, M. (2024). IPUMS USA: Version 15.0 American Community Survey. Minneapolis, MN: IPUMS. https://doi.org/10.18128/D010.V15.0
References:
Brown, S. L., Bulanda, J. R., & Lee, G. R. (2005). The significance of nonmarital cohabitation: Marital status and mental health benefits among middle-aged and older adults. The Journals of Gerontology Series B: Psychological Sciences and Social Sciences, 60(1), S21–S29. https://doi.org/10.1093/geronb/60.1.S21
Hemez, P. & Brown, S. L. (2016). Cohabitation in middle and later life. Family Profiles, FP-16-20. Bowling Green, OH: National Center for Family & Marriage Research. https://www.bgsu.edu/ncfmr/resources/data/family-profiles/hemez-brown-cohabitation-middle-later-life-2014-fp-16-20.html
Stepler, R. (2017, April 6). Number of U.S. adults cohabiting with a partner continues to rise, especially among those 50 and older. Pew Research Center. https://www.pewresearch.org/short-reads/2017/04/06/number-of-u-s-adults-cohabiting-with-a-partner-continues-to-rise-especially-among-those-50-and-older/
Suggested Citation:
Loo, J. (2024). Cohabitation in Middle and Later Life, 2022. Family Profiles, FP-24-14. Bowling Green, OH: National Center for Family & Marriage Research. https://doi.org/10.25035/ncfmr/fp-24-14
This project is supported with assistance from Bowling Green State University. From 2007 to 2013, support was also provided by the U.S. Department of Health and Human Services, Office of the Assistant Secretary for Planning and Evaluation. The opinions and conclusions expressed herein are solely those of the author(s) and should not be construed as representing the opinions or policy of any agency of the state or federal government.
Updated: 09/04/2024 11:36AM

