Twenty-Five-year Trends in Living Alone in the U.S., 1990 & 2015
Family Profile No. 18, 2017
Author: Huijing Wu
The share of adults who live alone is on the rise (Vespa, Lewis & Kreider, 2013). In 2011, 13.4% of all adults in the U.S. were living alone, and the majority of those were single women aged 55 and older (FP-13-18). This Family Profile updates an earlier profile (FP-13-18) on living alone in 2011 to examine trends in living alone between 1990 and 2015. We focus on gender differences and marital status by age groups, using data from the 1990 census and the 2015 American Community Survey.
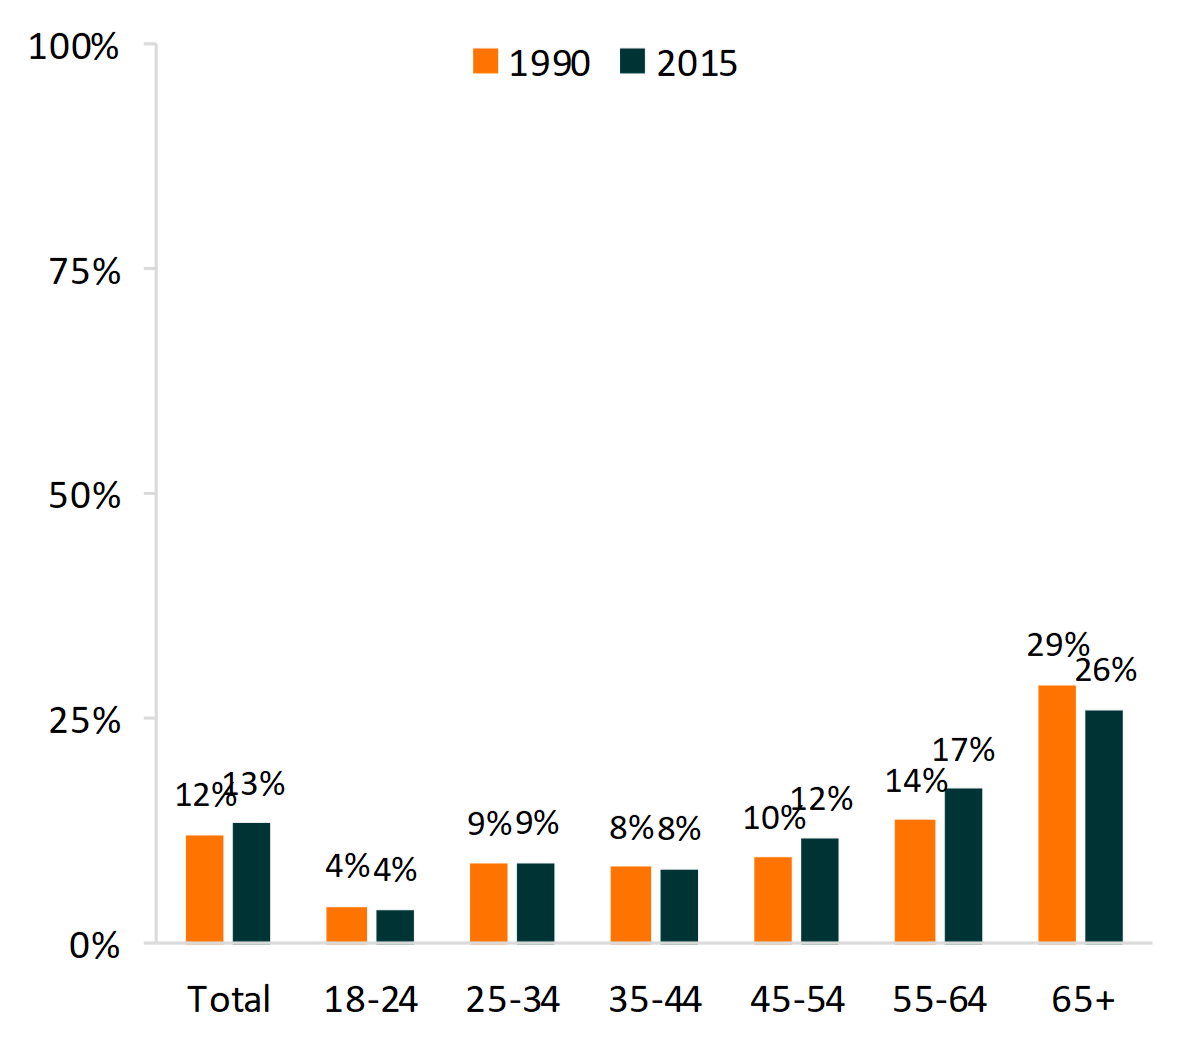
- The overall percentage of adults living alone remained relatively unchanged between 1990 and 2015 at 12% and 13%, respectively.
- The share of adults who were living alone tended to increase with age. Less than 10% of those aged 25-44 lived alone compared with about one-quarter of adults aged 65 and older.
- The trends in living alone between 1990 and 2015 differed by age group.
- Since 1990, the share of adults aged 44 and younger who lived alone remained stable.
- Between 1990 and 2015, there was a modest increase in the proportion of middle-aged adults (ages 45-64) living alone.
- Among adults aged 65 and older, the percentage living alone dropped from 29% in 1990 to 26% in 2015.
Figure 1. Adults Living Alone by Age Group, 1990 & 2015

Living Alone by Gender and Age Group
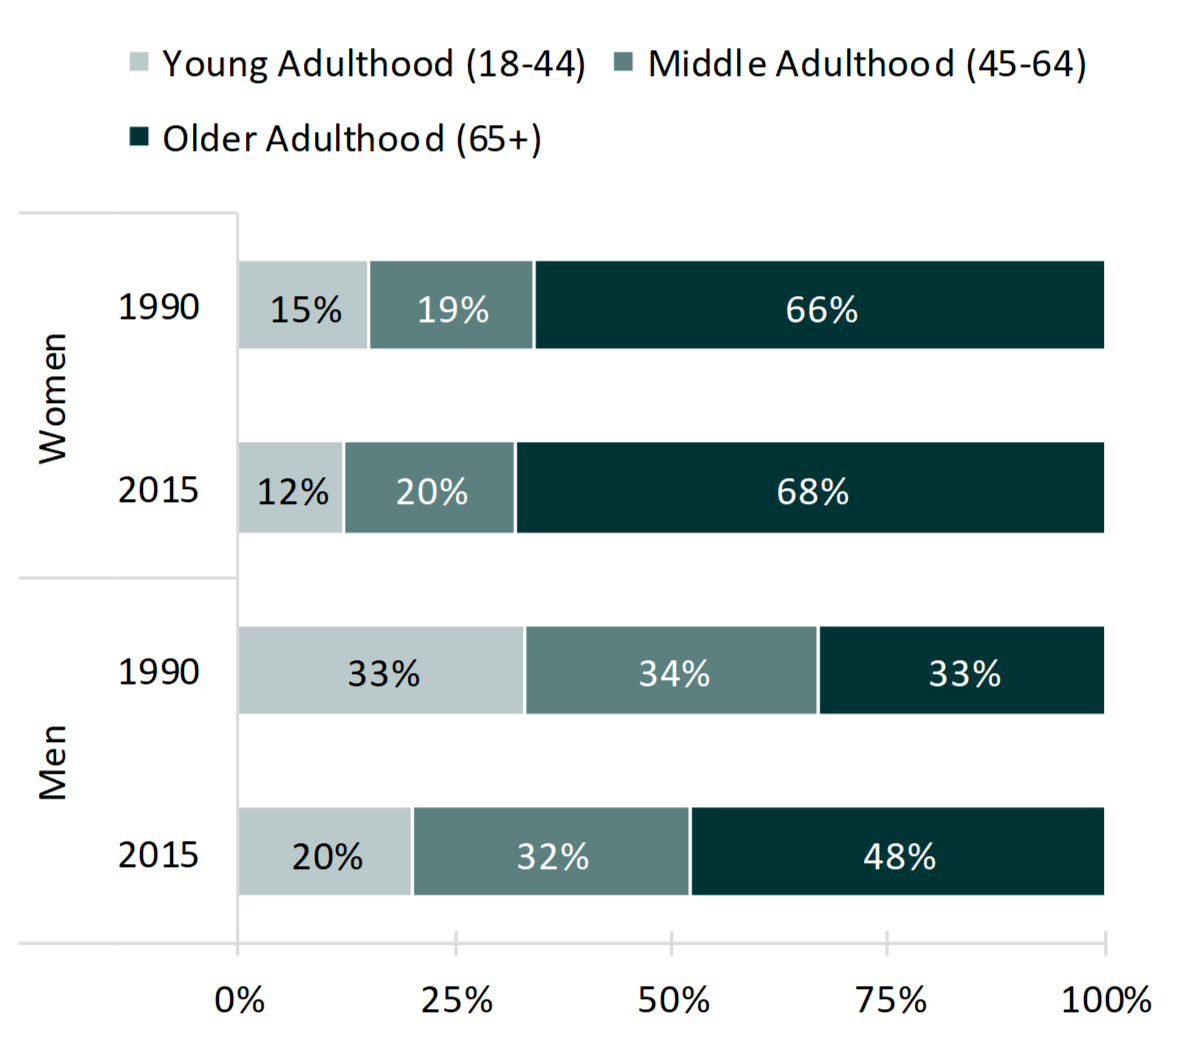
- The age composition of women living alone has remained relatively stable over the past 25 years.
- Among women living alone, older women made up the largest share at about two-thirds.
- The smallest share was found among young women.
- Among men living alone, the age composition changed from 1990 to 2015.
- In 1990, one-third of solo men were in young adulthood, one-third were in middle adulthood, and one-third were in older adulthood.
- By 2015, the percentage of solo men who were in young adulthood decreased from 33% to 20%, while the percentage in older adulthood increased from 33% to 48%.
Figure 2. Adults Living Alone by Gender and Age Group, 1990 & 2015

Living Alone by Marital Status and Age Group
Women
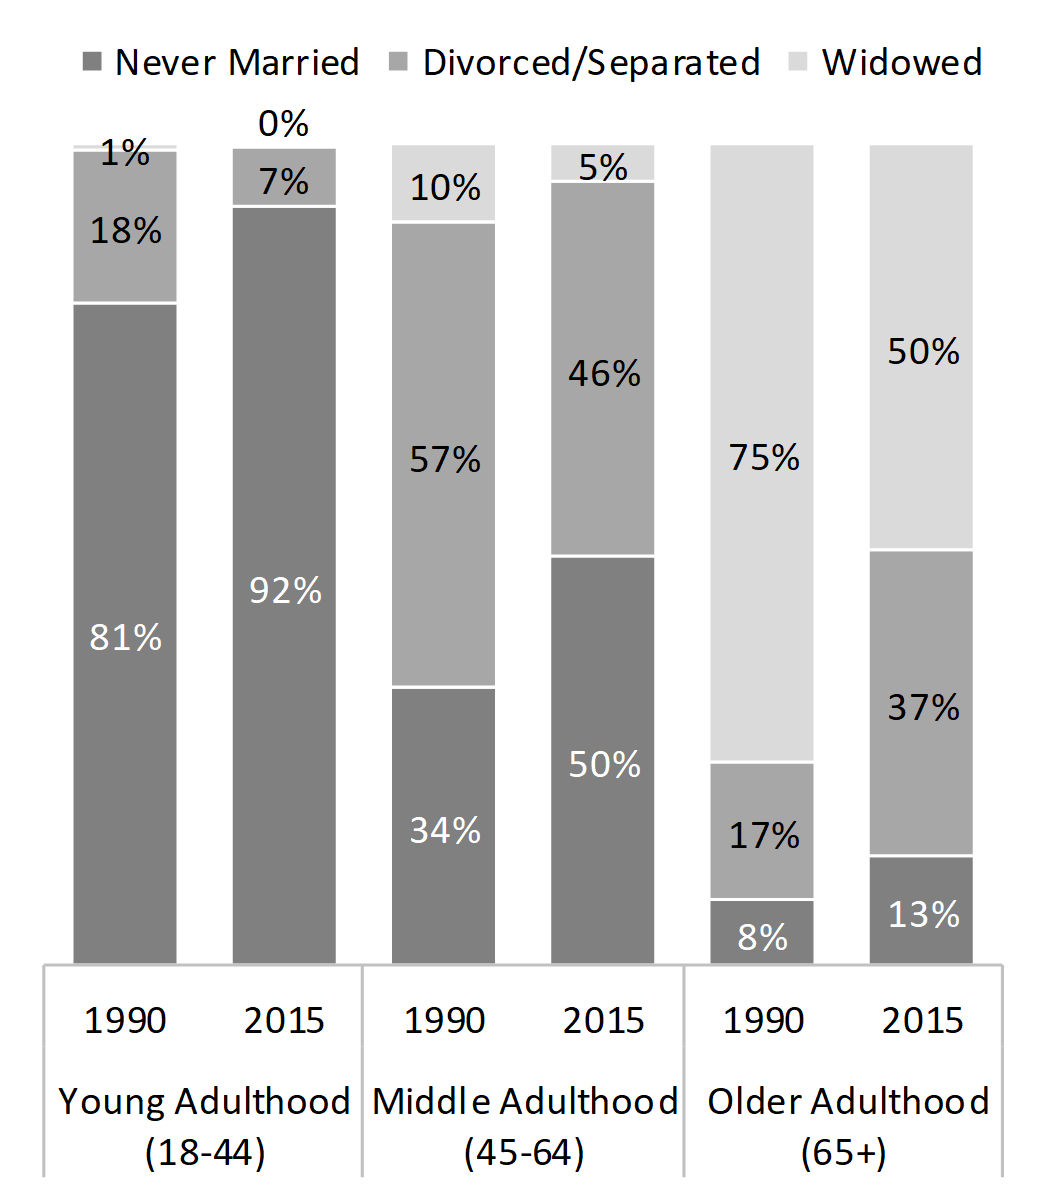
- Among women living alone, the share who were never married increased for all age groups, especially among older women. In 2015, about one in eight older single women had never married.
- The share who were widowed decreased for all age groups. By 2015, only half of older women living alone were widowed.
- The share of women living alone who were divorced decreased over time among women under 65 but increased among women 65 and older. Nearly four in ten (37%) of older single women were divorced, up from only 17% in 1990.
Figure 3. Marital Status of Women Living Alone by Age Group, 1990 & 2015

Men
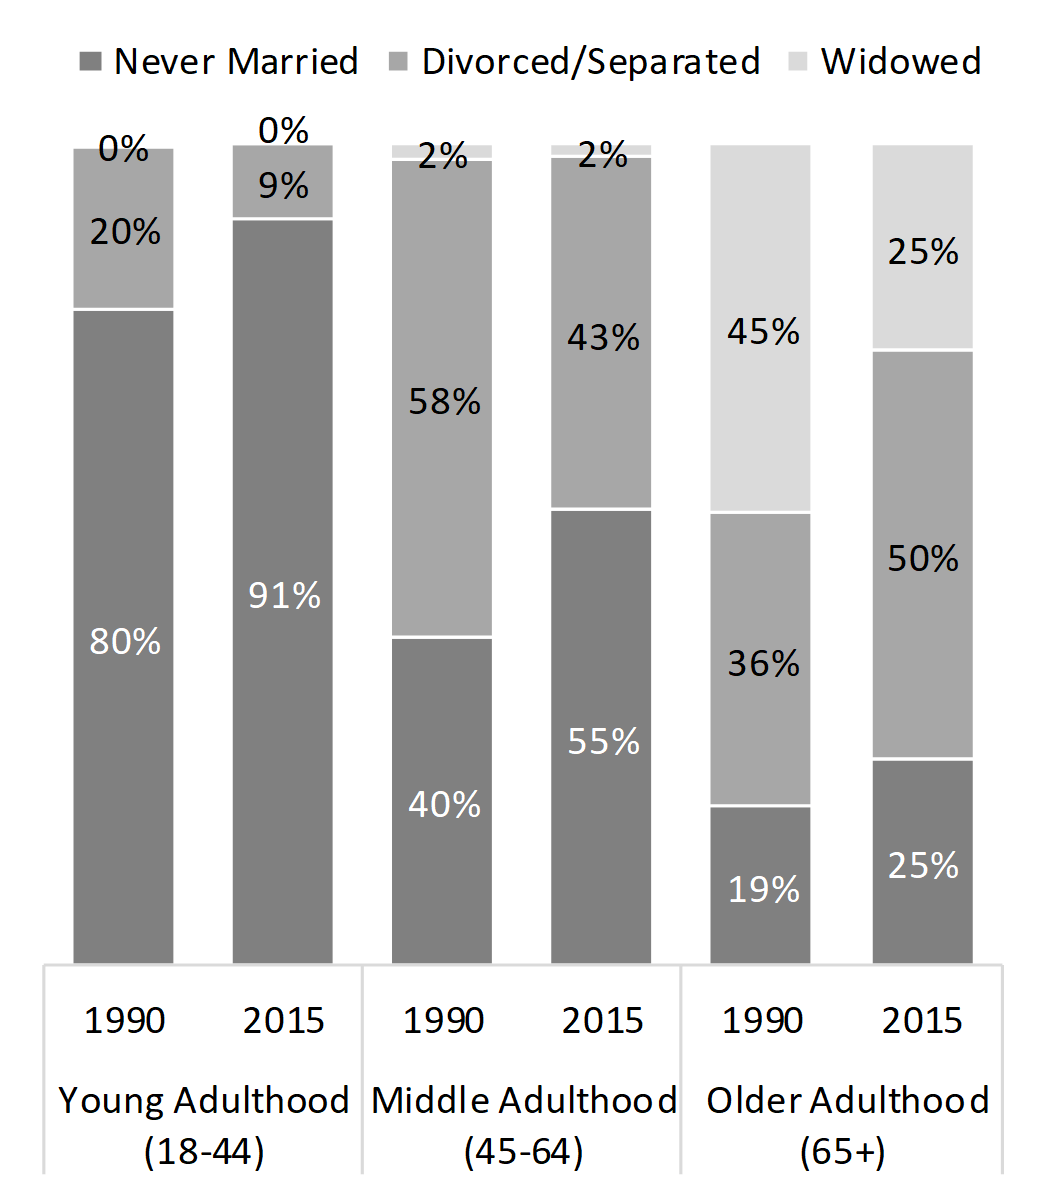
- As with women, the share who were never married increased among men living alone for all age groups. The largest increase was among men in middle adulthood, of whom over half (55%) had never married.
- The share of men living alone who were widowed declined only among older men, with nearly half as many widowed in 2015 (25%) than in 1990 (45%).
- Among older adults living alone, widowhood was twice as common among women as men.
- Similar to women living alone, the share of men who were divorced decreased over time among those under 65 but increased for those 65 and older. In 2015, half of older men living alone were divorced.
Figure 4. Marital Status of Men Living Alone by Age Group, 1990 & 2015

Source: IPUMS-USA; 1990 Decennial Census and American Community Survey, 2015 1-year estimates
Data Sources
- Ruggles, S., Genadek, K., Goeken, R., Grover, J., & Sobek, M. Integrated Public Use Microdata Series: Version 6.0 [dataset]. Minneapolis: University of Minnesota, 2015. http://doi.org/10.l8128/D010.V6.0
References
- Vespa, J., Lewis, J. M., & Kreider, R. M. (2013). America's families and living arrangements: 2012. Current Population Reports, 20-570, U.S. Census Bureau, Washington, D.C . Retrieved from https://www.census.gov/content/dam/Census/library/pub1ications/2013/demo/p20-570.pdf
- Wilson, B., & Lamidi, E. (2013). Living Alone in the U.S., 2011. Family Profiles, FP-13-18. Bowling Green, OH: National Center for Family & Marriage Research. http ://www. bgsu.edu/content/ da m/BGSU /college-of-arts-and-sciences/N CFM R/ documents/FP/FP-13-18.pdf
Suggested Citation
- Wu, H. (2017). Twenty-five-year trends in living alone in the U.S., 1990 and 2015. Family Profiles, FP-17-22. Bowling Green, OH: National Center for Family & Marriage Research. https://doi.org/10.25035/ncfmr/fp-17-18
This project is supported with assistance from Bowling Green State University. From 2007 to 2013, support was also provided by the U.S. Department of Health and Human Services, Office of the Assistant Secretary for Planning and Evaluation. The opinions and conclusions expressed herein are solely those of the author(s) and should not be construed as representing the opinions or policy of any agency of the state or federal government.
Updated: 04/06/2021 01:32PM


