Grandparenthood in the U.S.: Residence Status of Grandchildren
Family Profile No. 5, 2018
Author: Huijing Wu
In 2014, there were nearly 68 million grandparents aged 40 and over in the United States, according to the Survey of Income and Program Participation (SIPP). This figure represents 46% of adults aged 40 and older. The SIPP is a nationally representative household-based survey and is designed to provide comprehensive family and social information on individuals and families. Because the SIPP gathers information on all individuals who lived in a surveyed household, and directly asks respondents if they are a grandparent, it is one of the few surveys that identifies non-resident grandparents. Using data from the 2014 Survey of Income and Program Participation (SIPP), this profile updates FP-14-12 to examine grandparents’ age composition, race/ethnicity, and educational attainment by resident status of grandchildren. This is the final profile in our series on grandparents in the U.S.
Age Composition of Grandparents by Resident Status of Grandchildren
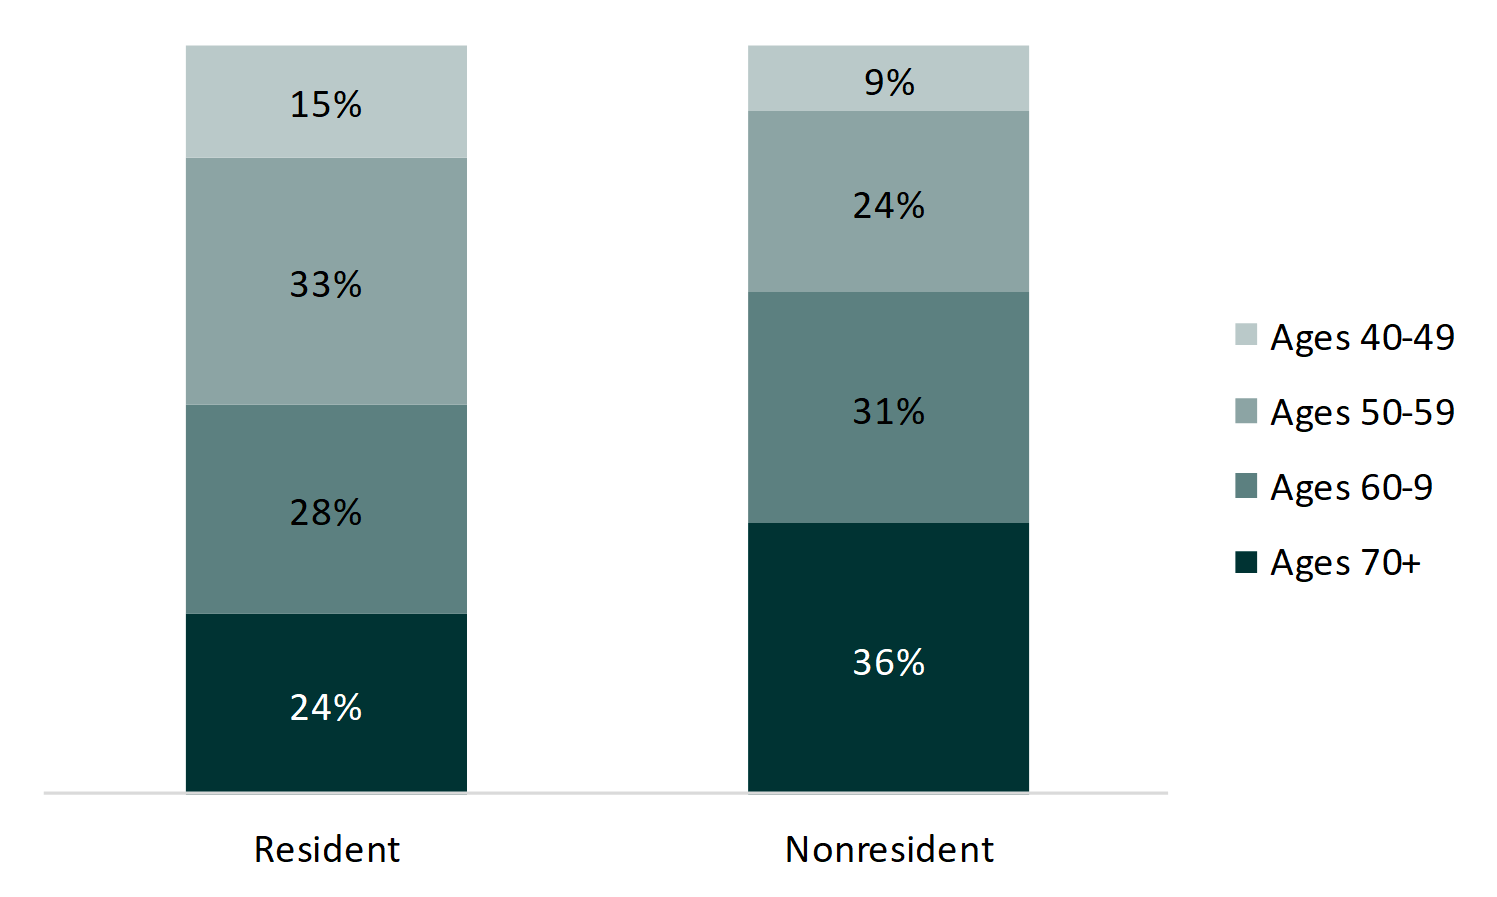
- On average, resident grandparents were five years younger than nonresident grandparents were (median age of 60 vs. 65). Almost half of resident grandparents (48%) were under age 60, whereas one-third of nonresident grandparents were under age 60.
- Non resident grandparents were more often in older age groups. The majority (67%) of nonresident grandparents were aged 60 and older.
Figure 1. Age Composition of Grandparents by Resident Status of Grandchildren

Race/Ethnicity of Grandparents by Resident Status of Grandchildren
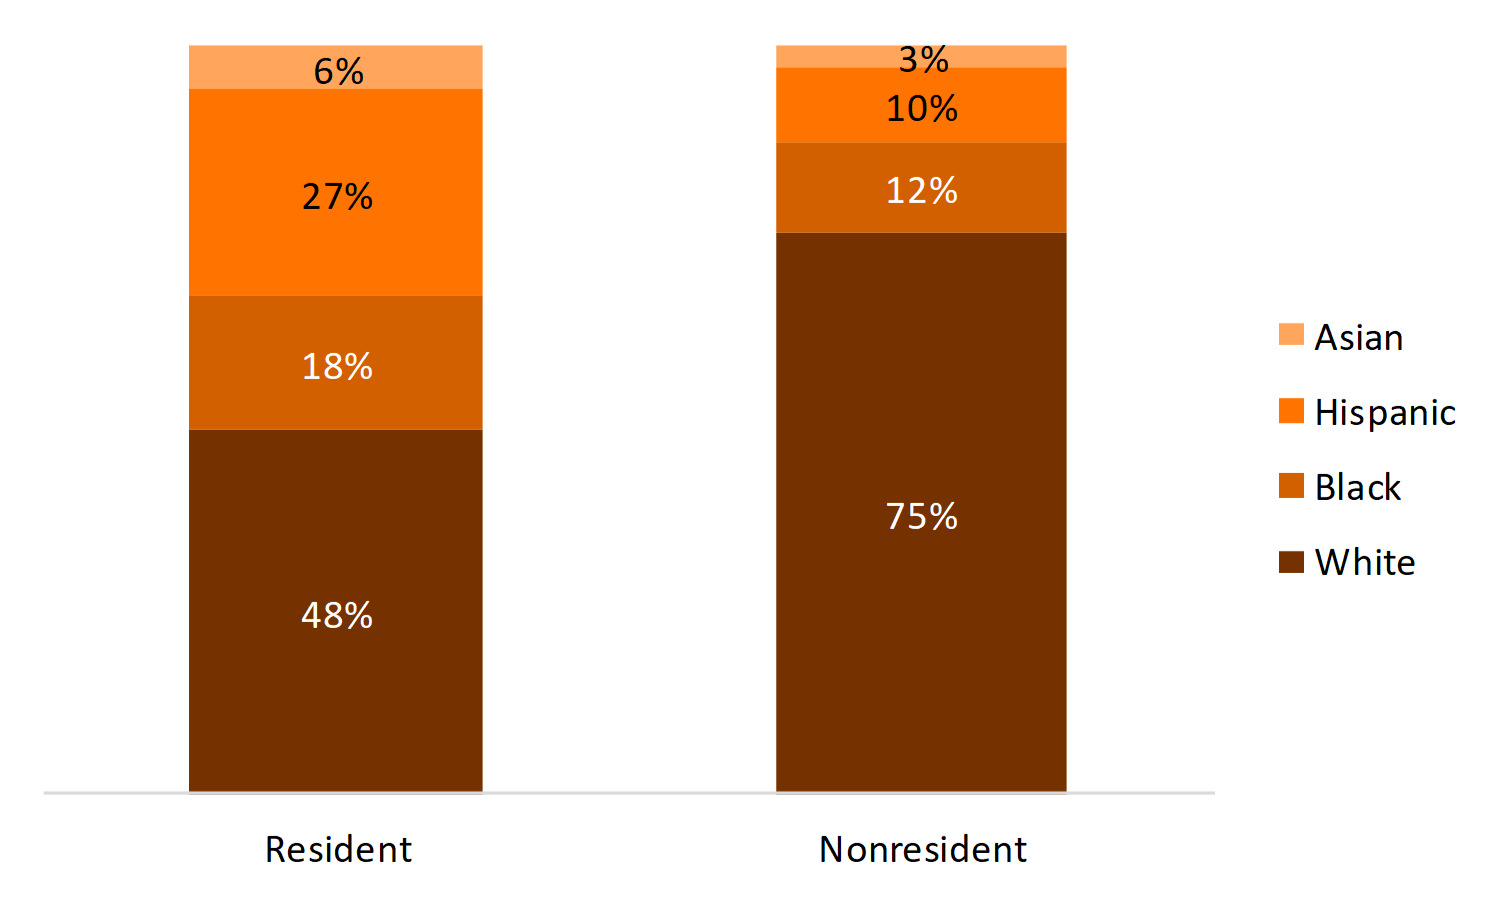
A larger share of grandparents with resident grandchildren belonged to a racial/ethnic minority group (52%) compared to nonresident grandparents (25%).
- Among non-Whites, Hispanics constituted the largest share of resident grandparents (27% of all resident grandparents). However, among nonresident grandparents, only one in ten were Hispanic.
- A higher percentage of resident grandparents were Black than nonresident grandparents (18% and 12%, respectively).
- Although few grandparents were Asian, twice as many resident grandparents than nonresident grandparents were Asian (6%versus 3%).
Figure 2. Race/Ethnicity of Grandparents by Resident Status of Grandchildren

Educational Attainment of Grandparents by Resident Status of Grandchildren
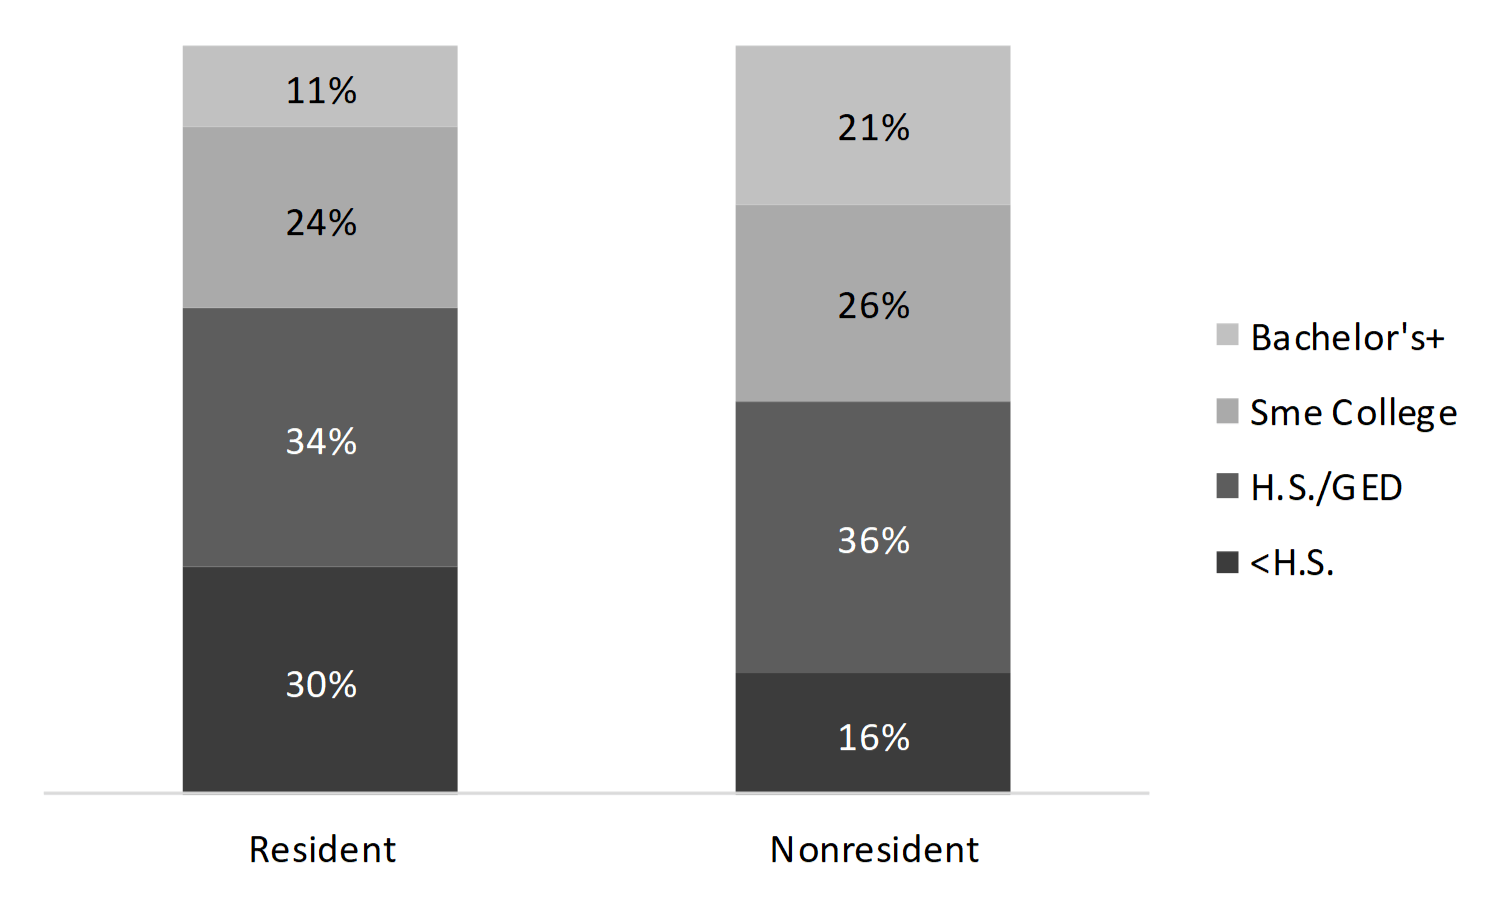
- Resident grandparents had lower levels of educational attainment than nonresident grandparents did.
- Thirty percent of resident grandparents had less than a high school education compared to 16% of nonresident grandparents.
- One in ten (11%) resident grandparents were college graduates, whereas two in ten (21%) nonresident grandparents were college graduates.
Figure 3. Educational Attainment of Grandparents by Resident Status of Grandchildren

Data Source
- U.S. Census Bureau, Survey of Income and Program Participation, 2014 Panel, Wave 1. https://www.census.gov/programs-surveys/sipp/data/2014- panel/wave-1.html
References
- Stykes, B., Manning, W. D., & Brown, S. L. (2014). Grandparenthood in the U.S.: Residency status of grandparents. Family Profiles, FP-14-12. Bowling Green, OH: National Center for Family & Marriage Research.https://www.bgsu.edu/content/dam/BGSU/college-of-arts-and-sciences/NCFMR/documents/FP/FP-14-12- grandparents-us.pdf
Suggested Citation
- Wu, H. (2018). Grandparenthood in the U.S.: Residence status of grandchildren. Family Profiles, FP-18-05. Bowling Green, OH: National Center for Family & Marriage Research. https://doi.org/10.25035/ncfmr/fp-18-05
Updated: 11/12/2025 10:21AM


