Characteristics of Foster Children in the U.S., 2016-2018
Family Profile No. 9, 2019
Author: Valerie Schweizer
Foster children come from many different backgrounds and experiences. Using pooled (2016-2018) Current Population Survey (CPS) data, this profile examines how foster children compare to biological, adopted, and stepchildren. Statistics reported here represent minor children identified as a foster child to the head of household. The CPS estimate is lower than that provided by the Adoption and Foster Care Analysis and Reporting System (AFCARS), which considers foster children through age 20. Further, AFCARS designates children placed in foster care with a relative who are likely identified as a relative to the household head in the CPS rather than a foster child. The CPS data allow for detailed poverty estimates that include foster children (e.g. supplemental poverty)—which is not available in any other dataset—providing unique insight into a vulnerable population in the U.S.
Trend of Foster Children in the U.S.
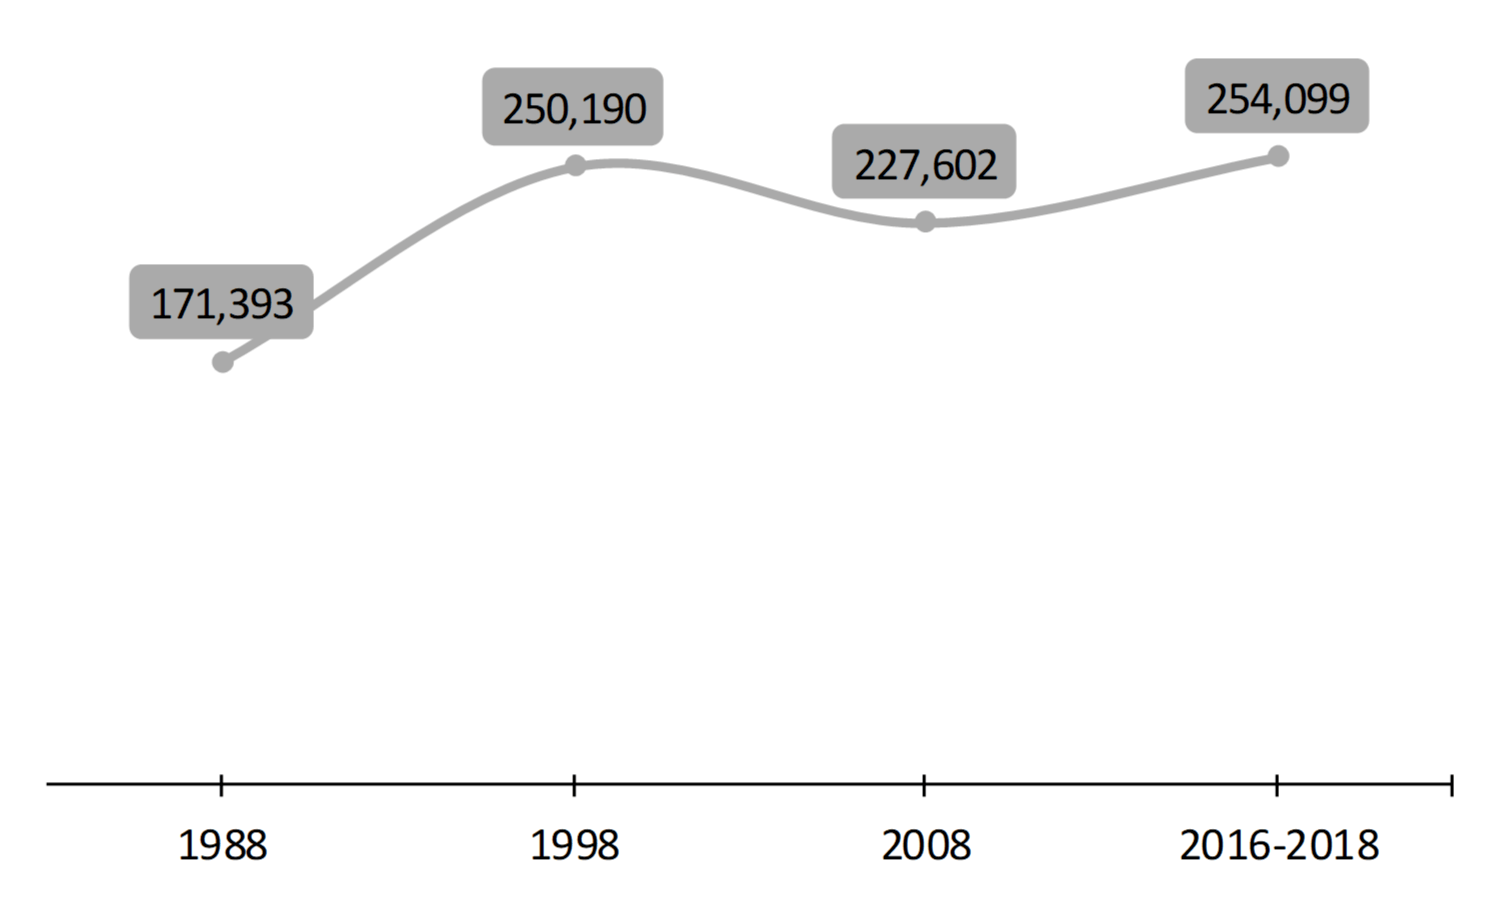
- The number of foster children has risen since 1988. From 1988 to 1998, there was a 46% increase in the number of foster children, representing the largest increase in the last three decades.
Figure 1. Number of Foster Children, 1988-2018

Age of Foster Children
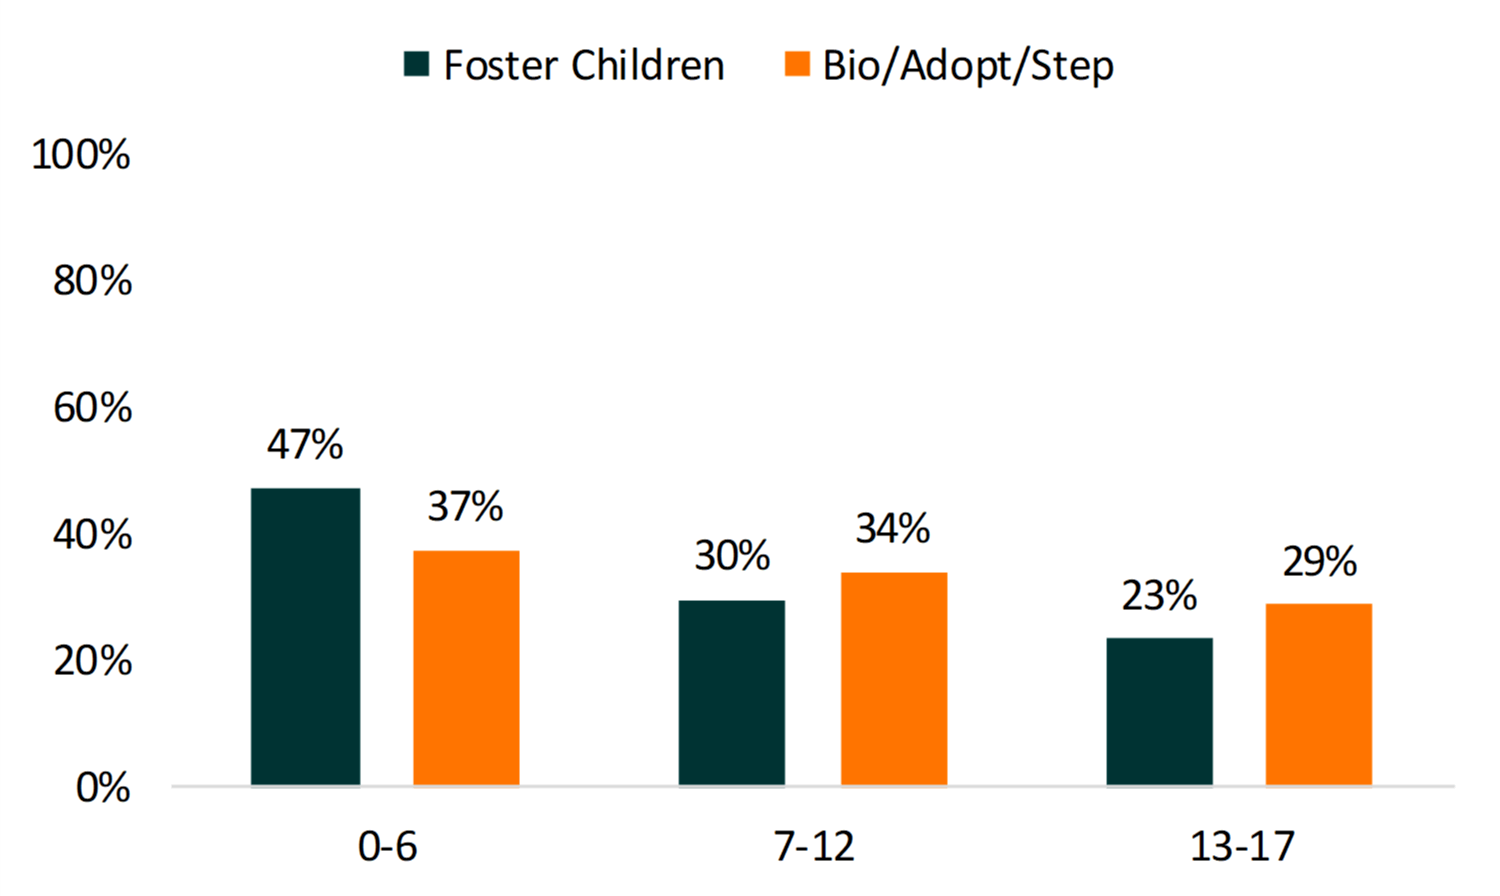
Children in foster care were often younger than those who were not in foster care; in 2016-2018, 47% of foster children were 6 or younger compared to only 37% of other children.
- About one-quarter of foster children were teenagers (13-27) in contrast to 29% of biological, adopted, or stepchildren.
Figure 2. Age of Foster Children and Biological/Adopted/Stepchildren, 2016-2018

Race/Ethnicity of Foster Children, 2016-2018
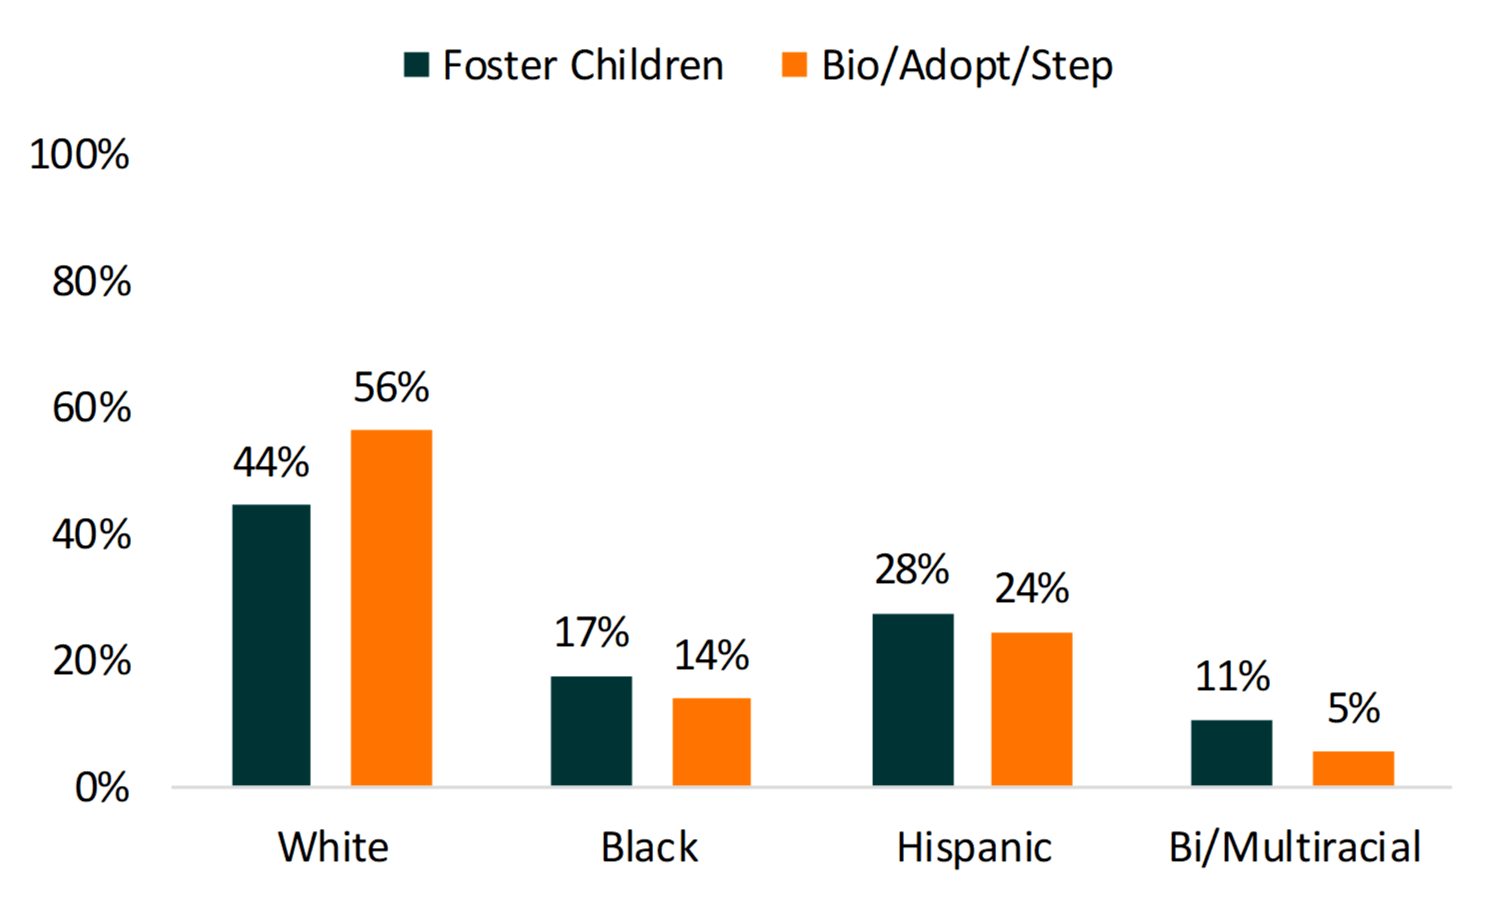
Foster children were more racially and ethnically diverse compared with biological, adopted, and stepchildren in the U.S.
- Over one-quarter (28%) of foster children were Hispanic, and almost one-fifth (17%) of foster children were Black.
- The majority of biological, adopted, and stepchildren were White (56%). The majority of foster children were either Black, Hispanic, or multiracial.
Figure 3. Race/Ethnicity of Foster Children vs Biological/Adopted/Stepchildren, 2016-2018

Poverty Status of Foster Children, 2016-2018
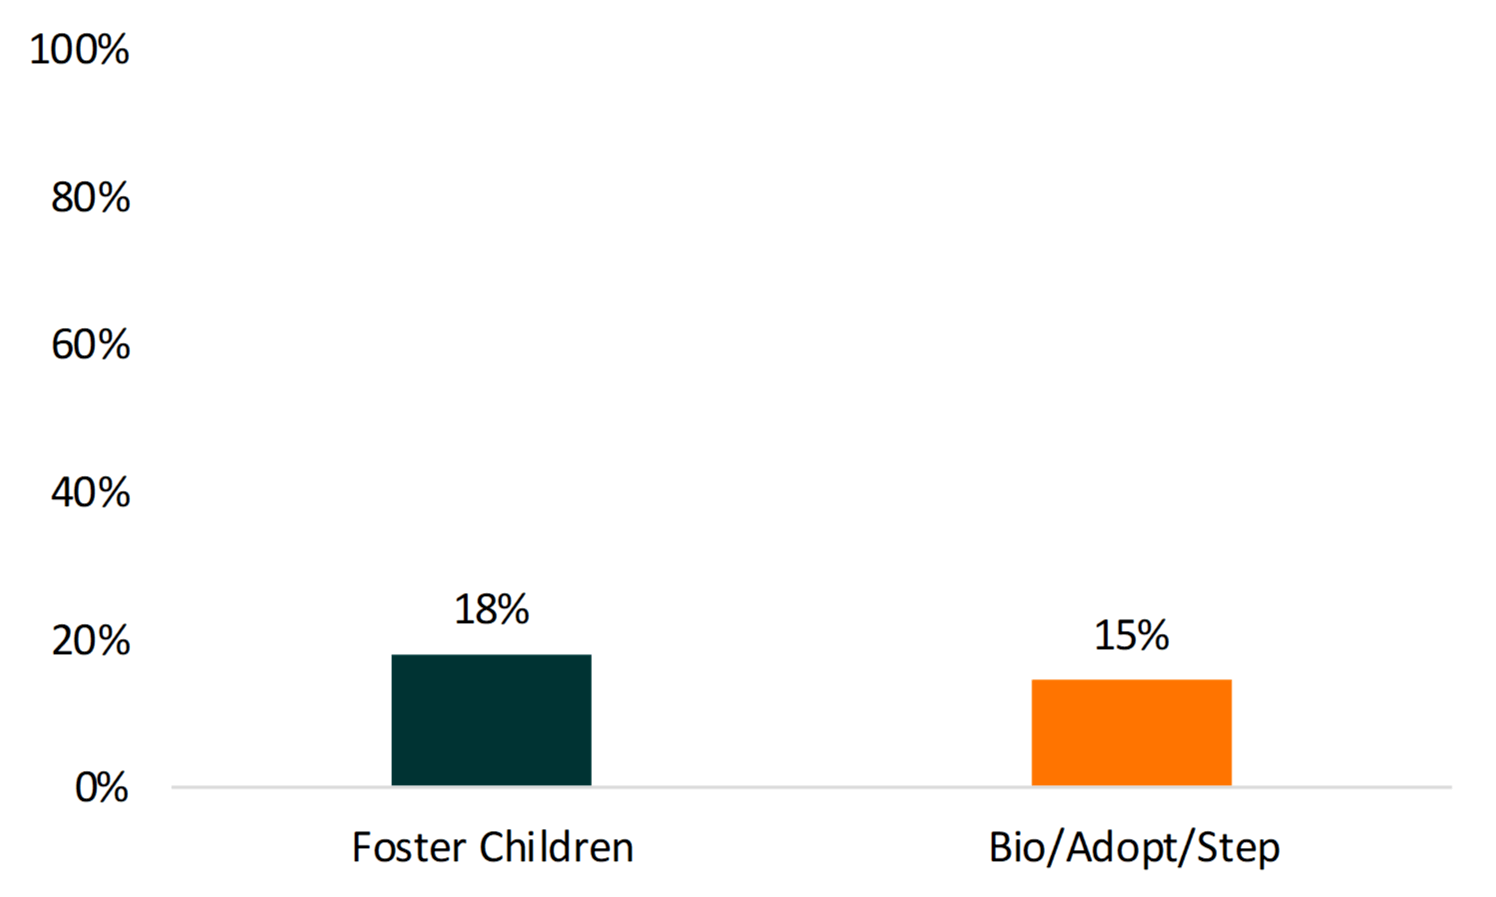
- About 18% of foster children lived in poverty compared with 15% of other children.
Figure 4. Children Living in Poverty (Supplemental): Foster Children vs. Biological/Adopted/Stepchildren, 2016-2018

For more information on the history of the poverty measure, please visit the United States Census Bureau’s website at https://www.census.gov/
References
- Flood, S., King, M., Rodgers R., Ruggles, S, and Warren, J. R. (2018). Integrated Public Use Microdata Series, Current Population Survey: Version 6.0. Minneapolis, MN: IPUMS, 1988-2018. https://doi.org/10.18128/D030.V6.0
- O’Hare, W. P. (2008). Data on Children in Foster Care from the Census Bureau. Kids Count, The Annie E. Casey Foundation.
- United States. (2016). The AFCARS report. Washington, D.C.: U.S. Dept. of Health and Human Services, Administration for Children and Families, Administration on Children, Youth and Families, Children's Bureau.
Suggested Citation
- Schweizer, V.J. (2019). Characteristics of foster children in the U.S., 2016-2018. Family Profiles, FP-19-09. Bowling Green, OH: National Center for Family & Marriage Research. https://doi.org/10.25035/ncfmr/fp-19-09.
Updated: 11/12/2025 09:43AM

