Remarriage Rate in the U.S.: Geographic Variation, 2019
Family Profile No. 18, 2021
Author: Leslie Reynolds
Although approximately half of all marriages in the U.S. end in divorce (Amato, 2010; Cherlin, 2010), the remarriage rate has declined steadily in recent decades (Brown & Lin, 2013; Schweizer, 2019). In this profile, we examine the trend in the remarriage rate since 1990 (see Note) and investigate geographic variation in the remarriage rate by gender using recent American Community Survey (ACS) data. This profile is an update of a previous profile on the Geographic Variation in the Remarriage Rate (FP-15-08).
- In 2019, the remarriage rate was approximately 25.1 remarriages per 1,000 men and women eligible to remarry.
- This estimate represents a 50% decrease from the 1990 remarriage rate and a 25% decrease from the 2008 remarriage rate.
- The remarriage rate is consistently higher for men (35.1) than women (19.4).
- Men experienced a slightly greater decline (28%) than women (23%) since 2008.
- Men are older, on average, than women when they remarry (not shown).
- In 2019, the median age at remarriage was 48 for men and 44 for women (compared to 45.5 and 42.8 in 2013).
Figure 1. Remarriage Rate in the U.S., 1990-2019
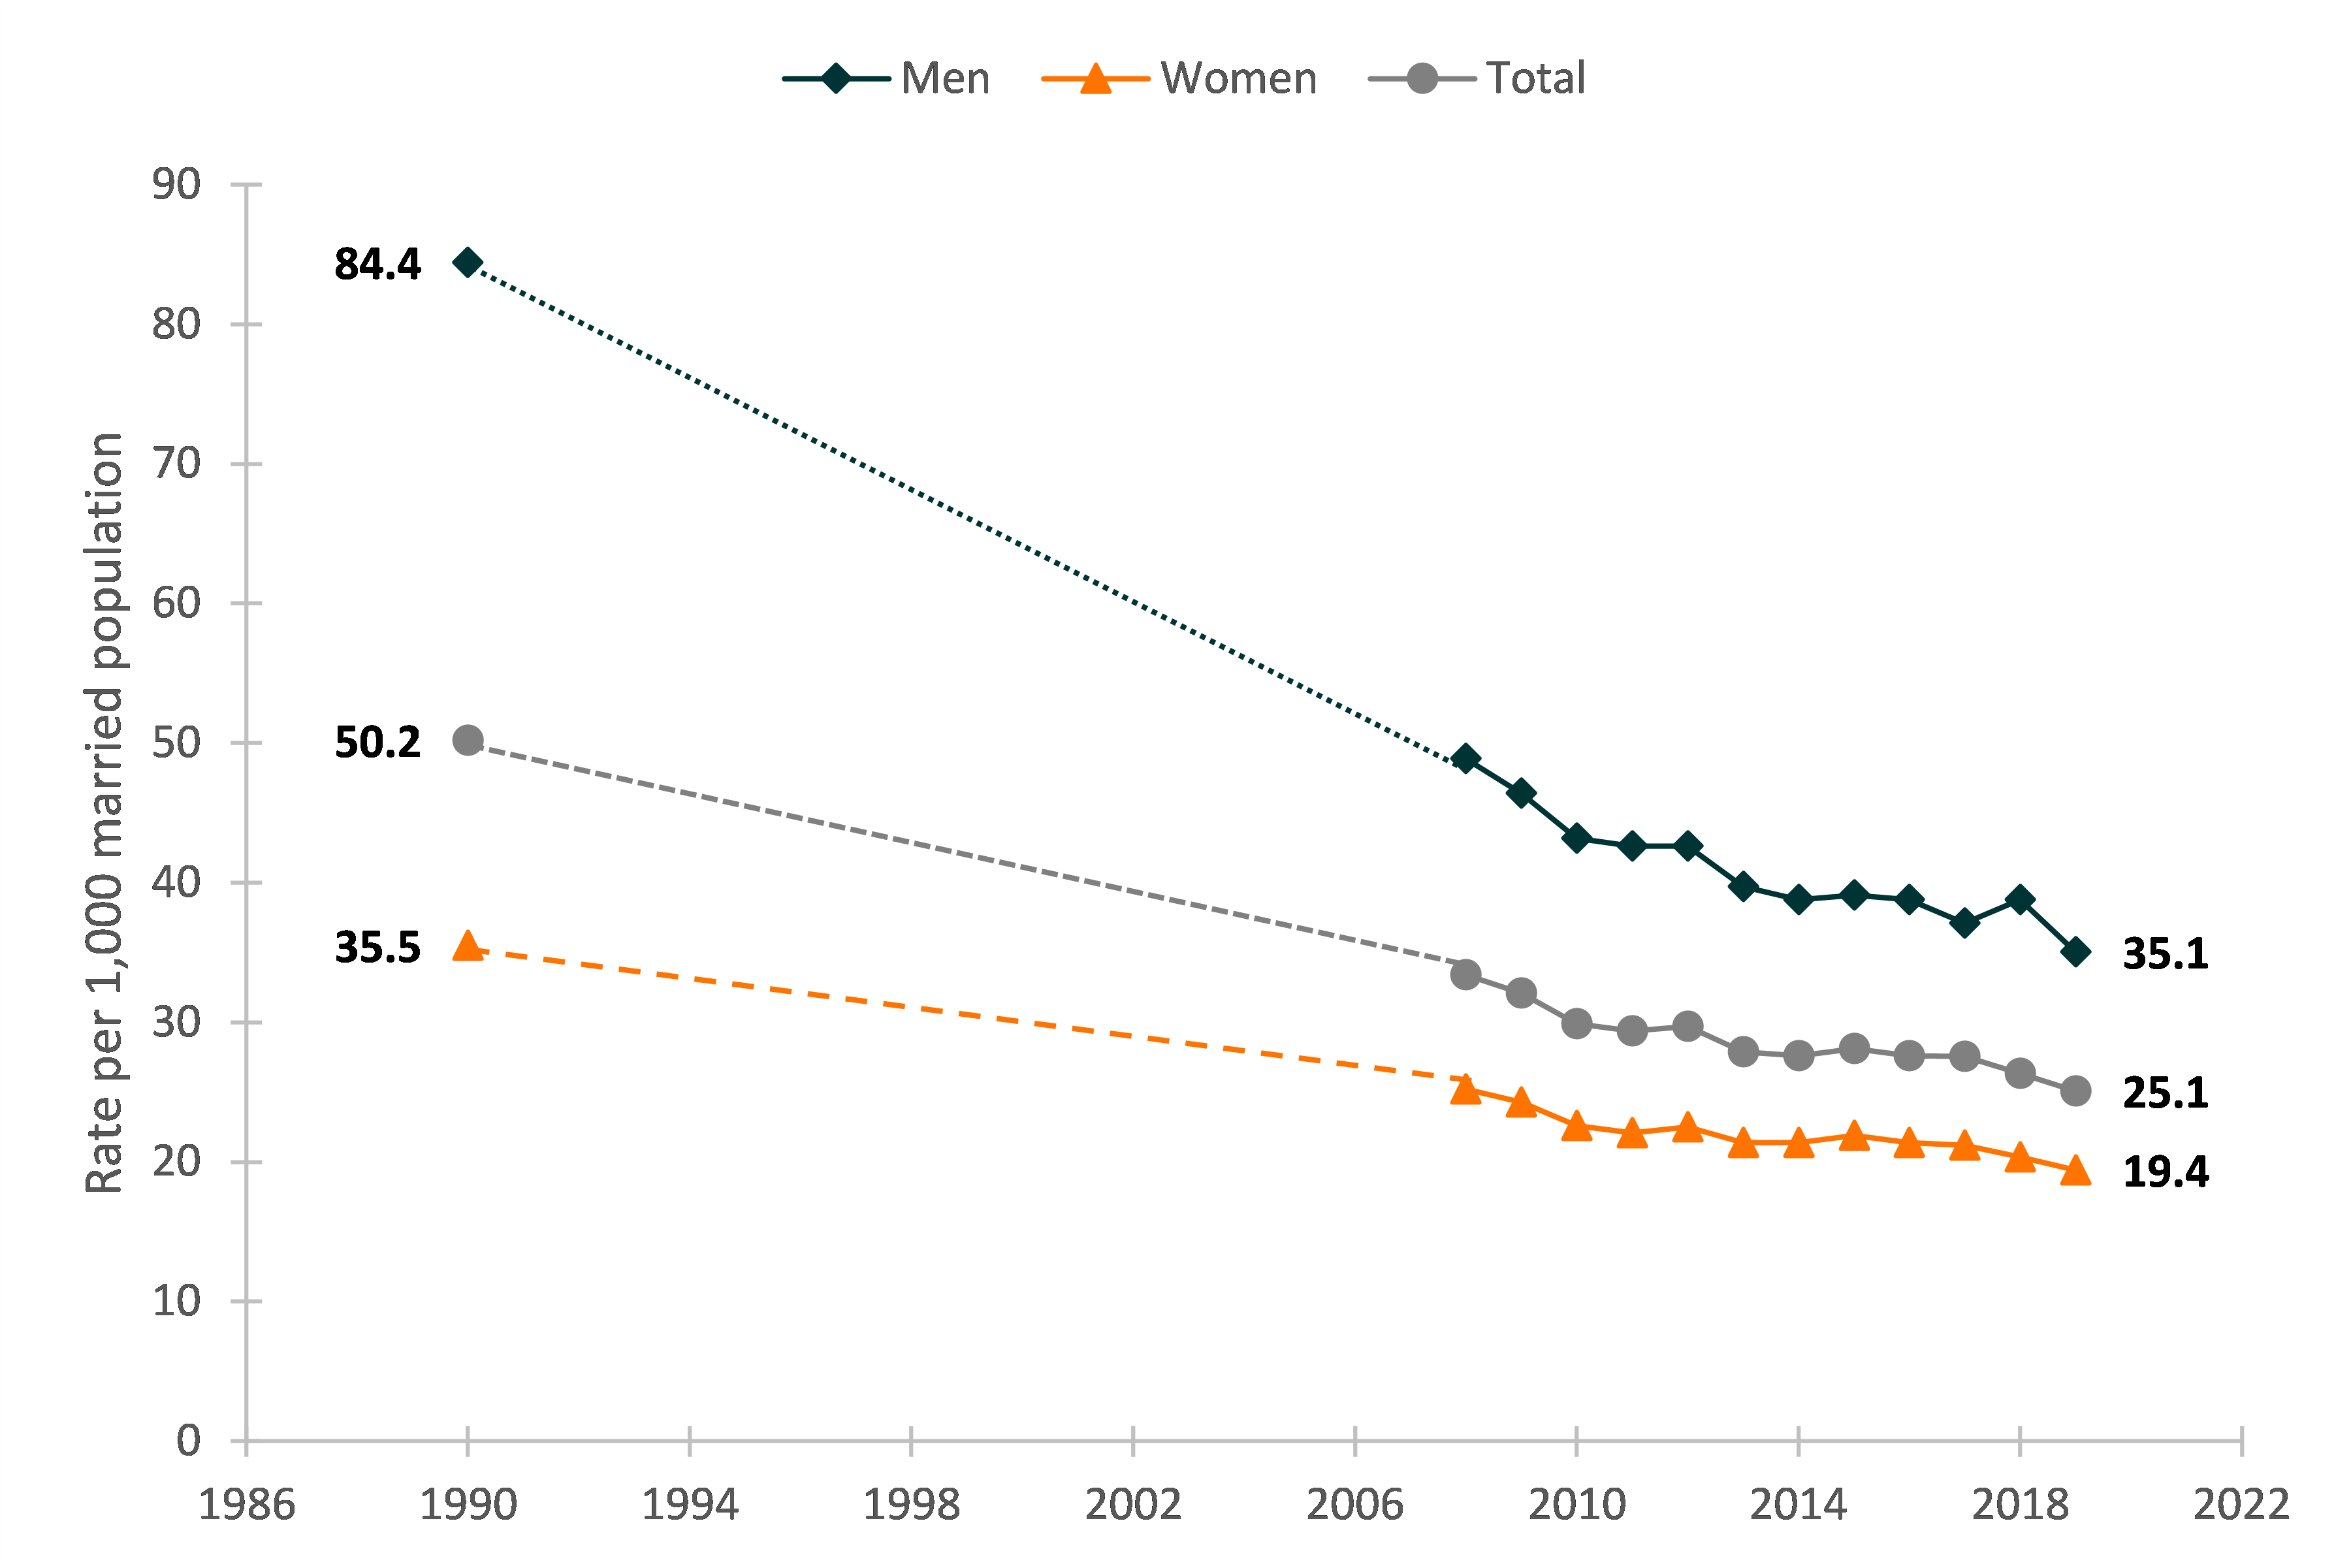
Note: This profile estimates remarriage rates based on adults (18 and older) at risk of remarriage in the past 12 months. Men and women at risk are divorced or widowed.
Five States with the Highest and Lowest Remarriage Rates
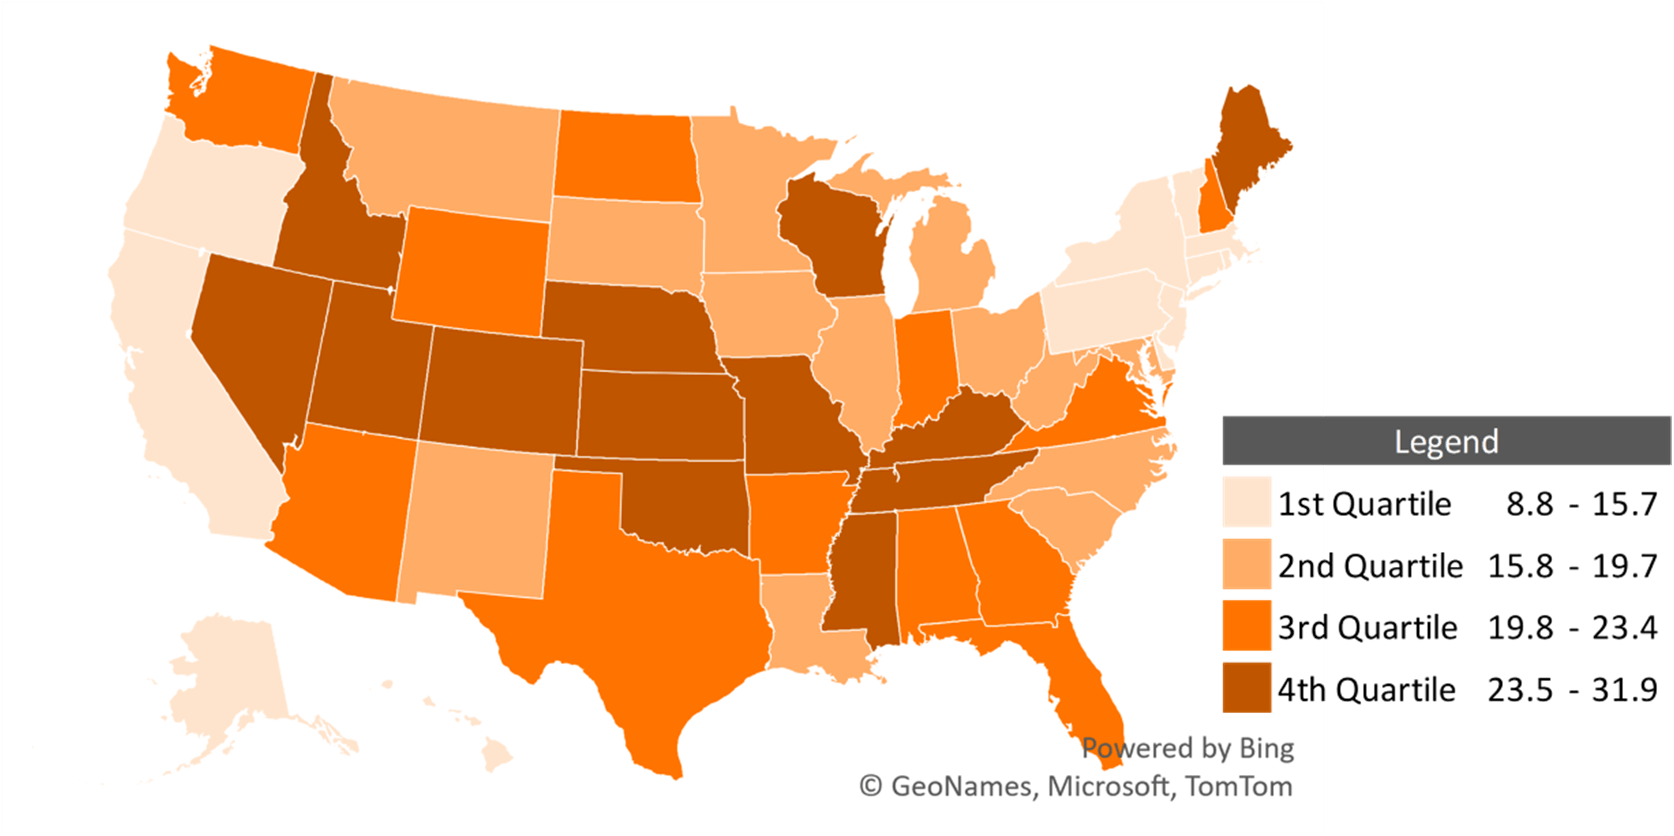
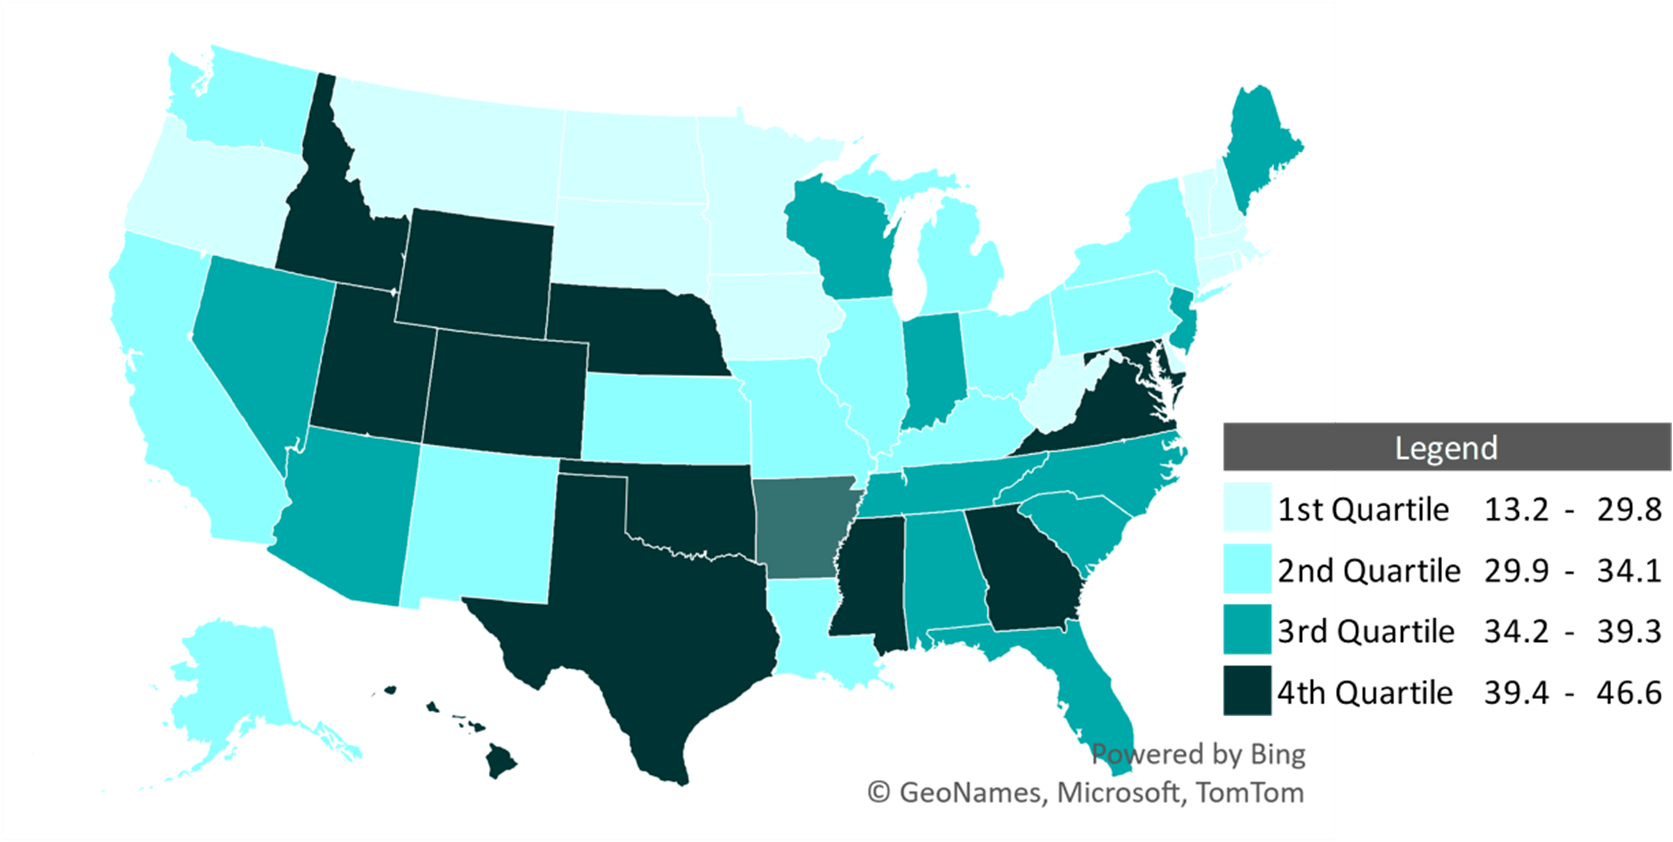
- Among the states with the highest remarriage rates for both men and women, most are located in the West or the Midwest.
- For women, the lowest remarriage rates are located in the Northeastern United States (Rhode Island, Massachusetts, Connecticut, New York, Vermont, Pennsylvania, District of Columbia).
- For men, the lowest remarriage rates are located in the Northeastern (Rhode Island, Vermont, Connecticut, Massachusetts, New Hampshire) and Midwest (North Dakota, South Dakota, Iowa, Minnesota) United States.
Table 1. Women’s and Men’s Highest and Lowest Remarriage Rates
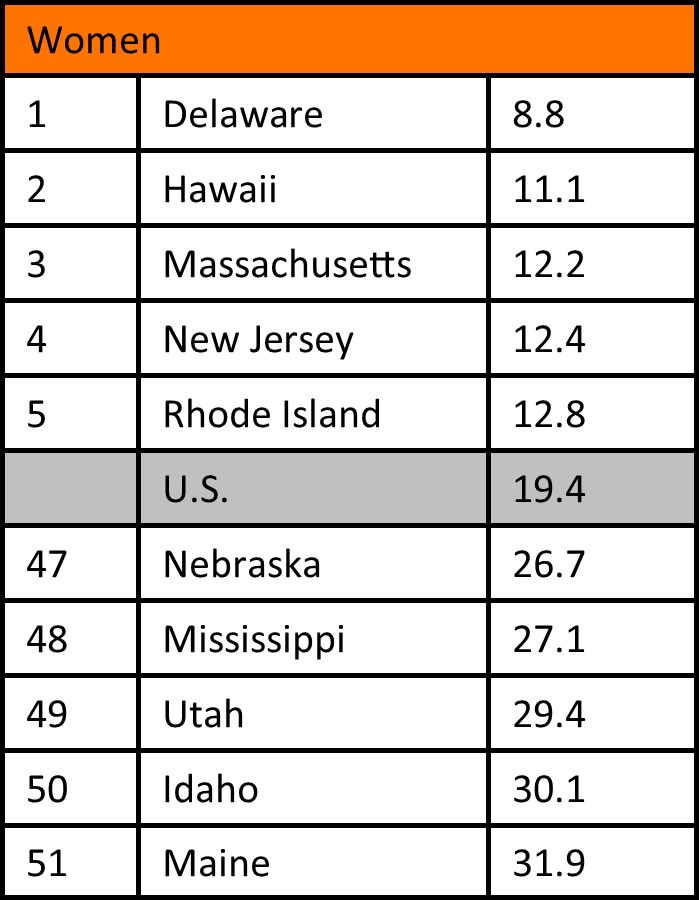
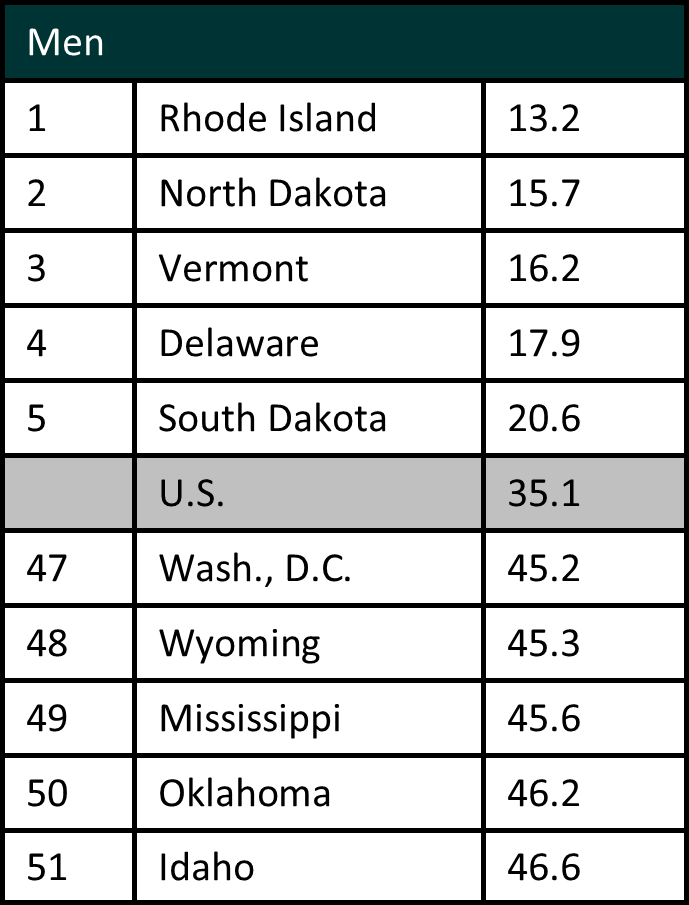
Figure 2: Geographic Variation of U.S. Women’s and Men’s Remarriage Rates by state, 2019
References
Amato, P. R. (2010). Research on divorce: Continuing trends and new developments. Journal of Marriage and Family, 72(3), 650-666. DOI: 10.1111/j.1741-3737.2010.00723.x
Brown, S. L., & Lin, I.-F. (2013). Age Variation in the remarriage rate, 1990-2011. Family Profiles, FP-13-17. Bowling Green, OH: National Center for Family & Marriage Research. https://www.bgsu.edu/content/dam/BGSU/college-of-arts-and-sciences/NCFMR/documents/FP/FP-13-17.pdf
Cherlin, A. (2010). Demographic trends in the United States: A review of research in the 2000s. Journal of Marriage and Family, 72(3), 403-419. DOI: 10.1111/j.1741- 3737.2010.00710.x
Payne, K. K. (2015). Remarriage rate: Geographic variation, 2013. Family Profiles, FP-15-08. Bowling Green, OH: National Center for Family & Marriage Research. https://www.bgsu.edu/ncfmr/resources/data/family-profiles/payne-remarriage-rate-fp-15-08.html
Schweizer, V. (2019). The retreat from remarriage, 1950-2017. Family Profiles, FP-19-17. Bowling Green, OH: National Center for Family & Marriage Research. https://doi.org/10.25035/ncfmr/fp-19-17
Suggested Citation:
Reynolds, L. (2021). The U.S. remarriage rate, 2019: Trends and geographic variation by gender. Family Profiles, FP-21-18. Bowling Green, OH: National Center for Family & Marriage Research. https://doi.org/10.25035/ncfmr/fp-21-18
Updated: 11/12/2025 09:34AM


