Median Age at First Marriage: Geographic Variation, 2017
Family Profile No. 07, 2019
Author: Krista K. Payne
In this profile, the median age at first marriage is estimated for the nation and each state by gender for 2017 using 1-year estimates from the American Community Survey (ACS). Direct estimates of the age at which half of men and women (who in the last year) married for the first time as well as the associated margins of error are provided. The ACS has been collecting data on marriage for nearly a decade.
Trend in Median Age at First Marriage by Gender, 2008-2017
- The U.S. median age at first marriage is at a historic highpoint.
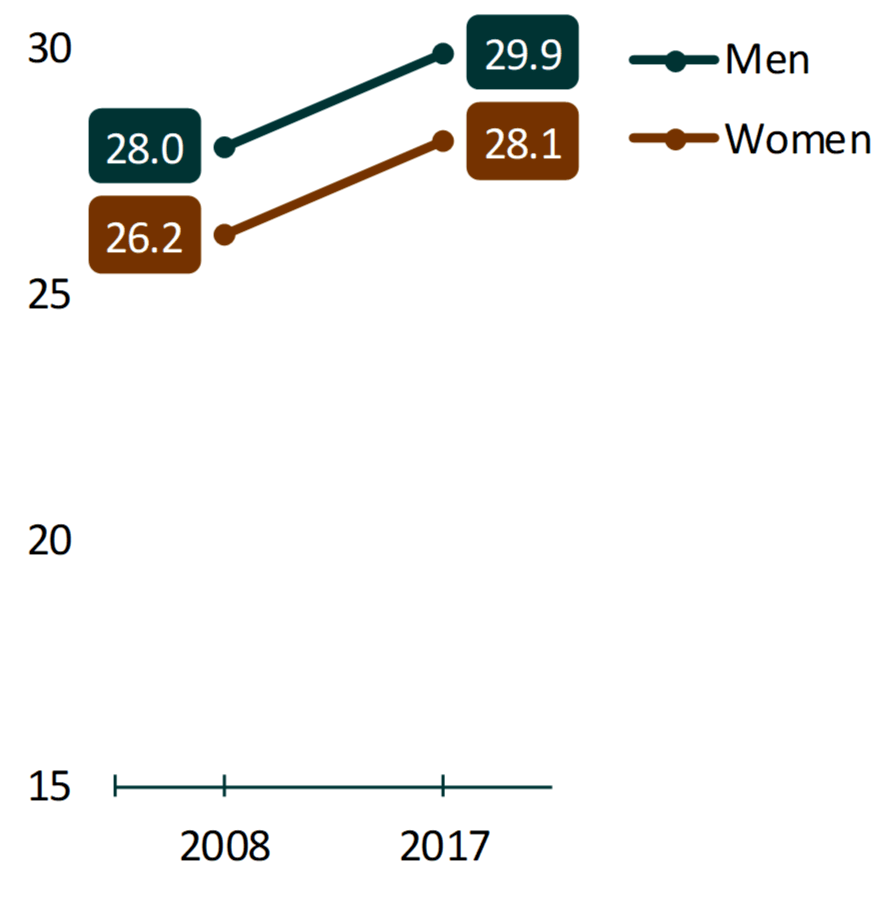
- Since 2008, the age at first marriage has increased by 1.9 years, reaching nearly 30 among men and 28 among women (Figure 1).
Figure 1. Men and Women's Median Age at First Marriage, 2008 & 2017

States with the Highest and Lowest Age Gaps in Median Age at First Marriage, 2017
- Historically, men marry at later ages than women. The gender gap in the median age at first marriage tends to be about two years (1.8 in both 2008 and 2017). In contrast, reported ideal timing of marriage varied greatly by racial/ethnic category for young women.
- However, this gap is not uniform across all states and instead ranges from as high as 3.5 years in Wyoming to as low as .10 years in Hawaii.
- Hawaii is quite the exception; it is the only state in which the median age at first marriage among women (28.2) is greater than that of men (28.1).
States with the Highest and Lowest Median Age at First Marriage by Gender, 2017
- Men living in New York have the highest median age at first marriage at 31.4 years. Conversely, men in Utah have the youngest median age at first marriage of 26.1.
- Women who live in Washington, D.C. experienced the highest median age at first marriage (30.4), while women living in Utah had the lowest at 24.8.
- Four states are ranked at the top for oldest ages at first marriage among both men and women —New York, Massachusetts, Connecticut, and Washington D.C. Over the last decade, these states have had the highest ages at first marriage.
- Four states rank at the bottom with the youngest ages at first marriage for both men and women—Oklahoma, Arkansas, Idaho, and Utah. These states have had the youngest ages at first marriage over the last decade.
Table 1. Median Age at 1st Marriage, 2008: Men's
Top & Bottom Five States
| Rank | State |
Age | MOE |
|---|---|---|---|
1 2 3 3 5 5 5 |
New York Massachusetts California Connecticut New Hampshire New Jersey Wash, D.C. |
31.4 31.2 30.9 30.9 30.7 30.7 30.7 |
+/-.06 +/-0.3 +/-0.4 +/-0.2 +/-0.7 +/-0.3 +-/0.7 |
| U.S. | 29.9 | +/-0.2 | |
47 48 49 50 51 |
Kentucky Oklahoma Arkansas Idaho Utah |
28.0 27.5 27.3 26.7 26.1 |
+/-0.5 +/-0.5 +/-0.7 +/-1.0 +/-0.4 |
Table 2. Median Age at 1st Marriage, 2008:
Women's Top & Bottom Five States
| Rank | State |
Age | MOE |
|---|---|---|---|
1 2 3 3 5 |
Wash, D.C. Massachusetts Connecticut New York Rhode Island |
30.4 30.1 29.7 29.7 29.3 |
+/-.06 +/-0.3 +/-0.4 +/-0.2 +/-0.7 |
| U.S. | 28.1 | +/-0.1 | |
47 48 49 50 51 |
Oklahoma Arkansas Idaho Wyoming Utah |
25.8 25.6 25.2 25.0 24.8 |
+/-0.2 +/-0.4 +/-1.2 +/-0.6 +/-0.3 |
Source: NCFMR analyses of U.S. Census Bureau, American Community Survey, 1-year estimates, 2008 & 2017
State Rankings and Geographic Variation in the Median Age at First Marriage by Gender, 2017
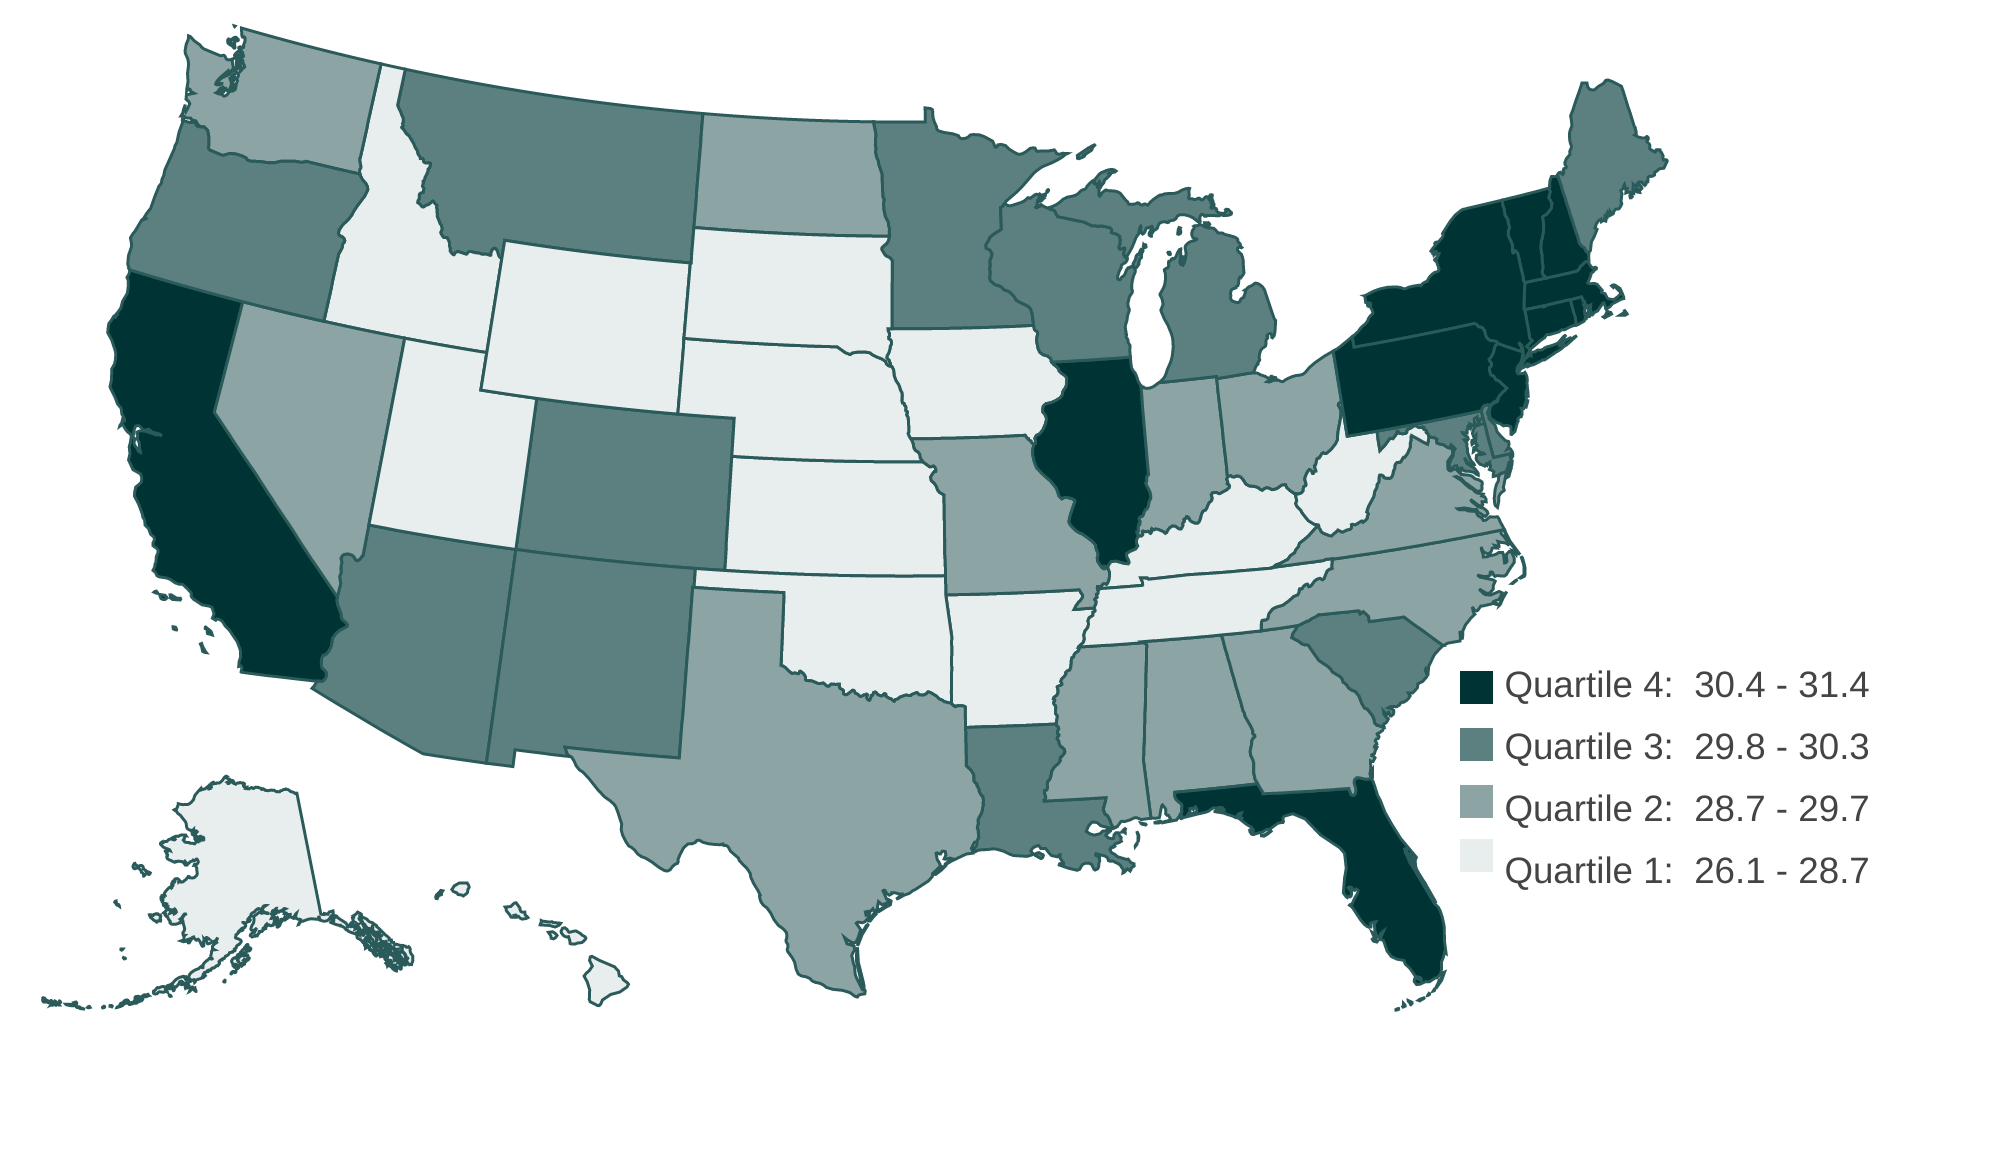
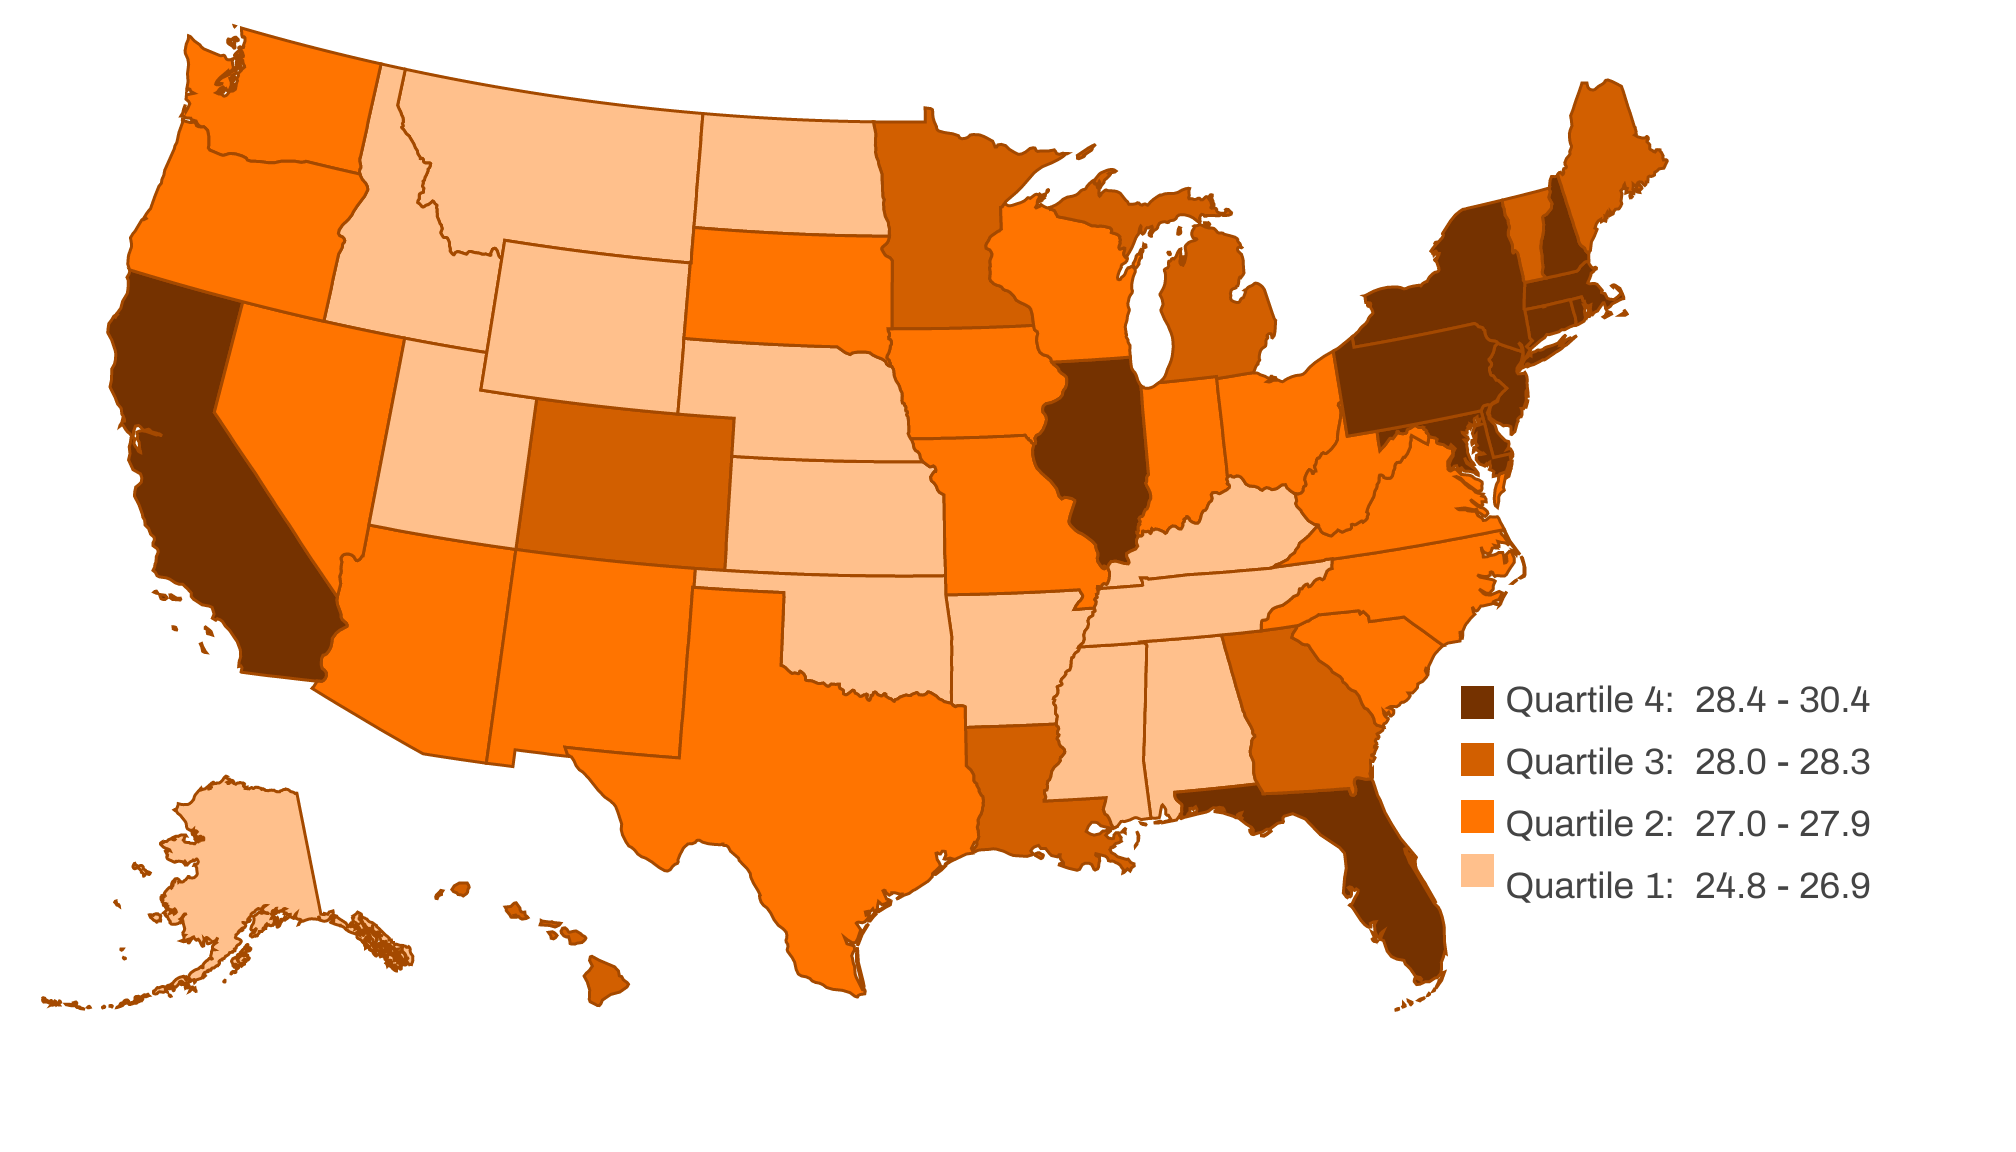
The state rankings are divided into quartiles with confidence intervals presented to determine significant differences.
- Among both men and women, the states in the top quartile are significantly above the national average. The top quartile consists of ages 30.4 and older for men and 28.9 and older for women.
- The states falling in the bottom quartile had median ages at marriage of 28.7 or younger for men and 26.9 or younger among women. The median age at marriage in the states in the bottom quartile are significantly below the national average.
- Most states in the Northeastern region had high ages at first marriage (first quartile). The exceptions include Maine (among men and women) and Vermont (among women).
- For men and women, most Midwestern & Southern states exhibited ages at first marriage in the bottom two quartiles. Similarly, the median age at first marriage among women living in Western states are mostly found in the bottom two quartiles.
Figure 2. Men's State-level Median Age at First Marriage by Quartile, 2017


Figure 3. Women's State-level Median Age at First Marriage by Quartile, 2017


Source: NCFMR analyses of U.S. Census Bureau, American Community Survey, 1-year estimates, 2008 & 2017
Suggested Citation:
Payne, K.K. (2019). Median age at first marriage: Geographic variation, 2017. Family Profiles, FP-19-07. Bowling Green, OH: National Center for Family & Marriage Research. https://doi.org/10.25035/ncfmr/fp-19-07.
This project is supported with assistance from Bowling Green State University. From 2007 to 2013, support was also provided by the U.S. Department of Health and Human Services, Office of the Assistant Secretary for Planning and Evaluation. The opinions and conclusions expressed herein are solely those of the author(s) and should not be construed as representing the opinions or policy of any agency of the state or federal government.
Updated: 04/06/2021 01:50PM


