Marital Experiences in the U.S., 1996 & 2018
Family Profile No. 24, 2021
Author: Krista K. Payne
Marital behavior in the United States has shifted dramatically in the last two decades, with declines in the marriage rate and divorce rate (FP-20-21, FP-20-29) and continued growth in the median age at first marriage for both men and women (FP-21-12). While there are reports of the share of the population currently married, divorced, or widowed (FP-20-21), less is known about trends over time in the share of men and women who have experienced marriage, divorce, or widowhood during their lifetime. We report the share ‘ever’ married, divorced, or widowed for select birth cohorts covering a twenty-year time span, using data from the 2018 Survey of Income and Program Participation to update results from the Current Population Report Number, Timing, and Duration of Marriages and Divorces: 1996 (Kreider & Fields, 2001). We examine the marital experiences and disaggregate by birth cohorts, age, and gender.
Share Ever Married by Birth Cohort and Gender
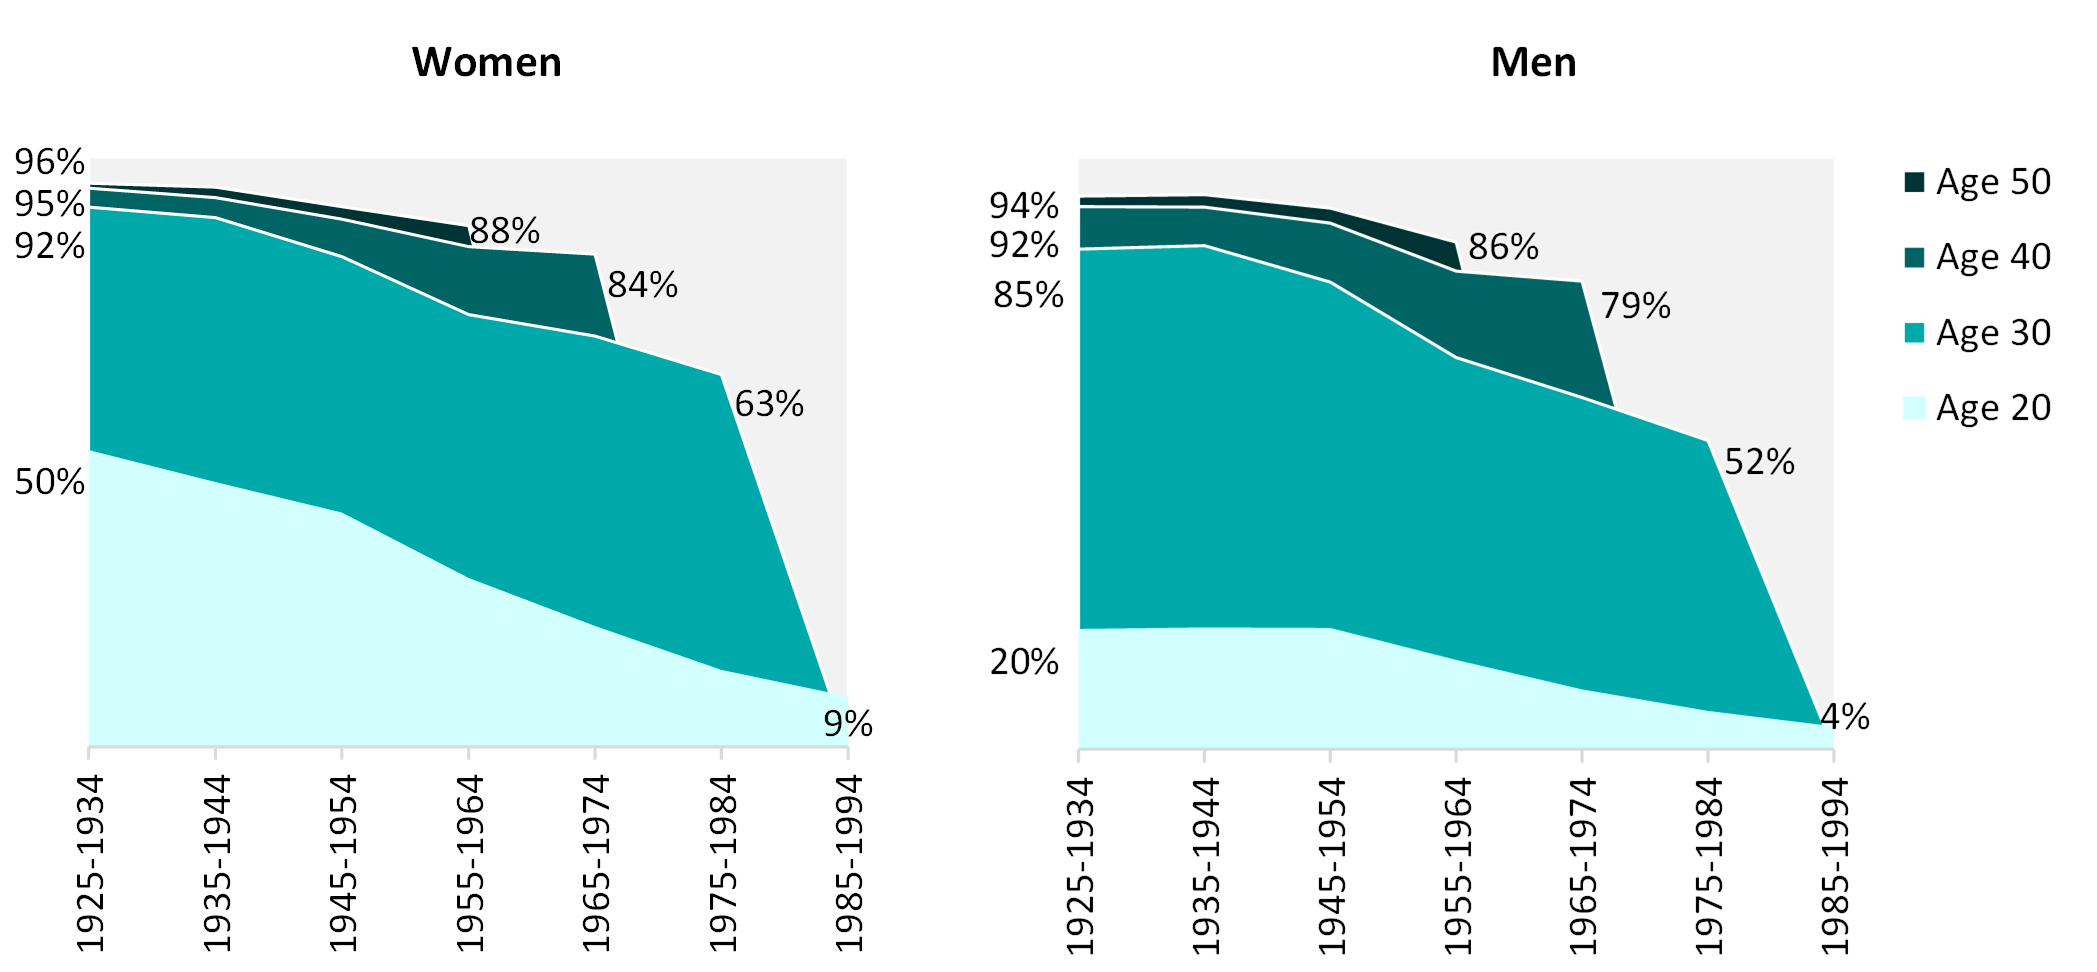
Since 1996, the share of Americans who had ever married dropped. Figure 1 visualizes the cumulative percentage of those who had ever married by certain ages according to birth cohort by gender.
- The largest cohort difference observed was among women’s marital experience by age 20. Half of women born from 1925 to 1934 had already married by age 20 compared to only 9% of women born 60 years later (1985-1994).
- Men also experienced a dramatic reduction in the share who had ever married by age 20. Among men in the oldest cohort, 20% had married by their twentieth birthdays, whereas among men in the youngest cohort, only 4% had.
- Among those born in the earliest cohort, by age 40, over 90% had married. Four decades later, this share had dropped to 84% among women and 79% among men.
Figure 1. Cumulative Percentage Ever Married by Ages 20, 30, 40, and 50 by Birth Cohort and Gender

Ever Remarried by Age
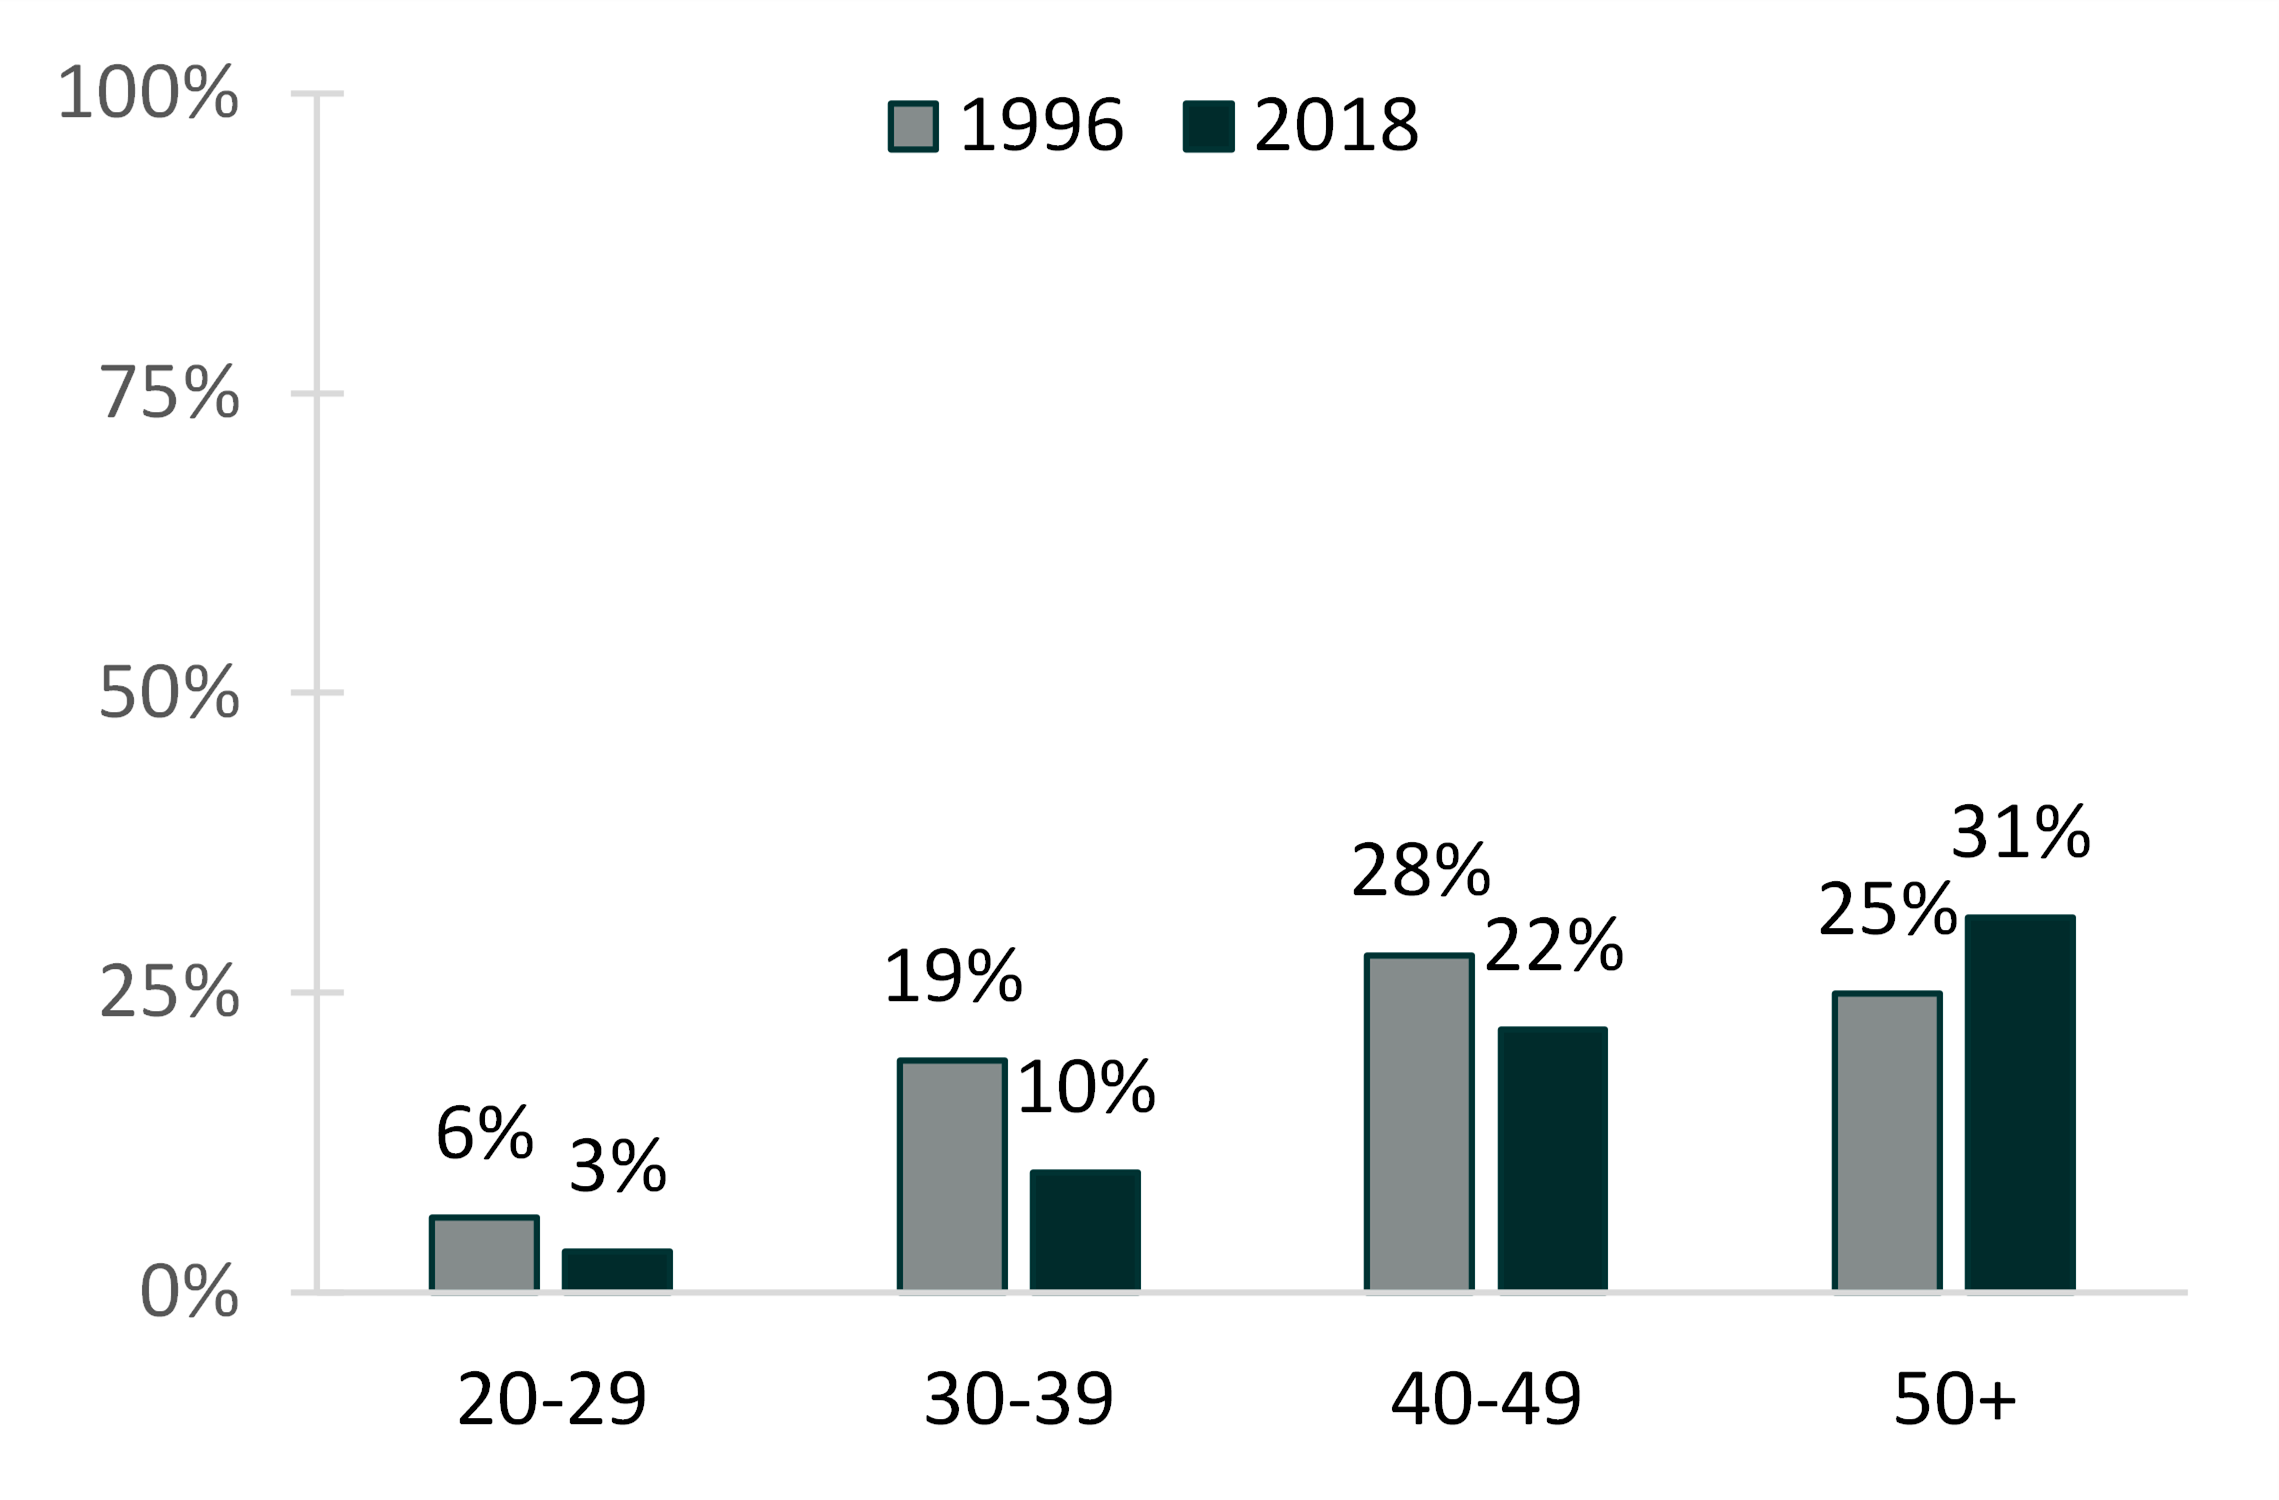
- Among those under the age of 50, the share who had ever remarried was lower in 2018 than in 1996.
- While the share who had experienced a remarriage was higher among those in their thirties compared to those in their twenties, the reduction from 1996 to 2018 was nearly the same for each. Between 1996 and 2018, there was about a fifty percent decline in the share remarried.
- The decline in remarriage was smaller among men and women in their 40s. Among forty-somethings in 1996, 28% had ever remarried compared to 22% in 2018.
- For those aged 50 or older a different pattern emerged—the share who had ever remarried was larger in 2018, at nearly one-third compared to one-quarter of similarly aged individuals in 1996.
Figure 2. Percentage Ever Remarried by Age Group 1996 & 2018

Ever Divorced by Age
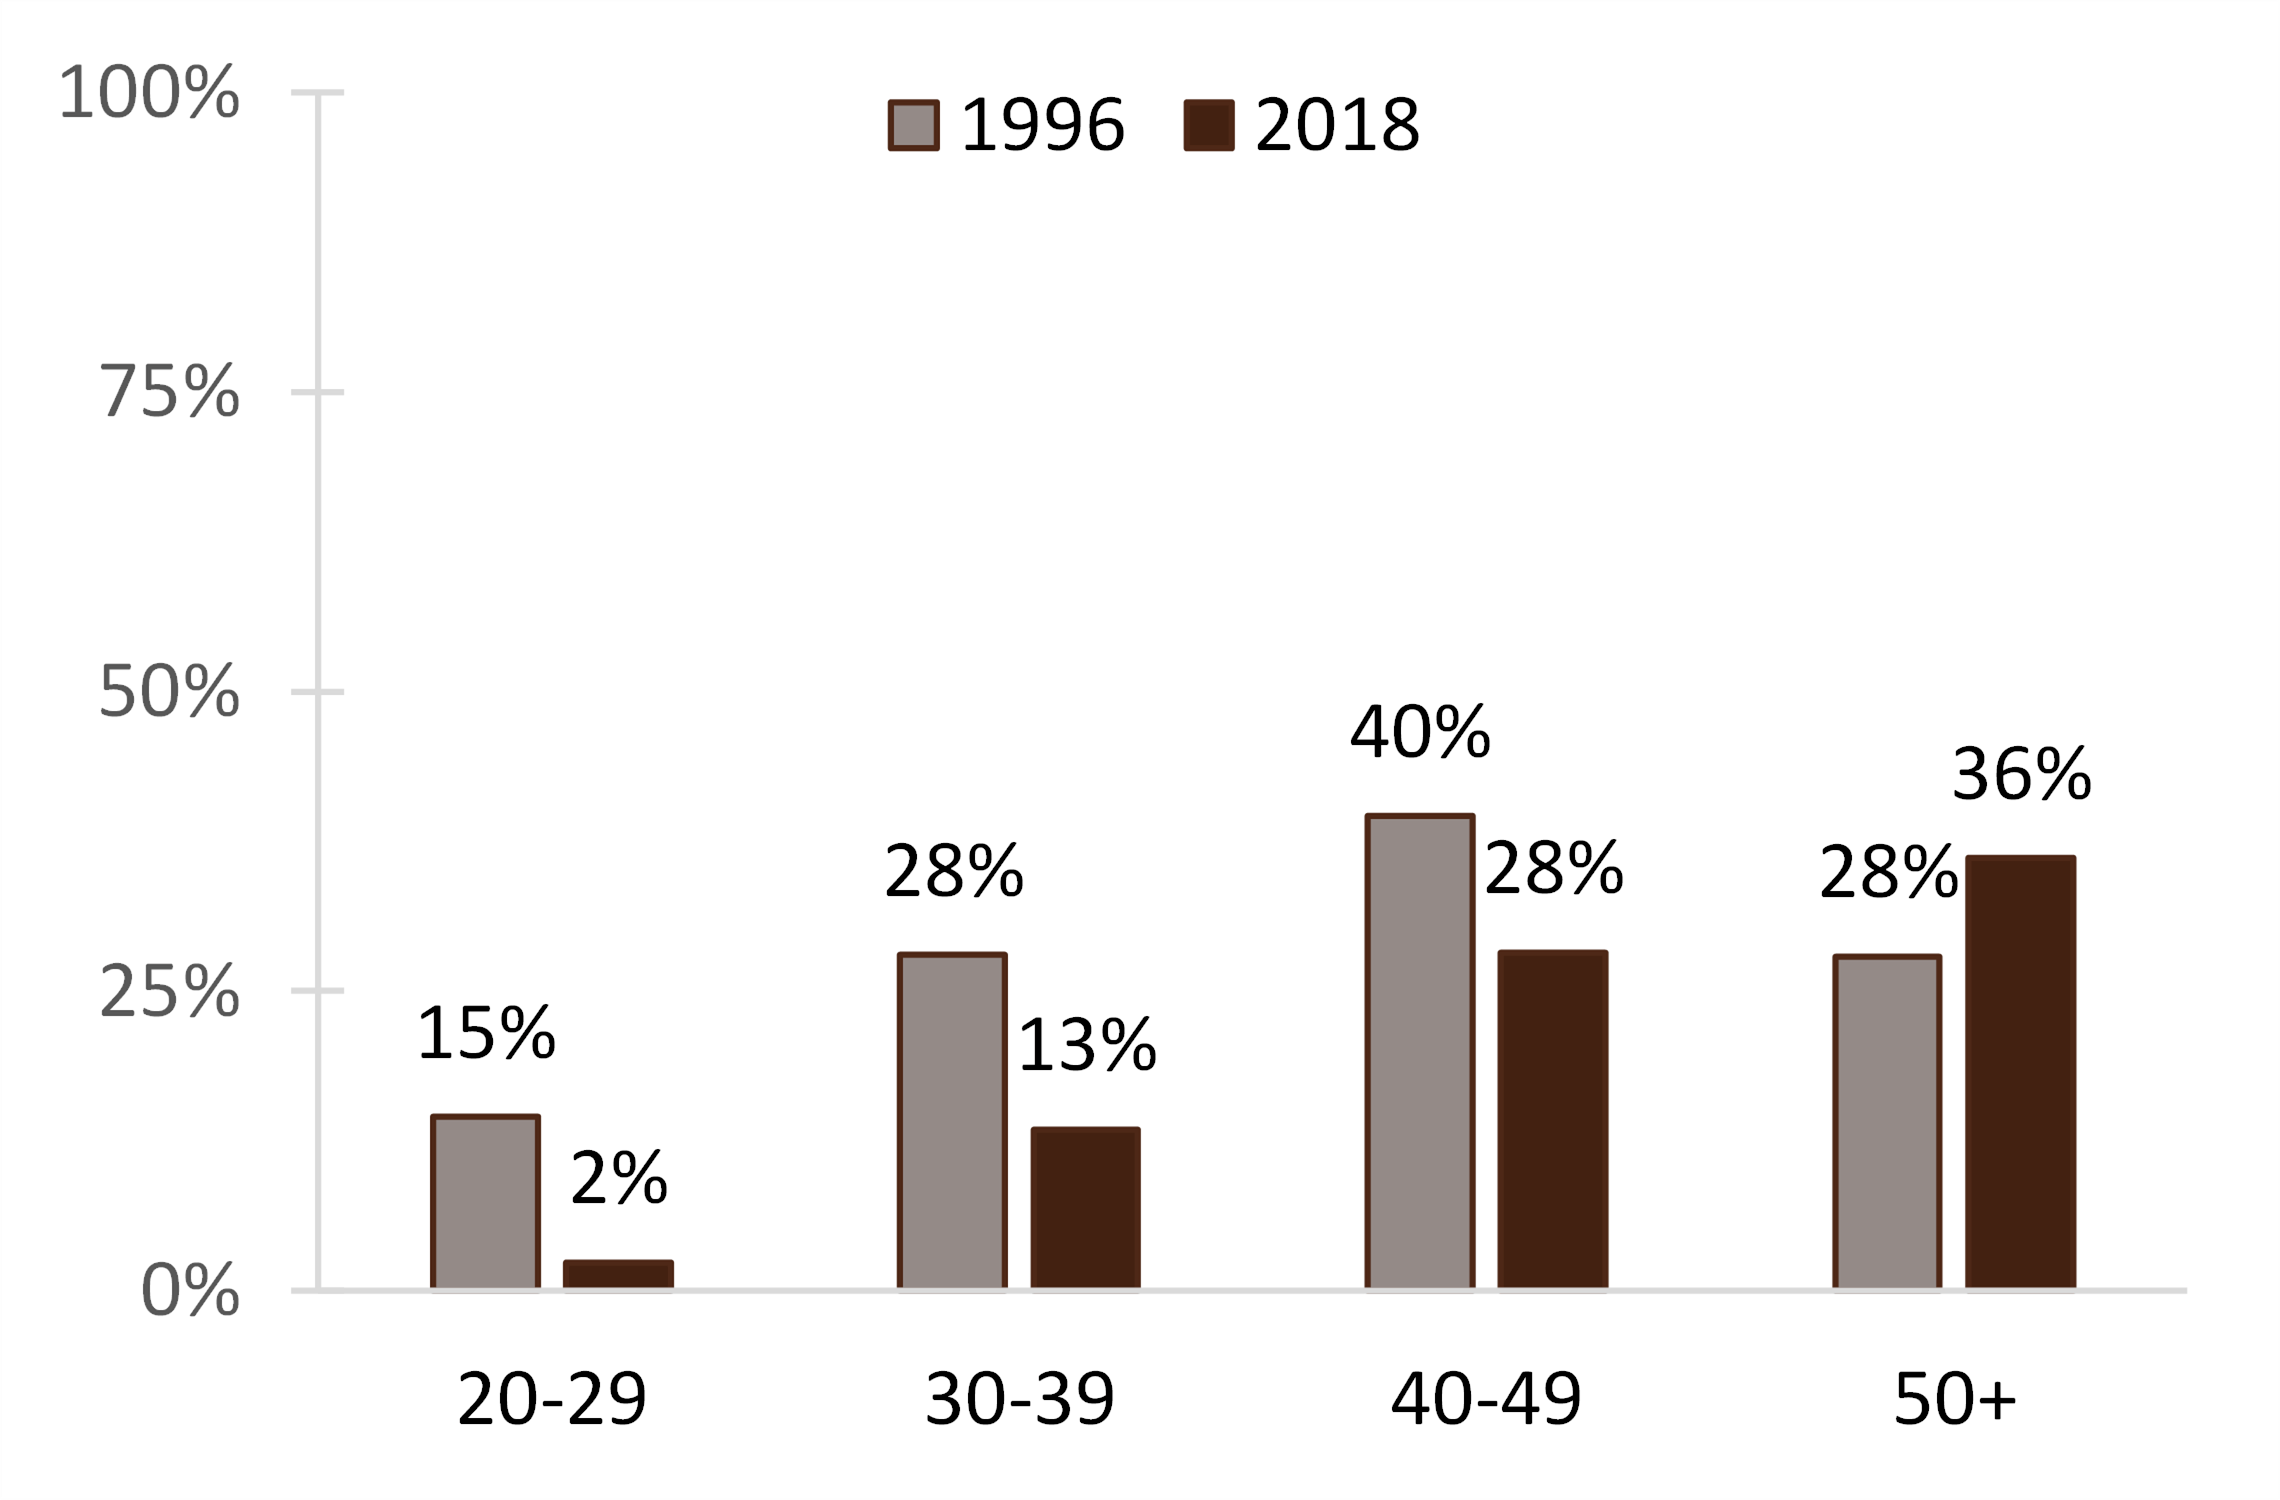
- Among those under the age of 50, the share who had ever experienced a divorce was lower in 2018 compared to 1996.
- In 1996, 15% of ever married individuals in their 20s experienced a divorce, dropping to only 2% by 2018.
- Among those in their 30s, the share who had ever divorced dropped by more than half—from 28% to 13%.
- While a smaller share of individuals in their 40s had ever divorced in 2018 (28%) than in 1996 (40%), the drop was not as dramatic as observed among younger age groups.
- For those aged 50 or older, the share who had ever divorced was greater in 2018. Over one-third (36%) of ever married men and women over age 50 had ever divorced—compared to 28% of similarly aged individuals in 1996.
Figure 3. Percentage Ever Divorced Among Ever Married Individuals by Age, 1996 & 2018

Ever Widowed Among Those Aged 50 or Older by Gender
The share ever widowed is based on the number individuals who have ever been widowed divided by the number who had ever been married. Widowhood is relatively rare among younger adult age groups; therefore, we limit our comparison to those 50 or older.
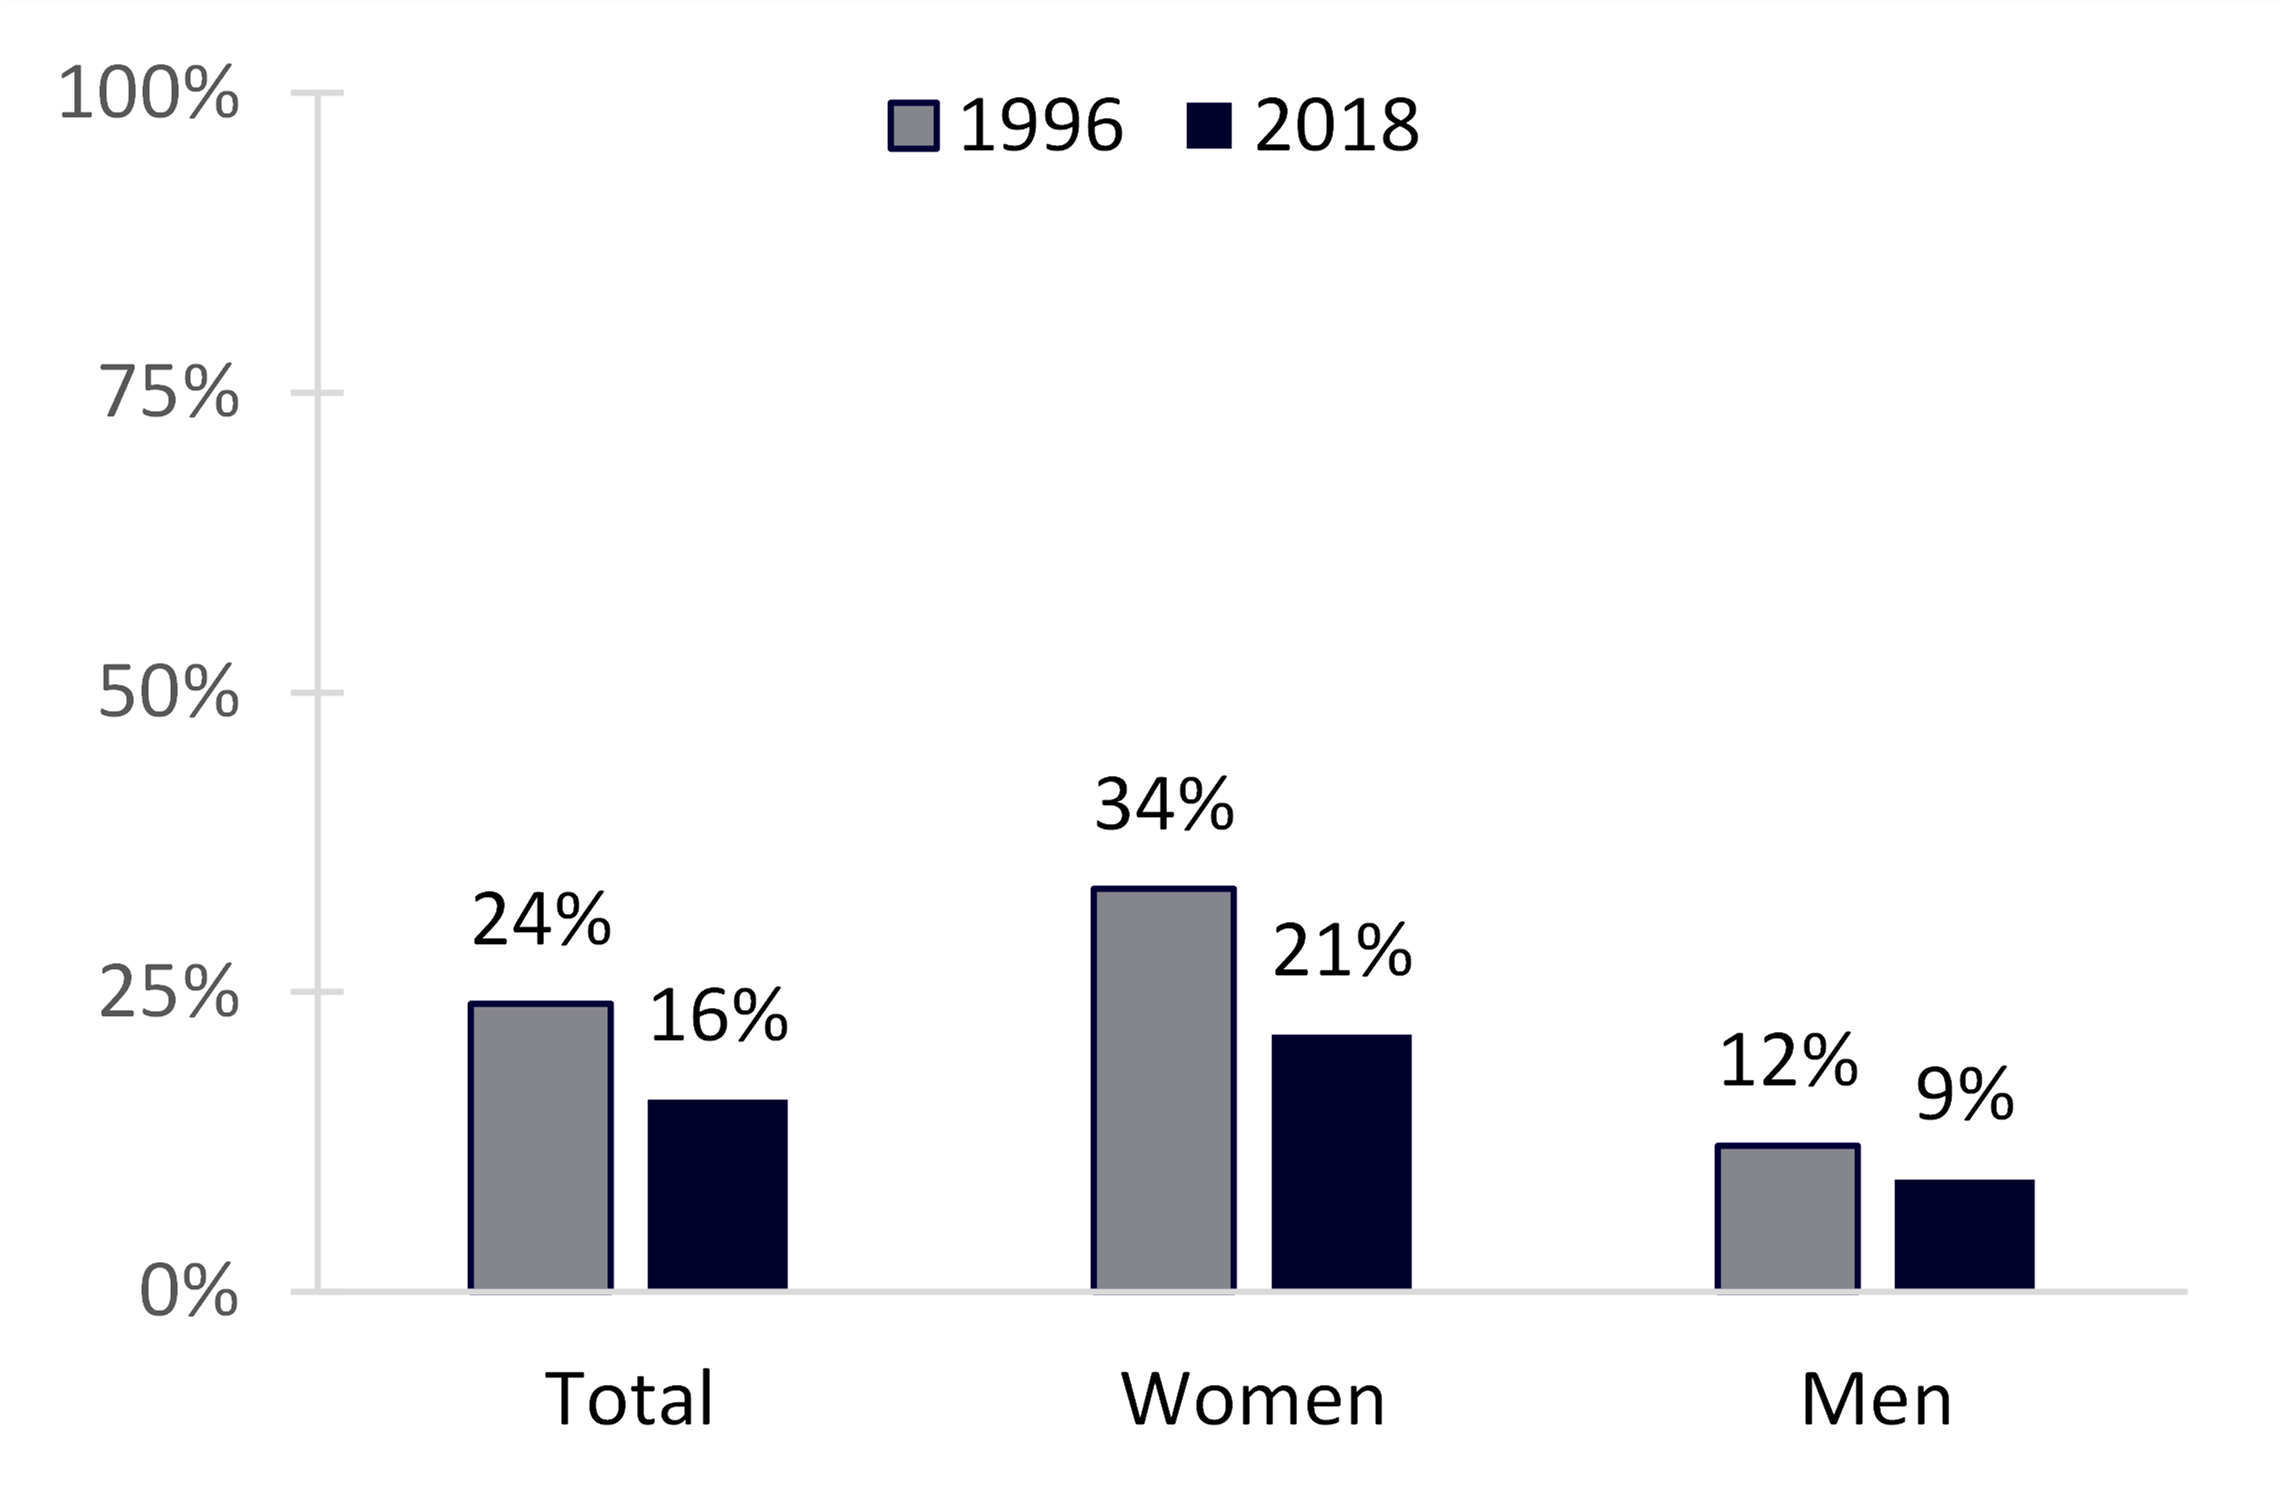
- Among all men and women, the share who had ever lost a spouse to death is smaller in 2018 compared to 1996. In 1996, nearly 25% of those aged 50 and older had experienced the death of a spouse. By 2018, this figure had dropped to 16%.
- The prevalence of widowhood dropped more for women (over one-third) than men (one-quarter).
- Widowhood was disproportionately experienced by women, regardless of time period. In 2018, the share of women (21%) who had lost a spouse was more than twice that of men (9%).
Figure 4. Percentage Ever Widowed Among Ever Married Individuals Aged 50 and Older by Gender, 1996 & 2018

Data Sources
U.S. Census Bureau, Survey of Income and Program Participation, 2018 Panel, Wave 1. https://www.census.gov/programs-surveys/sipp/data/datasets/2018-data/2018.html
References
Carlson, L. (2020). Marriage in the U.S.: Twenty-five years of change, 1995-2020. Family Profiles, FP-20-29. Bowling Green, OH: National Center for Family & Marriage Research. https://doi.org/10.25035/ncfmr/fp-20-29
Kreider. R. M. & Fields, J. M. (2001). Number, timing, and duration of marriages and divorces: Fall 1996. Current Population Reports, P70-80. U.S. Census Bureau, Washington, DC. https://www.census.gov/prod/2002pubs/p70-80.pdf
Payne, K. K. (2019). Median age at first marriage, 2019. Family Profiles, FP-21-12. Bowling Green, OH: National Center for Family & Marriage Research. https://doi.org/10.25035/ncfmr/fp-21-12
Schweizer, V. J. (2020). Marriage: More than a century of change. Family Profiles, FP-20-21. Bowling Green, OH: National Center for Family & Marriage Research. https://doi.org/10.25035/ncfmr/fp-20-21
Suggested Citation:
Payne, K. P. (2021). Marital experiences in the U.S., 1996 & 2018. Family Profiles, FP-21-24. Bowling Green, OH: National Center for Family & Marriage Research. https://doi.org/10.25035/ncfmr/fp-21-24
Updated: 11/12/2025 09:14AM


