Children’s Family Structure, 2019
Family Profile No. 25, 2019
Author: Krista K. Payne
Over the last nine years, there has been little change in minor children’s family structure (FP-17-15 & FP-13-19). This pattern of stability is consistent with prior work (Manning, Brown, & Stykes, 2014). Still, it is important to document patterns of children’s family structure over time. Using data from the 2019 March Current Population Survey, this profile updates FP-13-19 by documenting the family structure of minor children (under the age of 18) in the U.S. We also describe variation by race/ethnicity and state-level variation in the share of children living with two married biological parents.
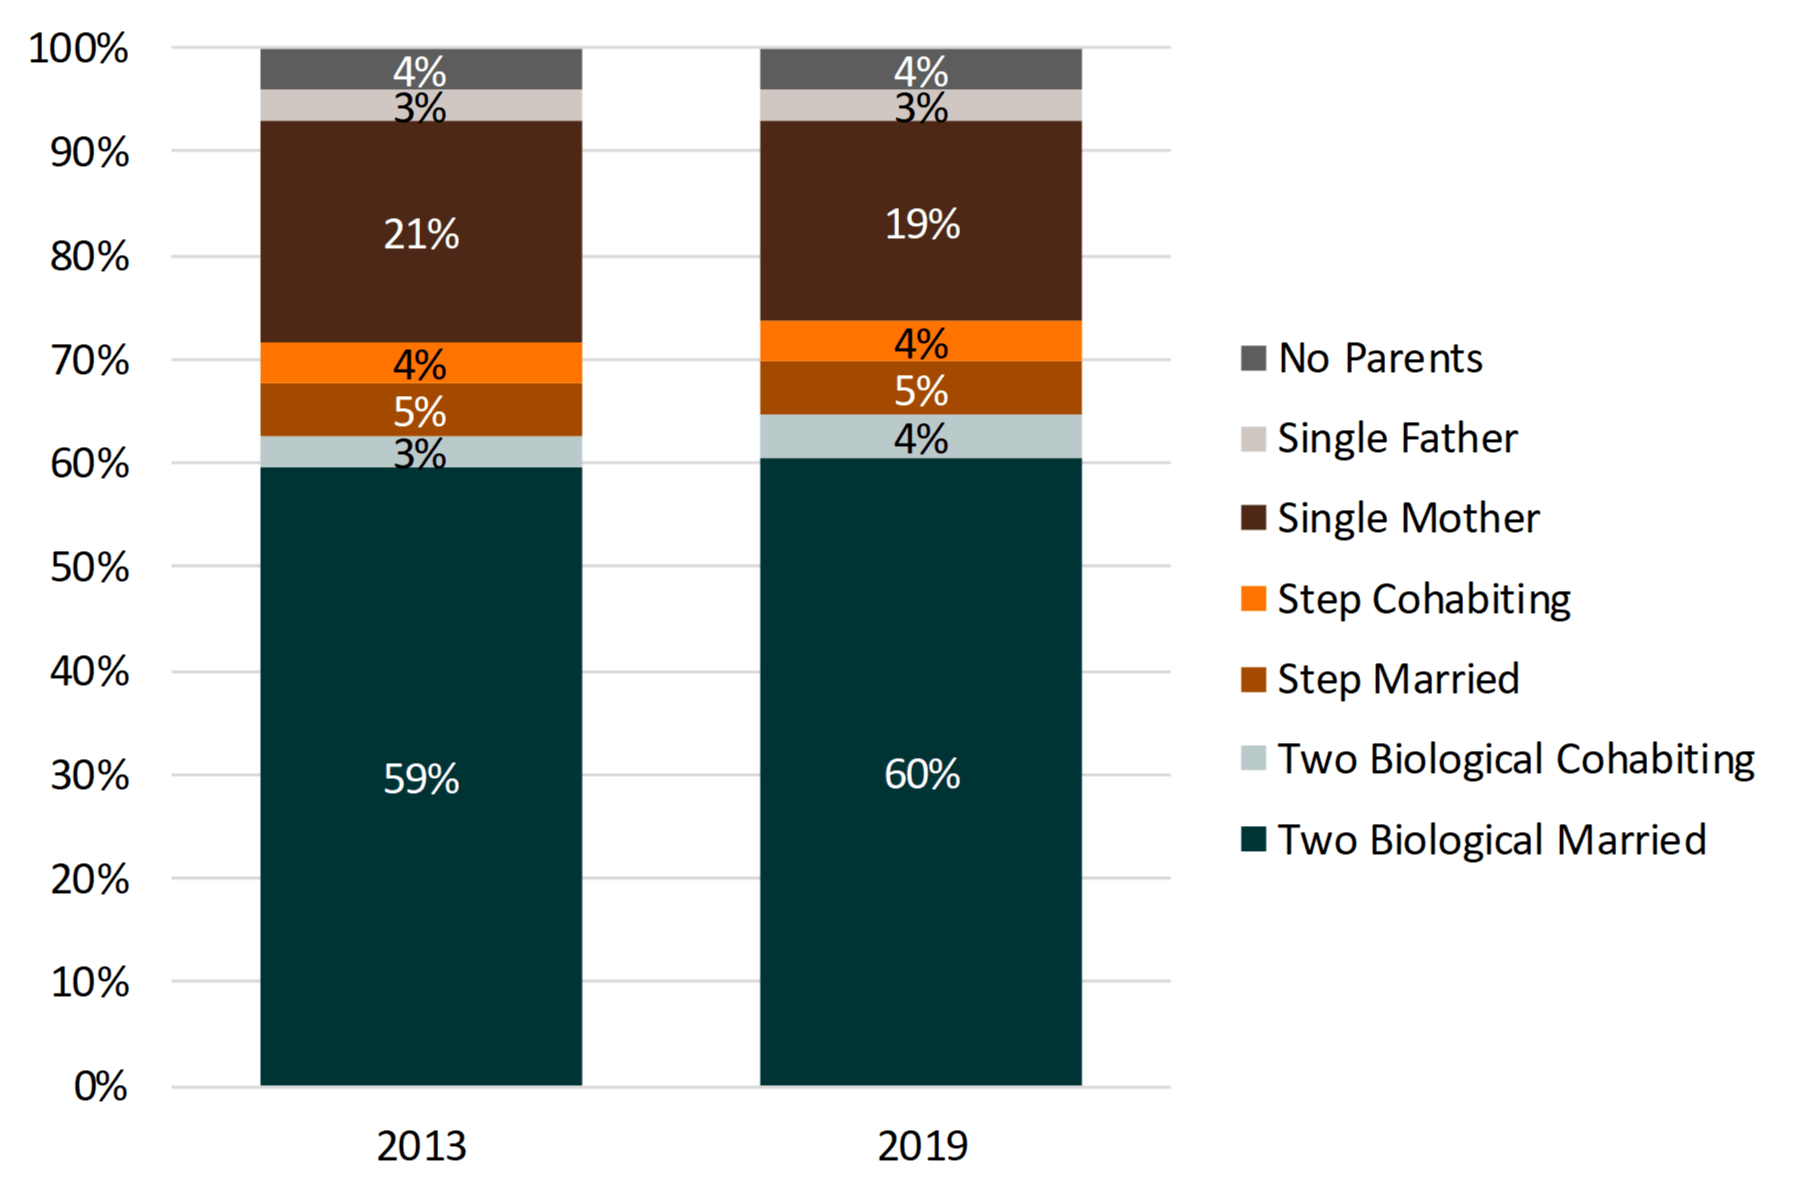
- The majority of children were living with two biological parents (64%). This percentage is slightly higher than the 62% observed in 2013 (FP-13-19).
- In 2019, among children living with two biological parents, the large majority were living with married parents rather than cohabiting parents (94% vs. 6%). In 2013, 95% were living with married parents.
- The second most common family type was single parent families (22%). This percentage is slightly lower than the 24% in 2013 (FP-13-19).
- A majority of these children were living with a single mother (86%) rather than a single father (14%). The share living with a single mother was nearly the same in 2013 at 87%.
- Nearly one-in-ten children was living in a stepfamily (9%) — the same as in 2013.
- Slightly more than half (56%) of children living in a stepfamily were living with married parents compared to 44% who were living with cohabiting parents.
Figure 1. Family Structure of Minor Children, 2013 & 2019

Source: NCFMR analyses of the March Current Population Survey; U.S. Census Bureau, 2013 & 2019
Children’s Family Structure by Race/Ethnicity, 2019
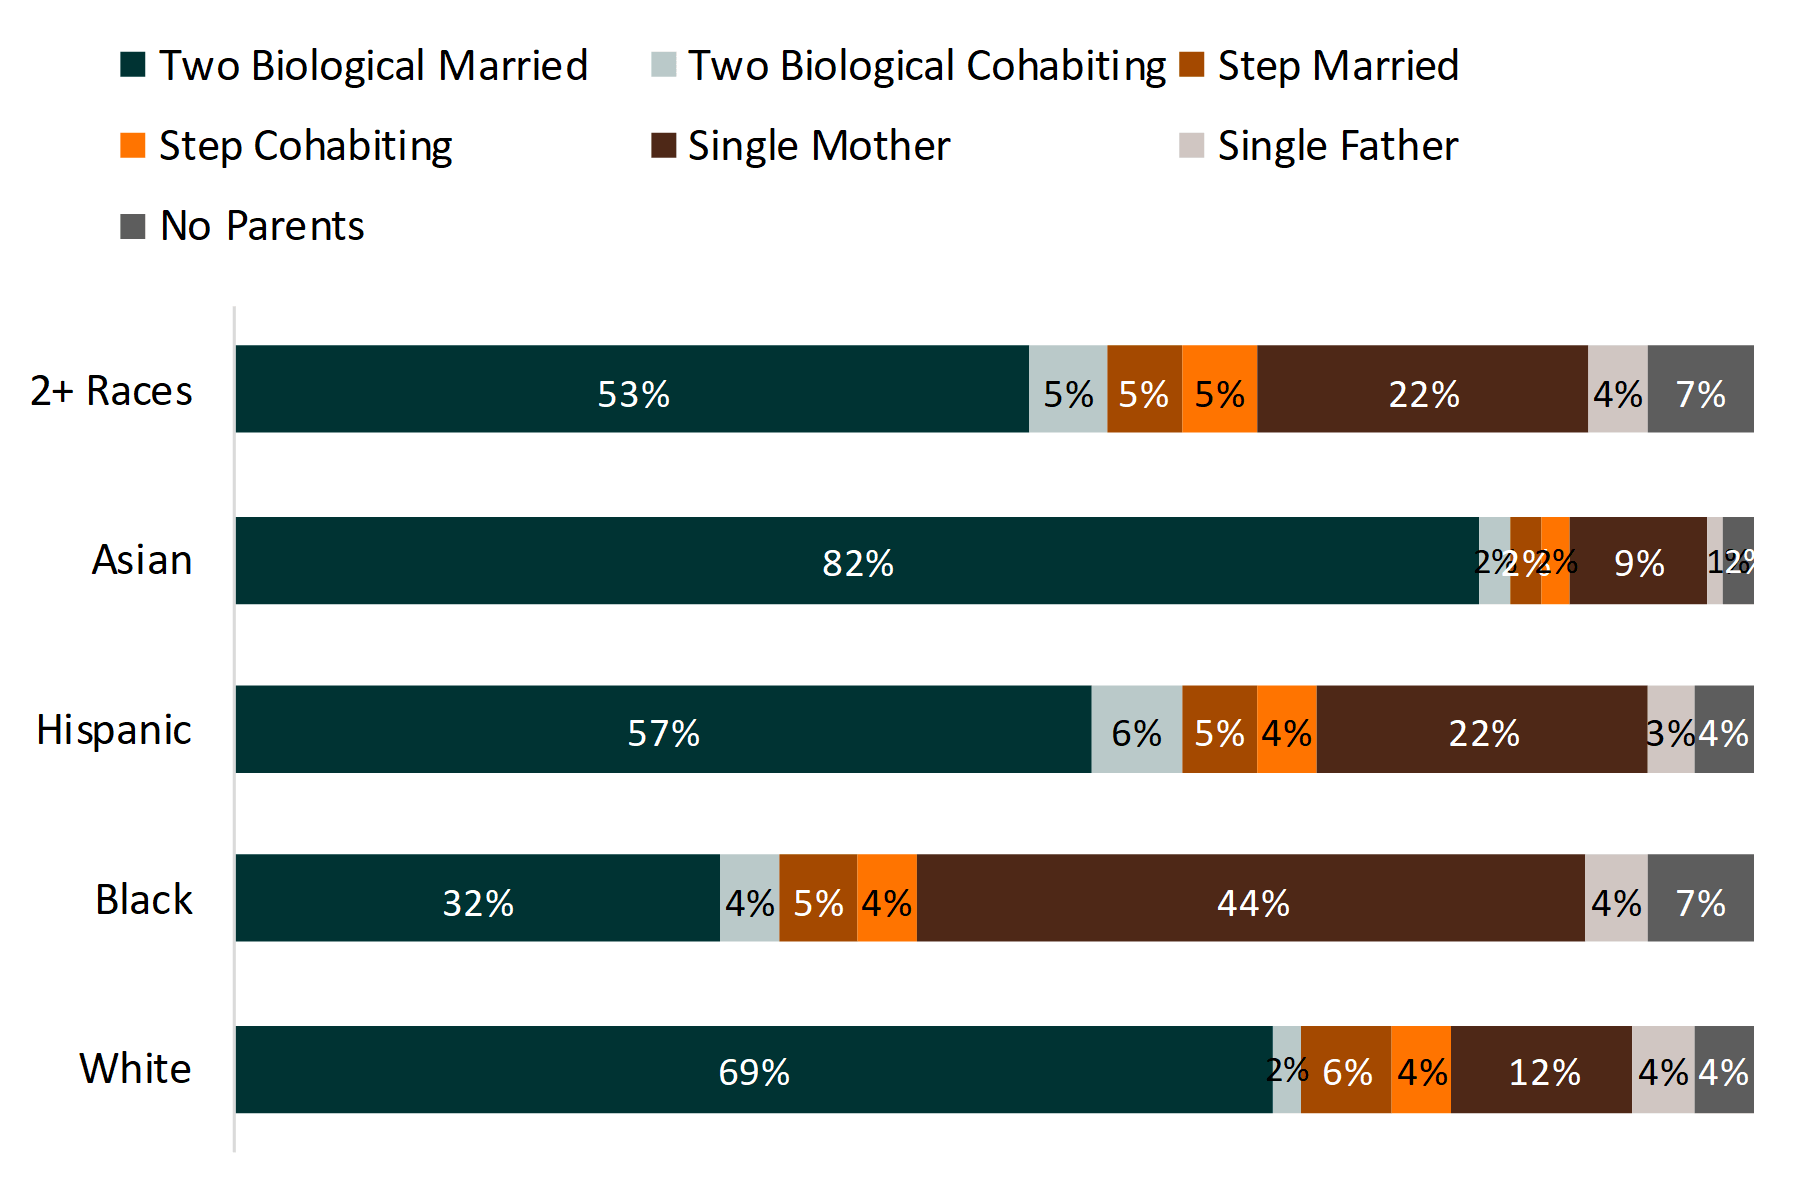
- Two biological parent families were most common among Asian children (84%) followed by White children (71%). Black children were the least likely to live with two biological parents (36%).
- Cohabiting parent families were most common among Hispanic and 2+ Races children (10%).
- Single mother families were most prevalent among Black children—44% were living with a single mother followed by 22% of Hispanic and 22% of 2+ Races children.
Figure 2. Family Structure of Minor Children by Race/Ethnicity, 2019

Source: NCFMR analyses of the March Current Population Survey; U.S. Census Bureau, 2019
Geographic Variation in the Percentage of Children Living with Two Married Biological Parents
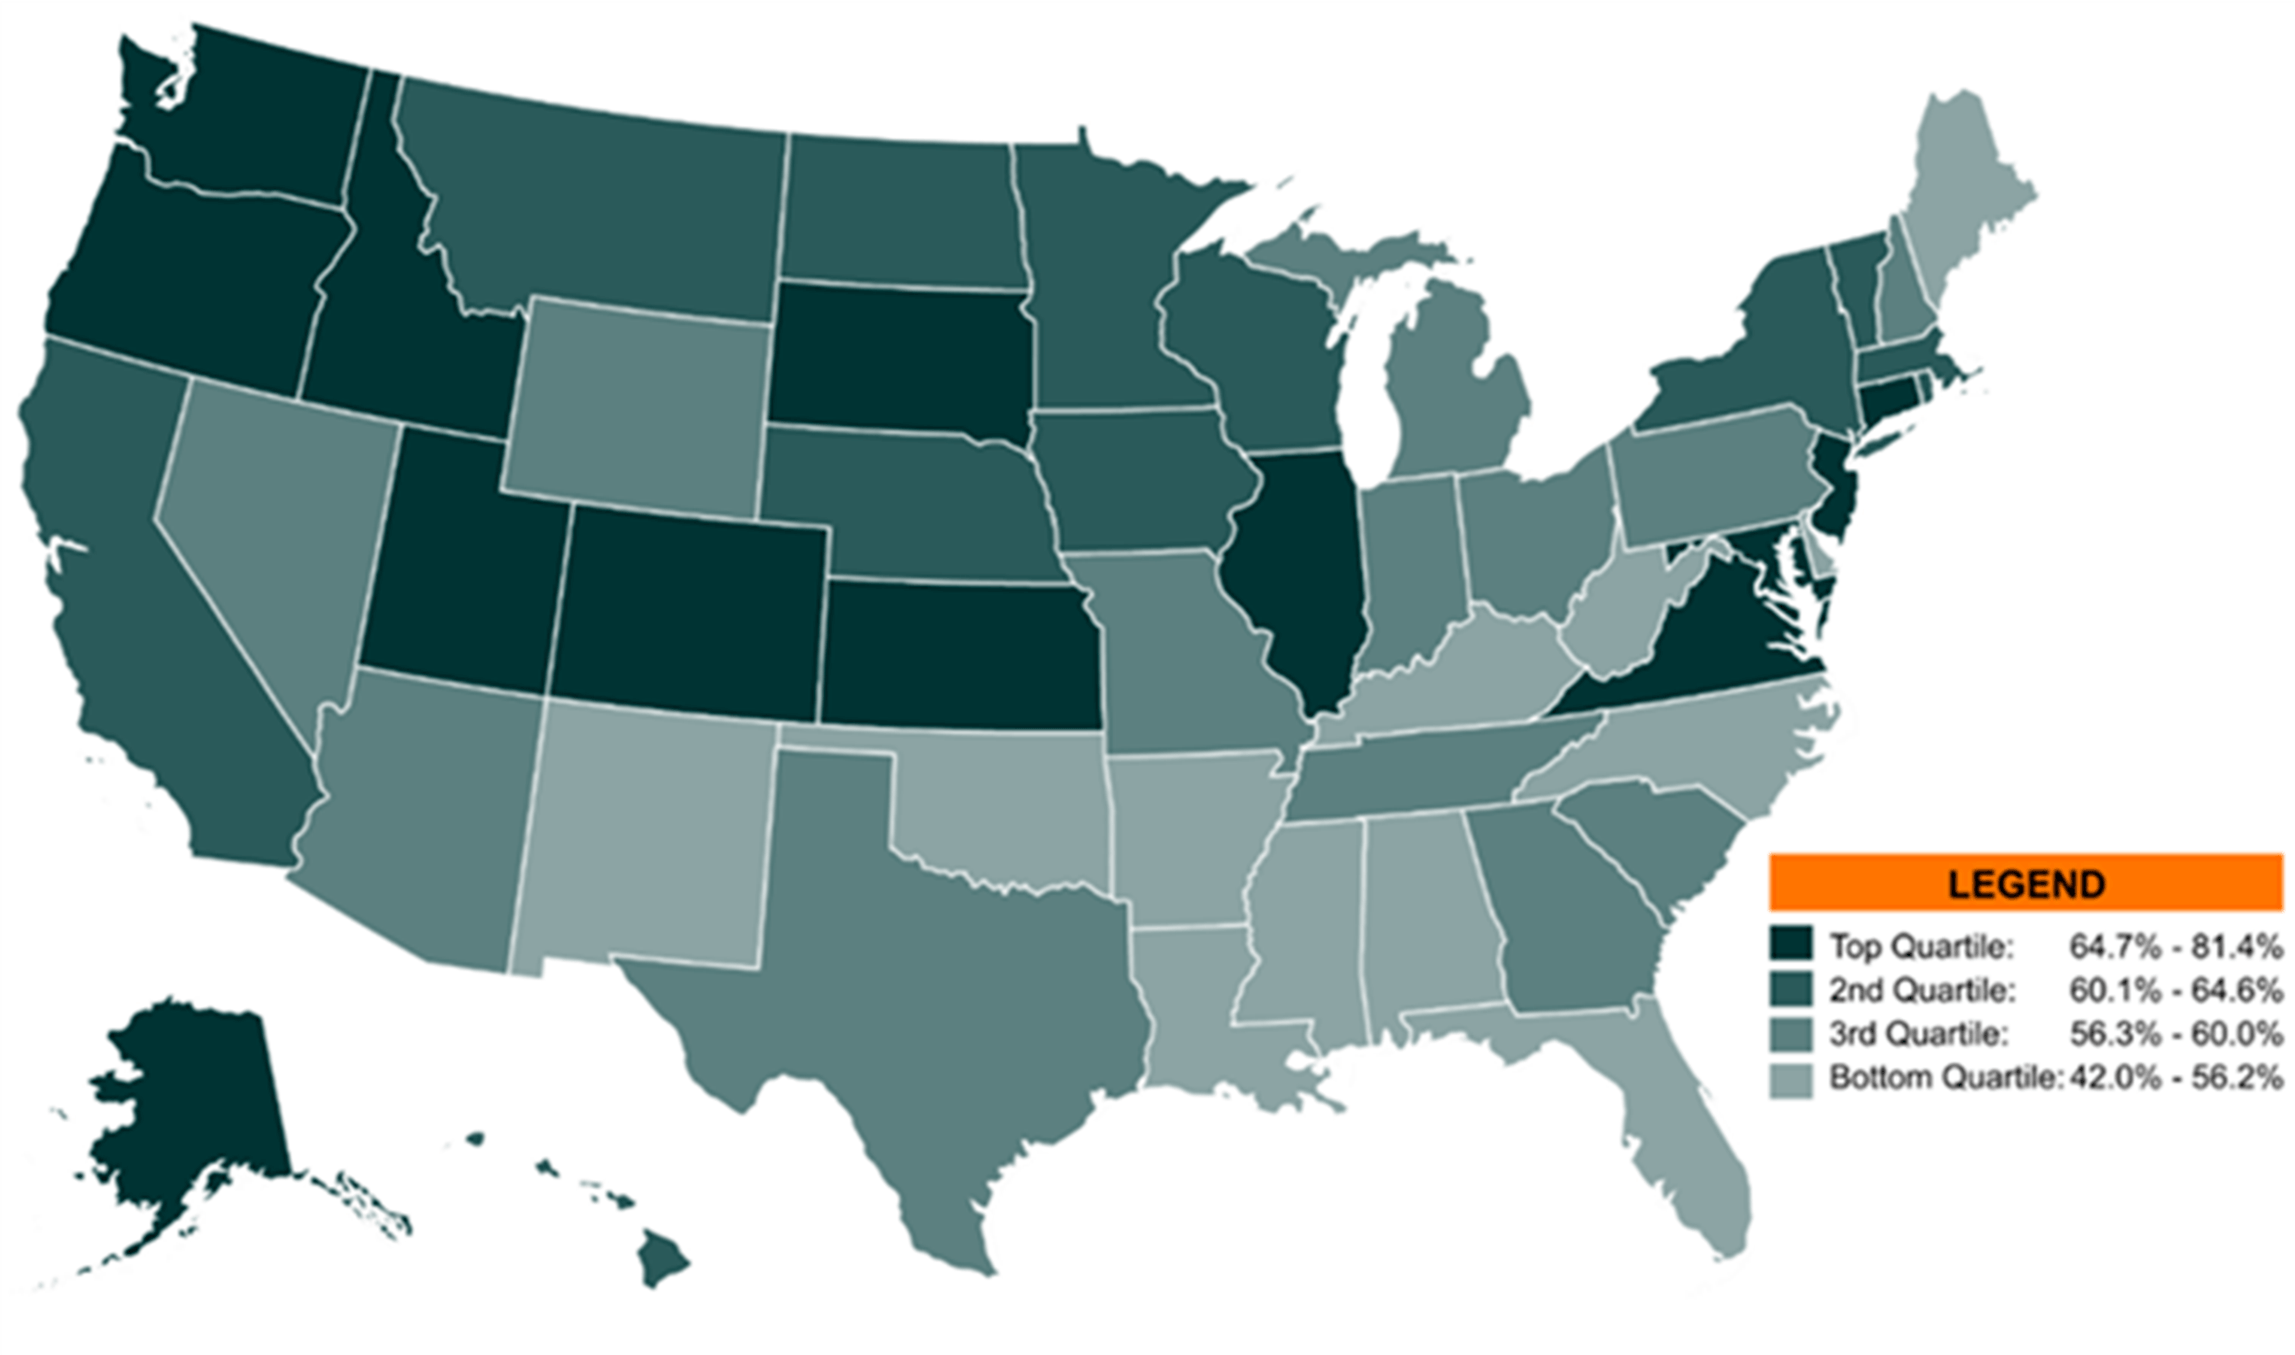
Figure 3. Geographic Variation in the Percentage of Children living with Two Biological Married Parents, 2019

Source: NCFMR analyses of the March Current Population Survey; U.S. Census Bureau, 2019
- Wide variation exists in the share of children living with two married biological parents, ranging from 42% in Mississippi to 81% in Utah. Half of the states (including Washington, D.C.) had at least 60% of children living with two married biological parents.
- Similar to 2013, states with the largest share of children living with two married biological parents (top 25%) were predominately located in the Western region of the U.S. (Utah, Colorado, Oregon, Washington, Idaho, and Alaska).
- Utah was the only state to be in the top five in both 2013 and 2019, taking the number one spot in both years.
- Also similar to 2013, states with the smallest share of children living with two married biological parents (bottom 25%) were located in the Southern region of the U.S. (Oklahoma, North Carolina, Arkansas, Kentucky, Delaware, Florida, D.C., West Virginia, Louisiana, Alabama, and Mississippi).
References:
- Eickmeyer, K. J. (2017). American children’s family structure: Two biological parent families. Family Profiles, FP-17-15. Bowling Green, OH: National Center for Family & Marriage Research. https://www.bgsu.edu/ncfmr/resources/data/family-profiles/eickmeyer-two-biological-parent-families-fp-17-15.html
- Manning, W. D., Brown, S. L., & Stykes, J. B. (2014). Family complexity among children in the United States. The ANNALS of the American Academy of Political and Social Science, 654(1), 48-65. https://doi.org/10.1177%2F0002716214524515
- Payne, K. K. (2013). Children’s family structure, 2013. Family Profiles, FP-13-19. Bowling Green, OH: National Center for Family & Marriage Research. https://www.bgsu.edu/content/dam/BGSU/college-of-arts-and-sciences/NCFMR/documents/FP/FP-13-19.pdf.
Suggested Citation:
Payne K. K. (2019). Children’s family structure, 2019. Family Profiles, FP-19-25. Bowling Green, OH: National Center for Family & Marriage Research. https://doi.org/10.25035/ncfmr/fp-19-25.
Updated: 11/10/2025 04:41PM


