Median Age of Never Married Adults in the U.S., 1940-2020
Family Profile No. 10, 2023
Author: Francesca A. Marino
As the U.S. marriage rate has decreased over the past few decades (Schweizer, 2020), the share of those who have never married has increased, reaching 31% in 2020 (Marino, 2023a). Additionally, the median age of unmarried men and women, including those who are divorced, widowed, or never married, has increased over the past few decades (Marino, 2023b). These trends suggest the need to examine patterns among a specific subset of this growing share of Americans: adults who have yet to or may never marry. Using data from the 1940 to 1990 U.S. Decennial Census the American Community Survey 1-year estimates from 2000, 2010, and 2020, this family profile examines trends in the median age of adults (aged 18 and older) in the U.S. who reported they had not been married. We also describe differences in the median age of never married adults by gender, race and ethnicity, and educational attainment. The share of the population that was unmarried has changed according to these characteristics (Marino, 2023a), and may be a factor in driving these age patterns. Changing patterns in the median age of never married adults signal that those who marry may be doing so at later ages or that more adults are forgoing marriage.
Change in the Median Age of Never Married Women and Men from 1940-2020
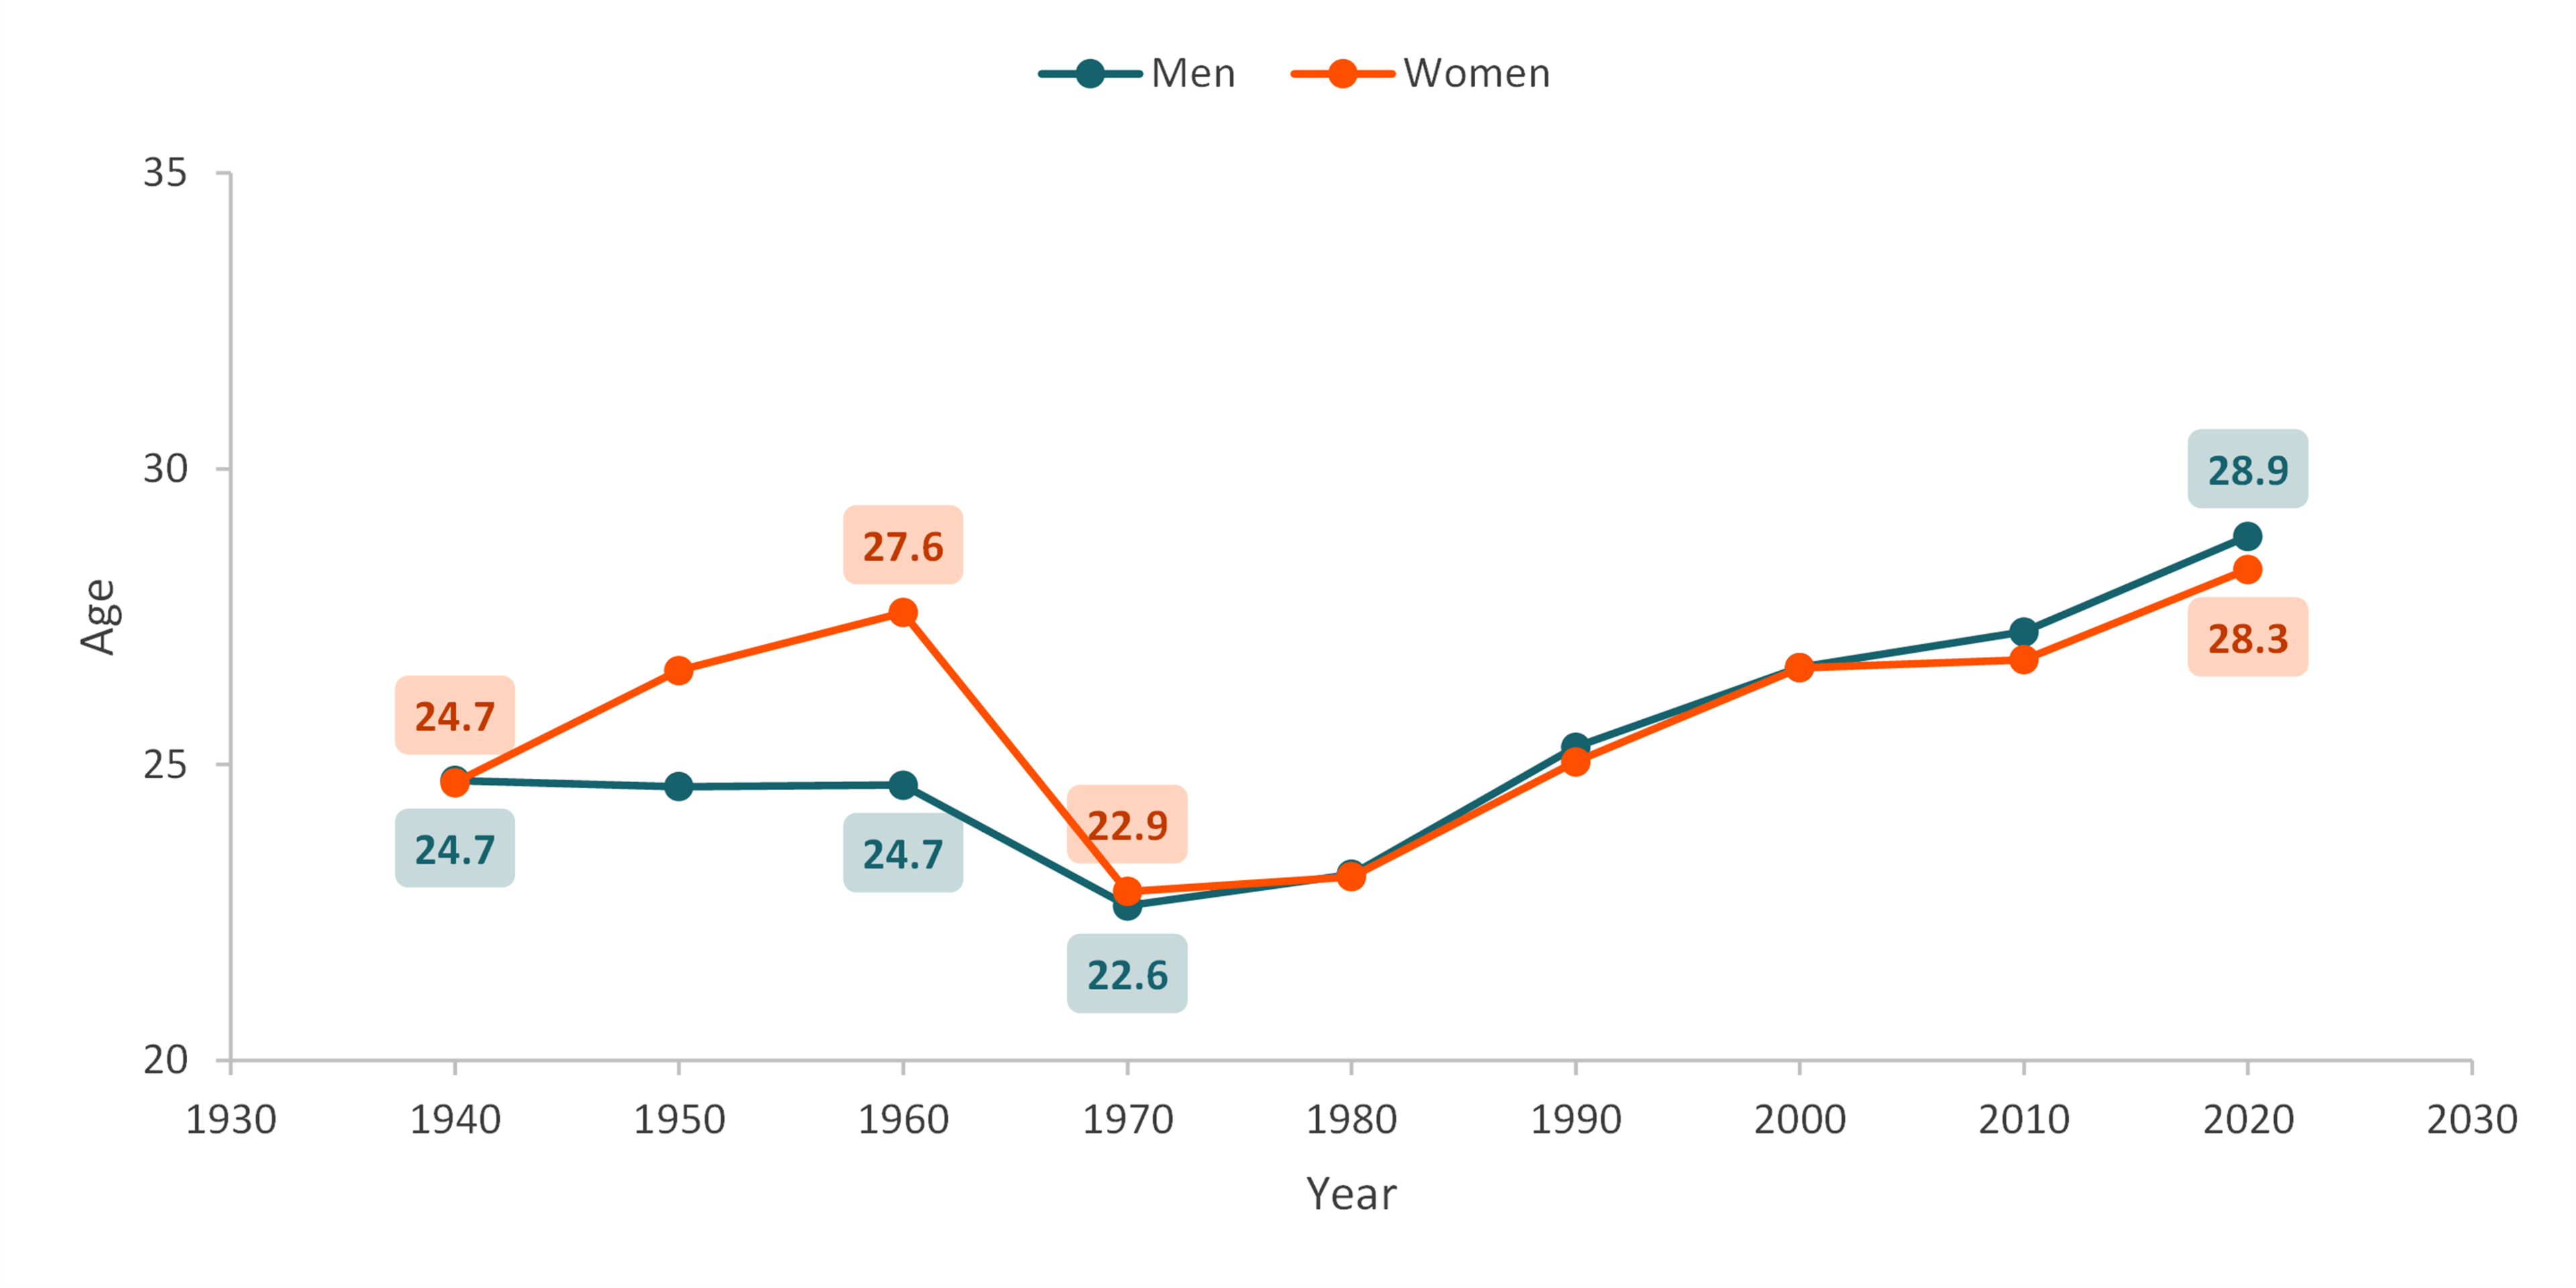
- The median ages of women and men who were never married were the same in 1940, but since diverged. Similar patterns for women and men were evident from 1970 until 2020.
- The median age of women who were never married increased by nearly 3 years from 1940 (24.7) to 1960 (27.6), followed by nearly a five-year decrease in 1970 (22.9).
- In contrast, the median age of men who were never married remained stable from 1940 (24.7) to 1960 (24.7). Like women, men experienced a decrease in the median age among those who had never married, although not as dramatic. From 1960 to 1970, the median age dropped by 2 years to a median age of 22.6.
- Since 1970, the median age of women and men who were never married has risen, reaching 28.3 among women and 28.9 among men in 2020. This trend indicates an increasingly older population of adults who have never been married in the U.S.
Figure 1. Median Age of Never Married Adults by Gender, 1940-2020

Change in the Median Age of Never Married Adults by Race and Ethnicity from 1940-2020
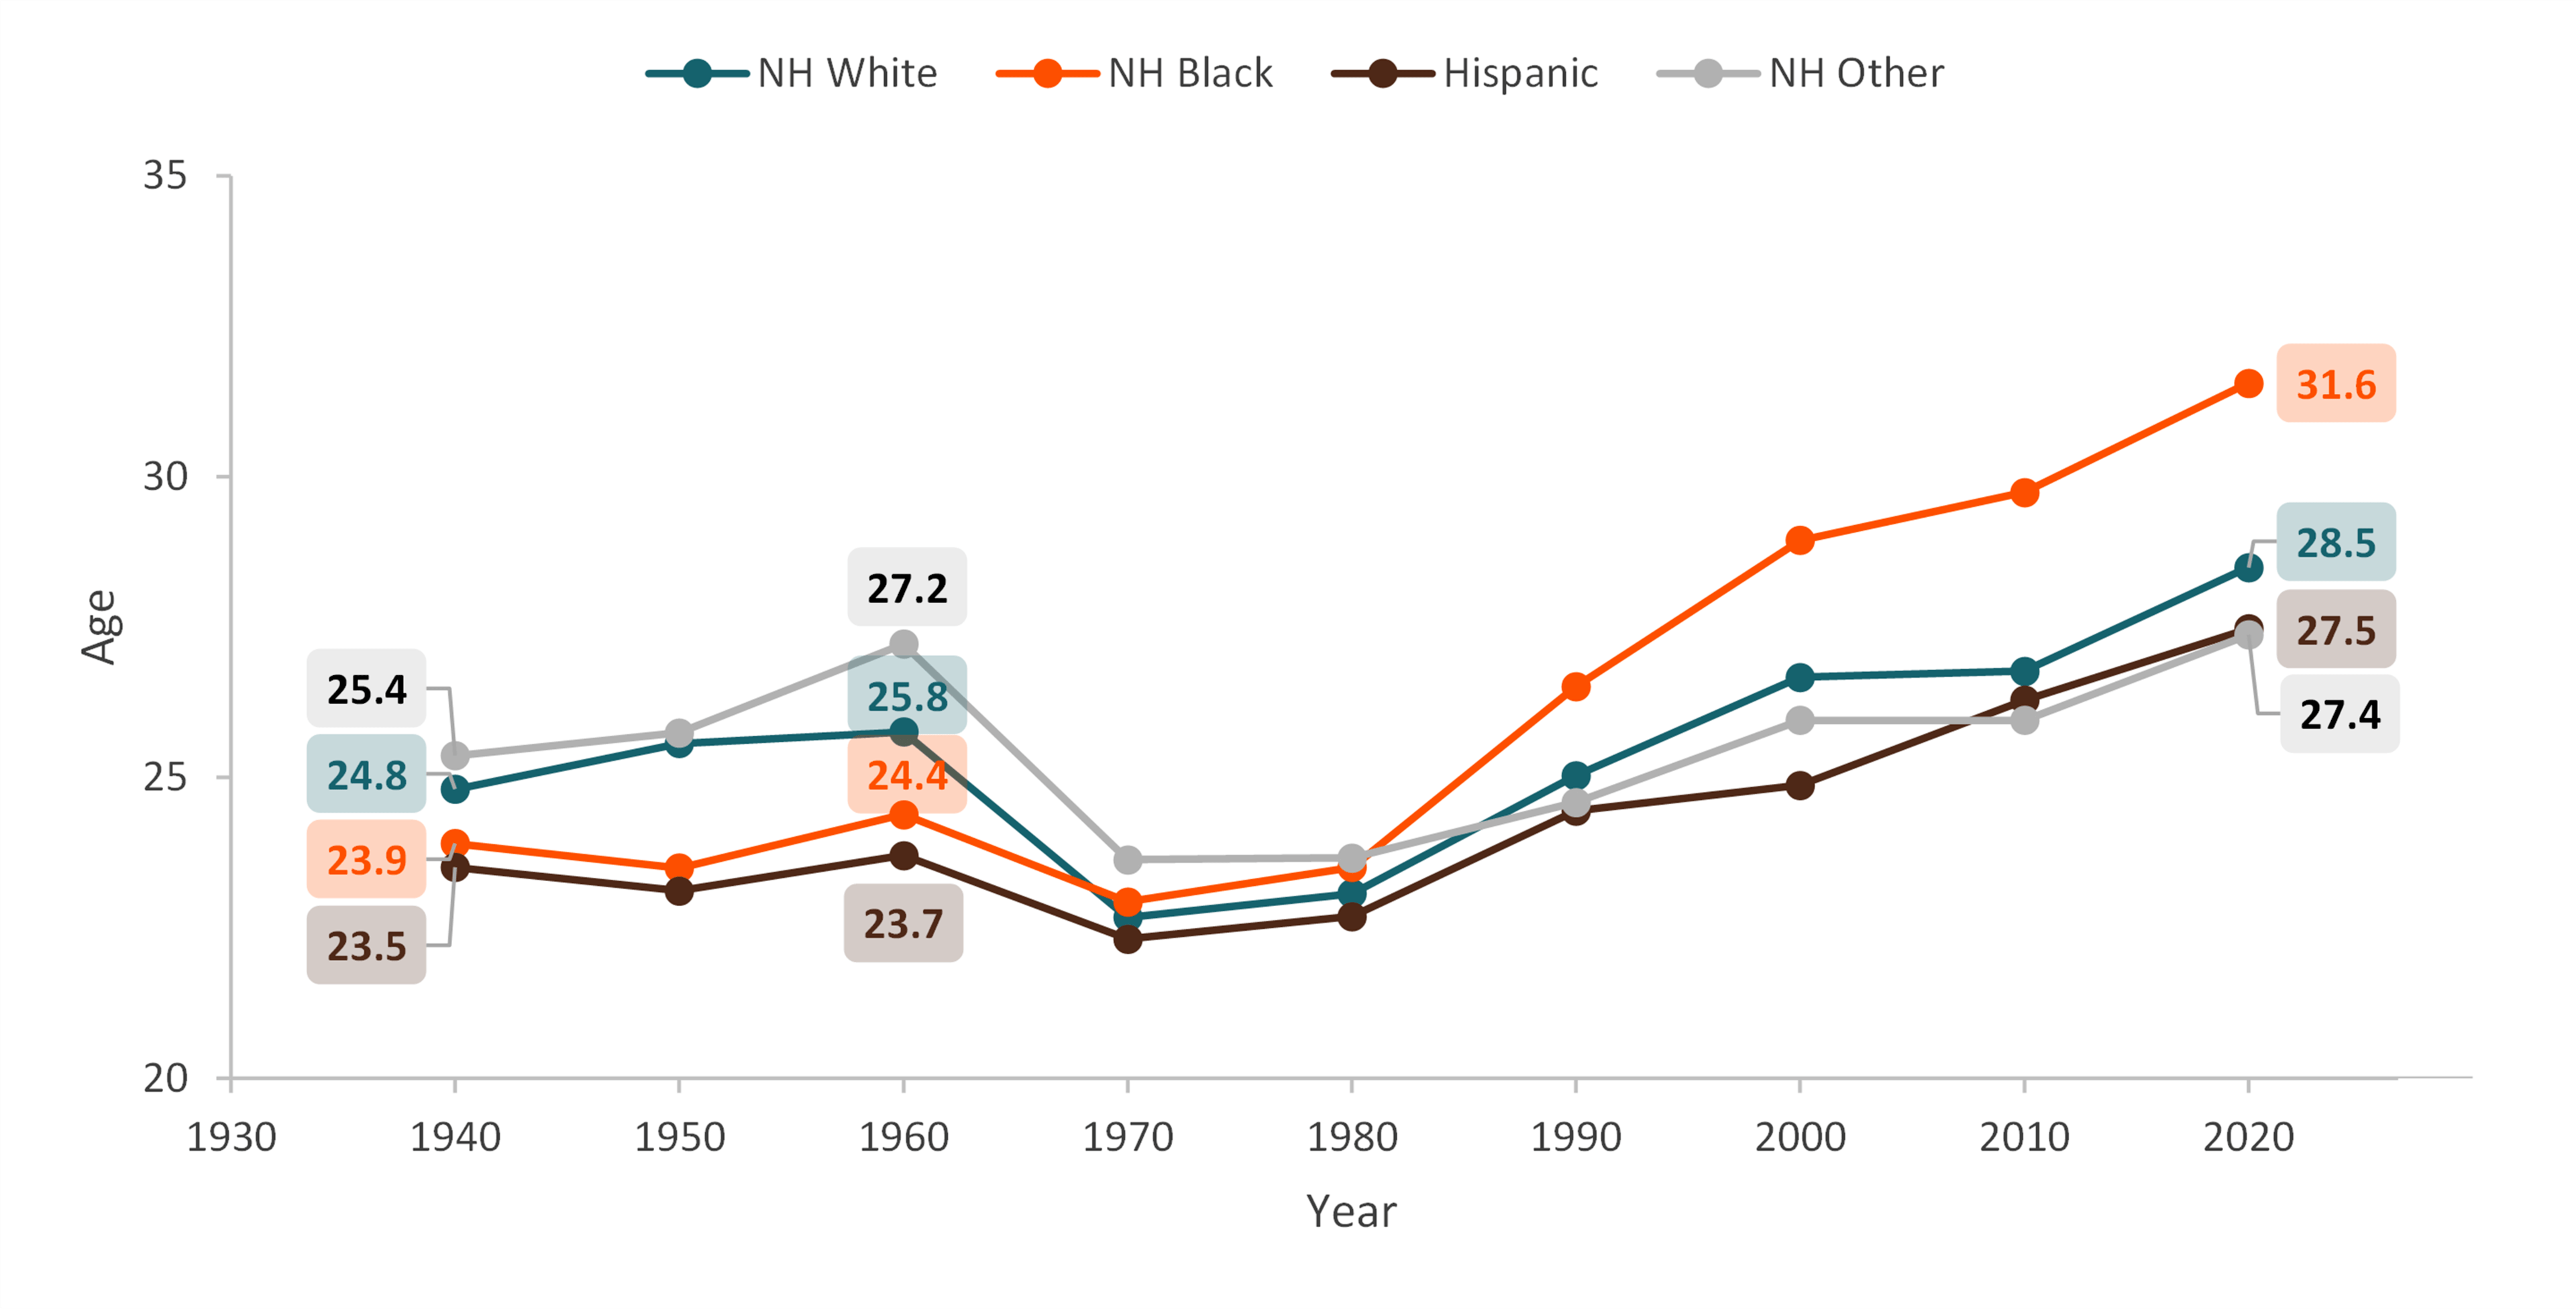
- Overall, the median age of never married adults within each racial and ethnic group fluctuated from 1940 to 1960. However, similar patterns have emerged across time.
- The median age of Non-Hispanic White adults who had never married moderately increased from 1940 (24.8) to 1960 (25.8), followed by a decrease of nearly three years in 1970 (22.7). Since 1970, the median age had increased each decade until 2020, reaching 28.5 in 2020.
- There was a slight increase in the median age among Non-Hispanic Black adults from 1940 (23.9) to 1960 (24.34), followed by a decrease of about two years in 1970. After 1970, the median age increased each decade, reaching 31.6 in 2020, the highest median age among these racial and ethnic groups.
- Hispanic adults exhibited similar patterns as Non-Hispanic White and Non-Hispanic Black adults with a slight variation in the median age until 1960, followed by a drop of one year in 1970 (22.3), and a continuous increase until 2020 (27.5).
- In 1940, Non-Hispanic Other adults had the highest median age (25.4), which was followed by a period of increase until 1960 (27.2) and nearly a decrease of nearly four years by 1970 (23.6). Since this time, the median age increased to 24.7 in 2020, the lowest among the shown racial and ethnic groups.
Figure 2. Median Age of Never Married Adults by Race & Ethnicity, 1940-2020

Change in the Median Age of Never Married Adults by Educational Attainment from 1940 to 2020
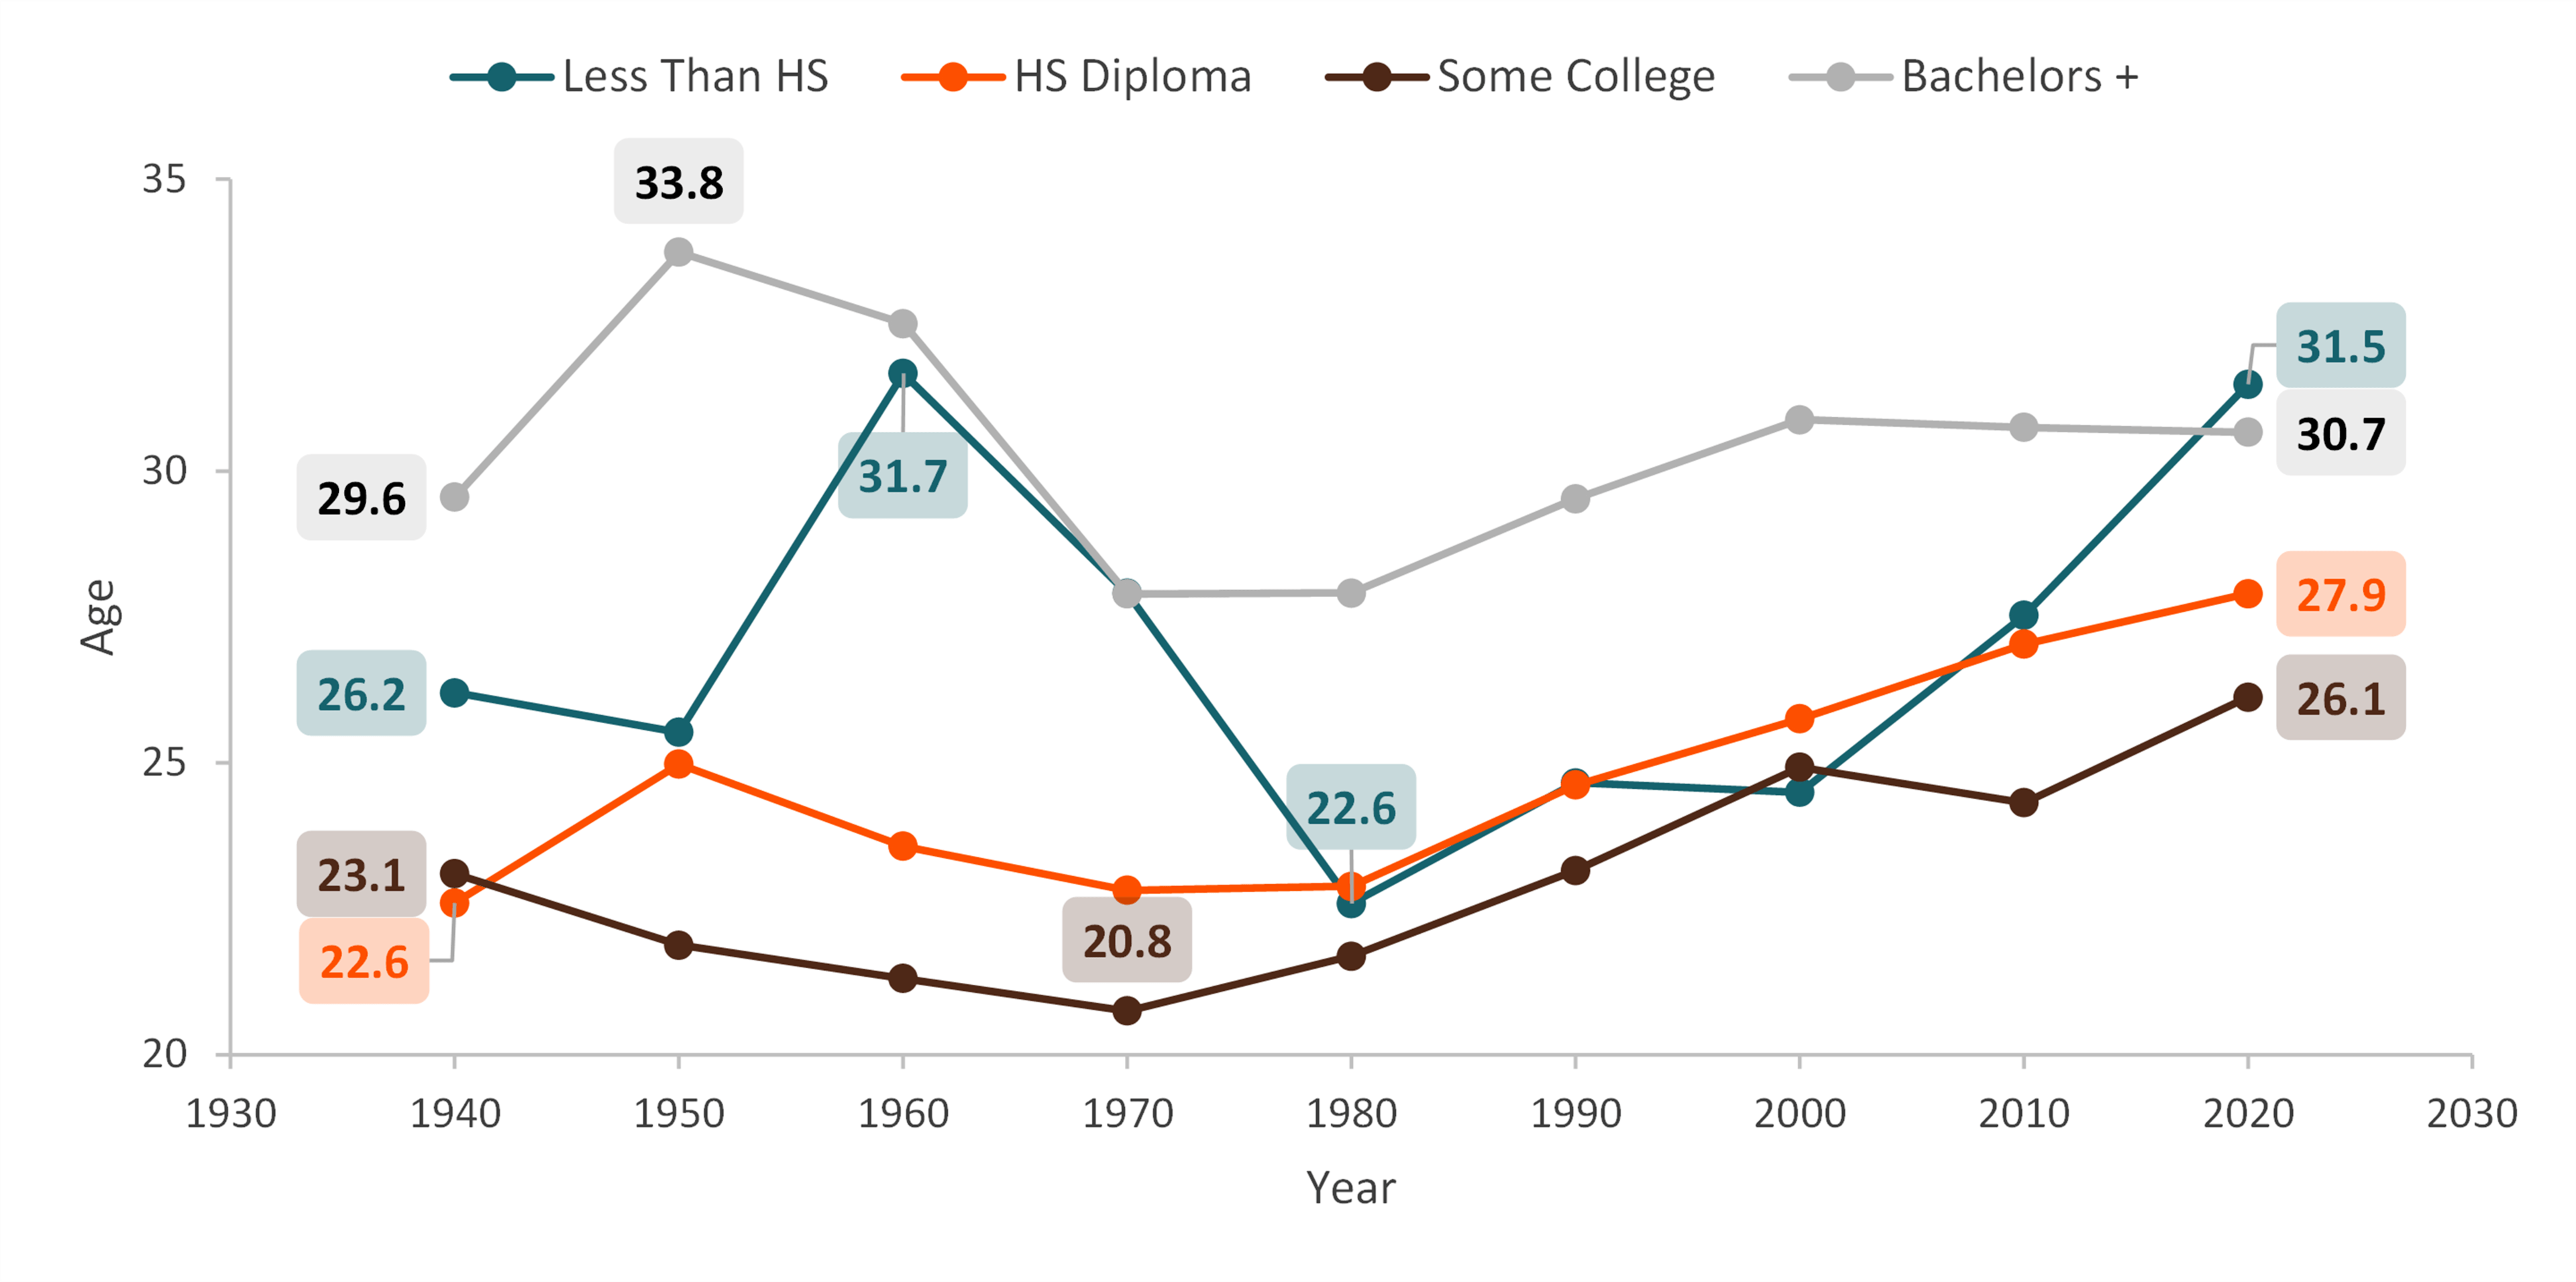
- The median ages of adults who had never married in the U.S. differed widely both within and across levels of educational attainment and in part reflect changing education patterns in the U.S.
- Never married adults who had not received a high school diploma had a median age of 26.2 in 1940, which rose to 31.7 in 1960 and was followed by a decrease of 9 years by 1980 (22.6). Since 1980, the median age increased to 31.5 by 2020, nearly what it was back in 1960.
- The median age of never married adults with a high school diploma was the lowest among all the educational attainment groups in 1940 (22.6) and increased by over five years to 27.9 in 2020.
- For those adults who had never married and attended some college, the median age decreased from 23.1 in 1940 to 20.8 in 1970, the lowest median age experienced by any adults across education levels. Since 1970, their median age has increased, but remains the lowest among the educational attainment groups examined at 26.1 in 2020.
- The median age of never married adults who had received a bachelor’s degree or higher was the highest among all levels of educational attainment in 1940 (29.6). Their median age increased to 33.8 in 1950, followed by a decline to 27.9 by 1970. Over the past two decades, the median age of never married adults with at least a bachelor’s degree has remained stable.
Figure 3. Median Age of Never Married Adults by Educational Attainment, 1940-2020

Data Source:
Ruggles, S., Flood, S., Goeken, R., Schouweiler, M., and Sobek, M. (2020). IPUMS USA: Version 12.0 [dataset]. Minneapolis, MN: IPUMS. https://doi.org/10.18128/D010.V12.0
References:
Marino, F. A. (2023a). Unmarried adulthood: More than a century of change, 1900-2020. Family Profiles, FP-23-04. National Center for Family & Marriage Research. https://doi.org/10.25035/ncfmr/fp-23-04
Marino, F. A. (2023b). Age variation in unmarried adults, 1900-2020. Family Profiles, FP-23-08. National Center for Family & Marriage Research. https://doi.org/10.25035/ncfmr/fp-23-08
Schweizer, V. J. (2020). Marriage: More than a century of change. Family Profiles, FP-20-21. Bowling Green, OH: National Center for Family & Marriage Research. https://doi.org/10.25035/ncfmr/fp-20-21
Suggested Citation:
Marino, F. A. (2023). Median age of never married adults in the U.S., 1940-2020. Family Profiles, FP-23-10. Bowling Green, OH: National Center for Family & Marriage Research. https://doi.org/10.25035/ncfmr/fp-23-10
Updated: 11/10/2025 04:31PM


