Age Variation in Cohabitation, 2022
This Family Profile is an update of :
FP-20-12
Family Profile No. 28, 2022
Author: Francesca A. Marino
Cohabitation among unmarried partners has been increasing in the United States during recent decades (Kuperberg, 2018; Reynolds & Brown, 2020), reaching about 20.1 million unmarried cohabitors in 2022 (NCFMR analysis of Current Population Survey, Annual Social and Economic Supplement 2022). The prevalence rate of unmarried older adults who cohabit has risen in the past few years (Julian, 2022). Cohabitation is a common precursor to marriage and family formation experience among young adults (Nugent & Daugherty, 2018; Reynolds & Brown, 2020). Levels of cohabitation vary across sociodemographic factors, including age, gender, educational attainment, and race and ethnicity (Nugent & Daugherty, 2018; Reynolds & Brown, 2020). Using data from the 2022 Current Population Survey (CPS), this Family Profile examines cohabitation among unmarried adults across the life course, differentiating among four age groups: 18-29, 30-39, 40-49, and 50+. We also examine age variation in cohabitation among unmarried adults according to gender, education, and race and ethnicity. This is an update of Family Profile FP-20-12, Age Variation in Cohabitation, 2018 (Reynolds & Brown, 2020).
- In 2022, about 10% of unmarried adults were in cohabiting relationships.
- About 1 in 4 unmarried adults (26%) between the ages of 30 and 39 cohabitated, the largest percentage of cohabiters across these age categories. In contrast, unmarried adults aged 50 and older had the lowest level of cohabitation at 10%.
Gender Variation in Cohabitation Across Age Groups
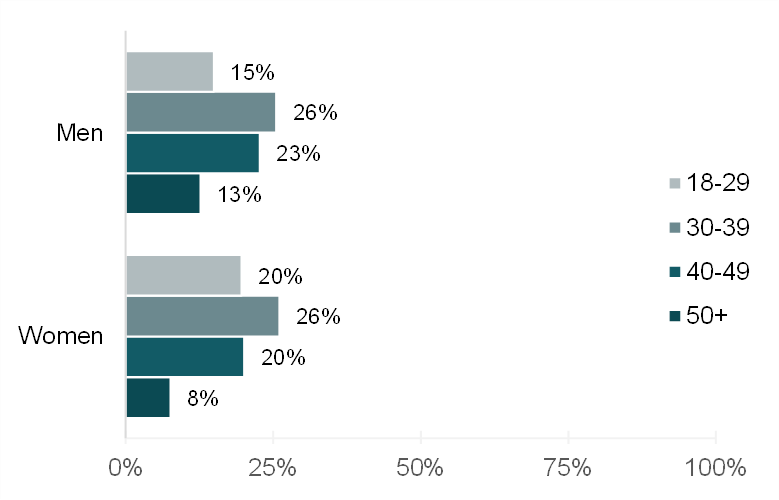
- Regardless of gender, cohabitation was most prevalent among individuals aged 30 to 39, with about 1 in 4 women (26%) and men (26%) reporting they were living with a cohabiting partner.
- Among women, the lowest prevalence of cohabitation was among those in the oldest age group (50 and older), with only 8% reporting they cohabited with an unmarried partner. Similarly, the lowest prevalence for men was among the oldest age group, with 13% reporting a cohabiting partner.
- Among those between ages 30 and 49, women and men shared similar levels of cohabitation.
Figure 1. Share of Unmarried Individuals Cohabiting, by Gender and Age Group, 2022

Educational Attainment of Cohabitors at Different Ages, 2022
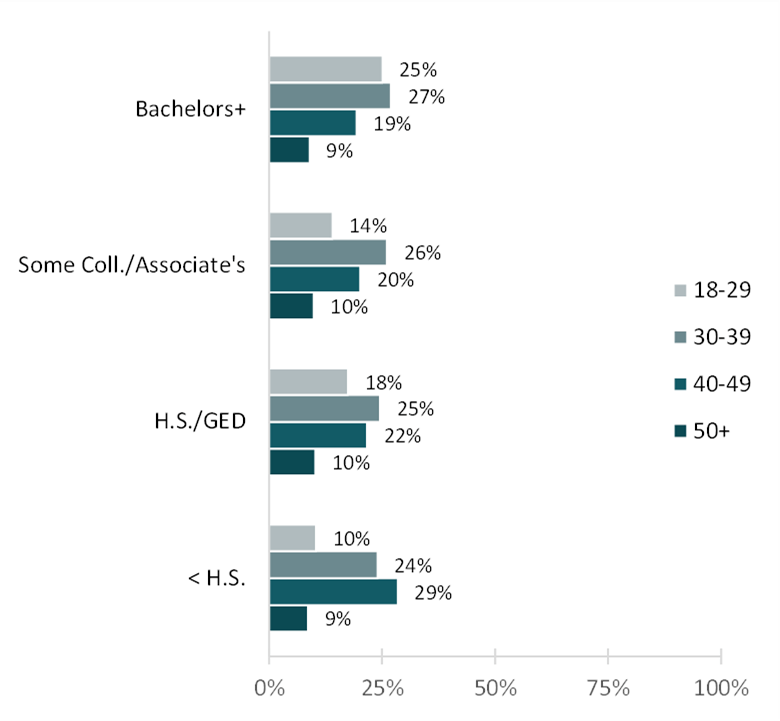
- The education differentials in cohabitation were greatest for those under age 30. One-fourth of unmarried young adults with a college degree were cohabiting in contrast to 10% who had not earned a high school degree.
- Among unmarried men and women aged 30 to 39 years old, there was no educational gradient in cohabitation.
- Unmarried adults aged 40-49 with less than a high school degree reported the highest percentage (29%) across the educational attainment levels within that age category.
- Educational differentials in cohabitation were minimal among unmarried men and women aged 50 and older.
Figure 2. Percentage of Unmarried Individuals Cohabiting, by Education and Age Group, 2022

Racial and Ethnic Differences in Cohabitation, 2022
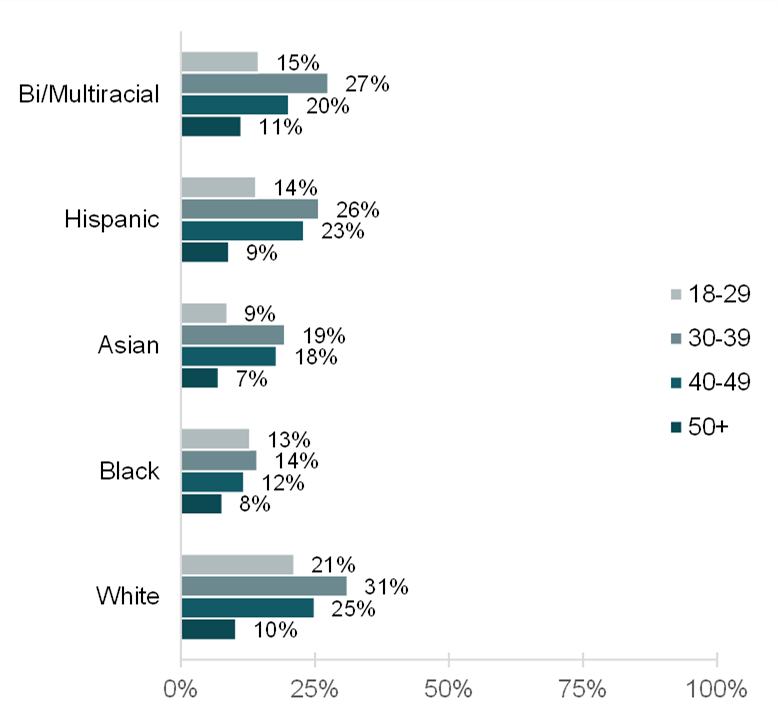
- Among unmarried adults ages 18 to 29, the share of cohabiting ranged from 9% (among Asians) to 21% (among Whites). Bi/Multiracial adults in this age category had the second highest prevalence of cohabitation (15%), followed by Hispanics (14%) and Blacks (13%).
- The share of unmarried 30-39 year old adults cohabiting ranged from 14% (among Blacks) to 31% (among Whites). Unmarried adults ages 30-39 had the highest prevalence of cohabitation.
- For those aged 40 to 49, the share of unmarried adults cohabiting ranged from 12% (among Blacks) to 25% (among Whites). White adults aged 40-49 had the highest prevalence of unmarried cohabitation among this age group, followed by Hispanics (23%), Bi/Multiracial (20%), and Asians (18%).
- The racial and ethnic differentials in cohabitation were smallest among those over age 50. The levels ranged from 7% (among Asians) to 11% (among Bi/Multiracial).
Figure 3. Percentage of Unmarried Individuals Cohabiting, by Race and Age Group, 2022

Data Source:
Flood, S., King, M., Rodgers, R., Ruggles, S., Warren, J. R., & Westberry, M. (2021). Integrated Public Use Microdata Series: Current Population Survey: Version 9.0 [dataset]. Minneapolis, MN: IPUMS. https://doi.org/10.18128/D030.V9.0
References:
Julian, C. A. (2022). Prevalence of cohabitation among unmarried older adults. Family Profiles, FP-22-10. Bowling Green, OH: National Center for Family & Marriage Research. https://doi.org/10.25035/ncfmr/fp-22-10
Kuperberg, A. (2019). Premarital cohabitation and direct marriage in the united states: 1956-2015. Marriage & Family Review, 55(5), 447-475. https://doi.org/10.1080/01494929.2018.1518820
Nugent C. N., Daugherty J. (2018). A demographic, attitudinal, and behavioral profile of cohabiting adults in the United States, 2011–2015. National Health Statistics Reports; no 111. Hyattsville, MD: National Center for Health Statistics. https://www.cdc.gov/nchs/data/nhsr/nhsr111.pdf
Reynolds, L. & Brown, S. L. (2020). Age variation in cohabitation, 2018. Family Profiles, FP-20-12. Bowling Green, OH: National Center for Family & Marriage Research. https://doi.org/10.25035/ncfmr/fp-20-12
Suggested Citation:
Marino, F. A. (2022). Age variation in cohabitation, 2022. Family Profile, FP-22-28. National Center for Family & Marriage Research. https://doi.org/10.25035/ncfmr/fp-22-28

This project is supported with assistance from Bowling Green State University. From 2007 to 2013, support was also provided by the U.S. Department of Health and Human Services, Office of the Assistant Secretary for Planning and Evaluation. The opinions and conclusions expressed herein are solely those of the author(s) and should not be construed as representing the opinions or policy of any agency of the state or federal government.
Updated: 11/18/2022 02:15PM


