Divorce Rate in the U.S.: Geographic Variation, 2022
Family Profile No. 24, 2023
Author: Jaden Loo
Figure 1. Map of State-level Adjusted Divorce Rates in the U.S., 2022
The adjusted divorce rate in the U.S. peaked in 1979 at 22.6 divorces per 1,000 married women (see Figure 1). The general trend since then has been one of decline, and analyses of divorce trends using the American Community Survey beginning in 2008 indicate successive yearly declines beginning in 2012 (Westrick-Payne, 2022a). Since the beginning of the COVID-19 pandemic in 2020, the U.S. has seen a 12% reduction in administrative counts of divorces, which are available from 35 states (Westrick-Payne, Manning, & Carlson, 2022). The ACS shows a parallel trend with a nearly 10% decline in the adjusted divorce rate from 15.5 in 2019 to 14.0 in 2020 (Westrick-Payne, 2022b). The divorce rate in 2021 remained stable at 14 divorces per 1,000 married women. Using the 2022 1-year estimate of the American Community Survey (ACS), we estimated the number of divorces and divorce rates among women aged 15 and older in the United States and show variation across states. This Family Profile is an update of previous profiles that examine the divorce rate across each state [FP-17-24; FP-18-21; FP-19-23; FP-20-25; FP-22-08, FP-22-26].
Note: Counts for Washington D.C. are excluded from this profile due to observed irregularities in divorce count estimates by sex over time in the ACS. Although estimates remained within the margin of error for the estimates, the margins of error increased dramatically in 2022.
U.S. Adjusted Divorce Rate, 2022
- The number of women who reported they divorced in the past year increased from 948,862 in 2021 (Marino, 2022) to 989,518 in 2022.
- After reaching a 40-year record low for two consecutive years (2020 and 2021 at 14.0 divorces per 1,000 married women), the divorce rate rose slightly in 2022 to 14.56 divorces per 1,000 married women.
- The overall trend in the divorce rate since 2008 remained downward despite the slight increase from 2021 to 2022. The 2022 divorce rate was below pre-pandemic levels.
Figure 2. Women’s Adjusted Divorce Rate, 1970-2022
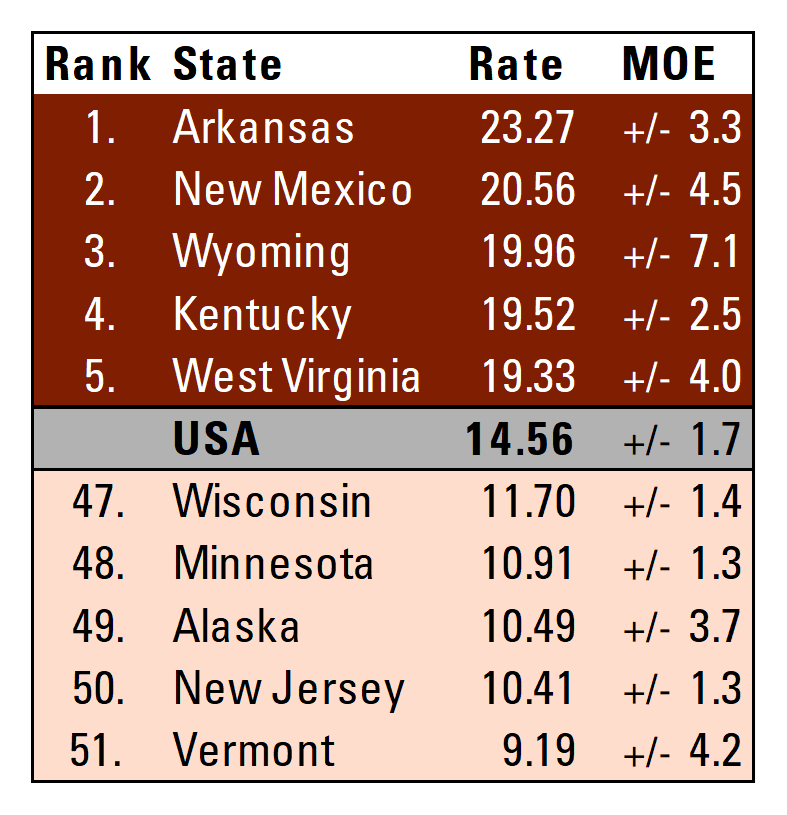
Five Highest and Lowest Divorce Rates, 2022
- Arkansas remained the state with the highest divorce rate in the US with 23.27 women divorcing per 1,000 married women in 2022. No other state in the top 5 from 2021 returned in 2022.
- New to the top five were New Mexico (20.56), Wyoming (19.96), Kentucky (19.52), and West Virginia (19.33).
- The state with the lowest divorce rate in 2021, New Hampshire, was no longer present in the bottom 5 states in 2022. Vermont reported the lowest divorce rate in the US at 9.2 divorces per 1,000 married women.
- Only one state in the bottom five in 2021 remained in the bottom five in 2022--New Jersey (10.41).
- Other low divorce rate newcomers included Wisconsin (11.70), Minnesota (10.91), and Alaska (10.49)
Figure 3. Women's Highest and Lowest Adjusted Divorce Rates, 2022

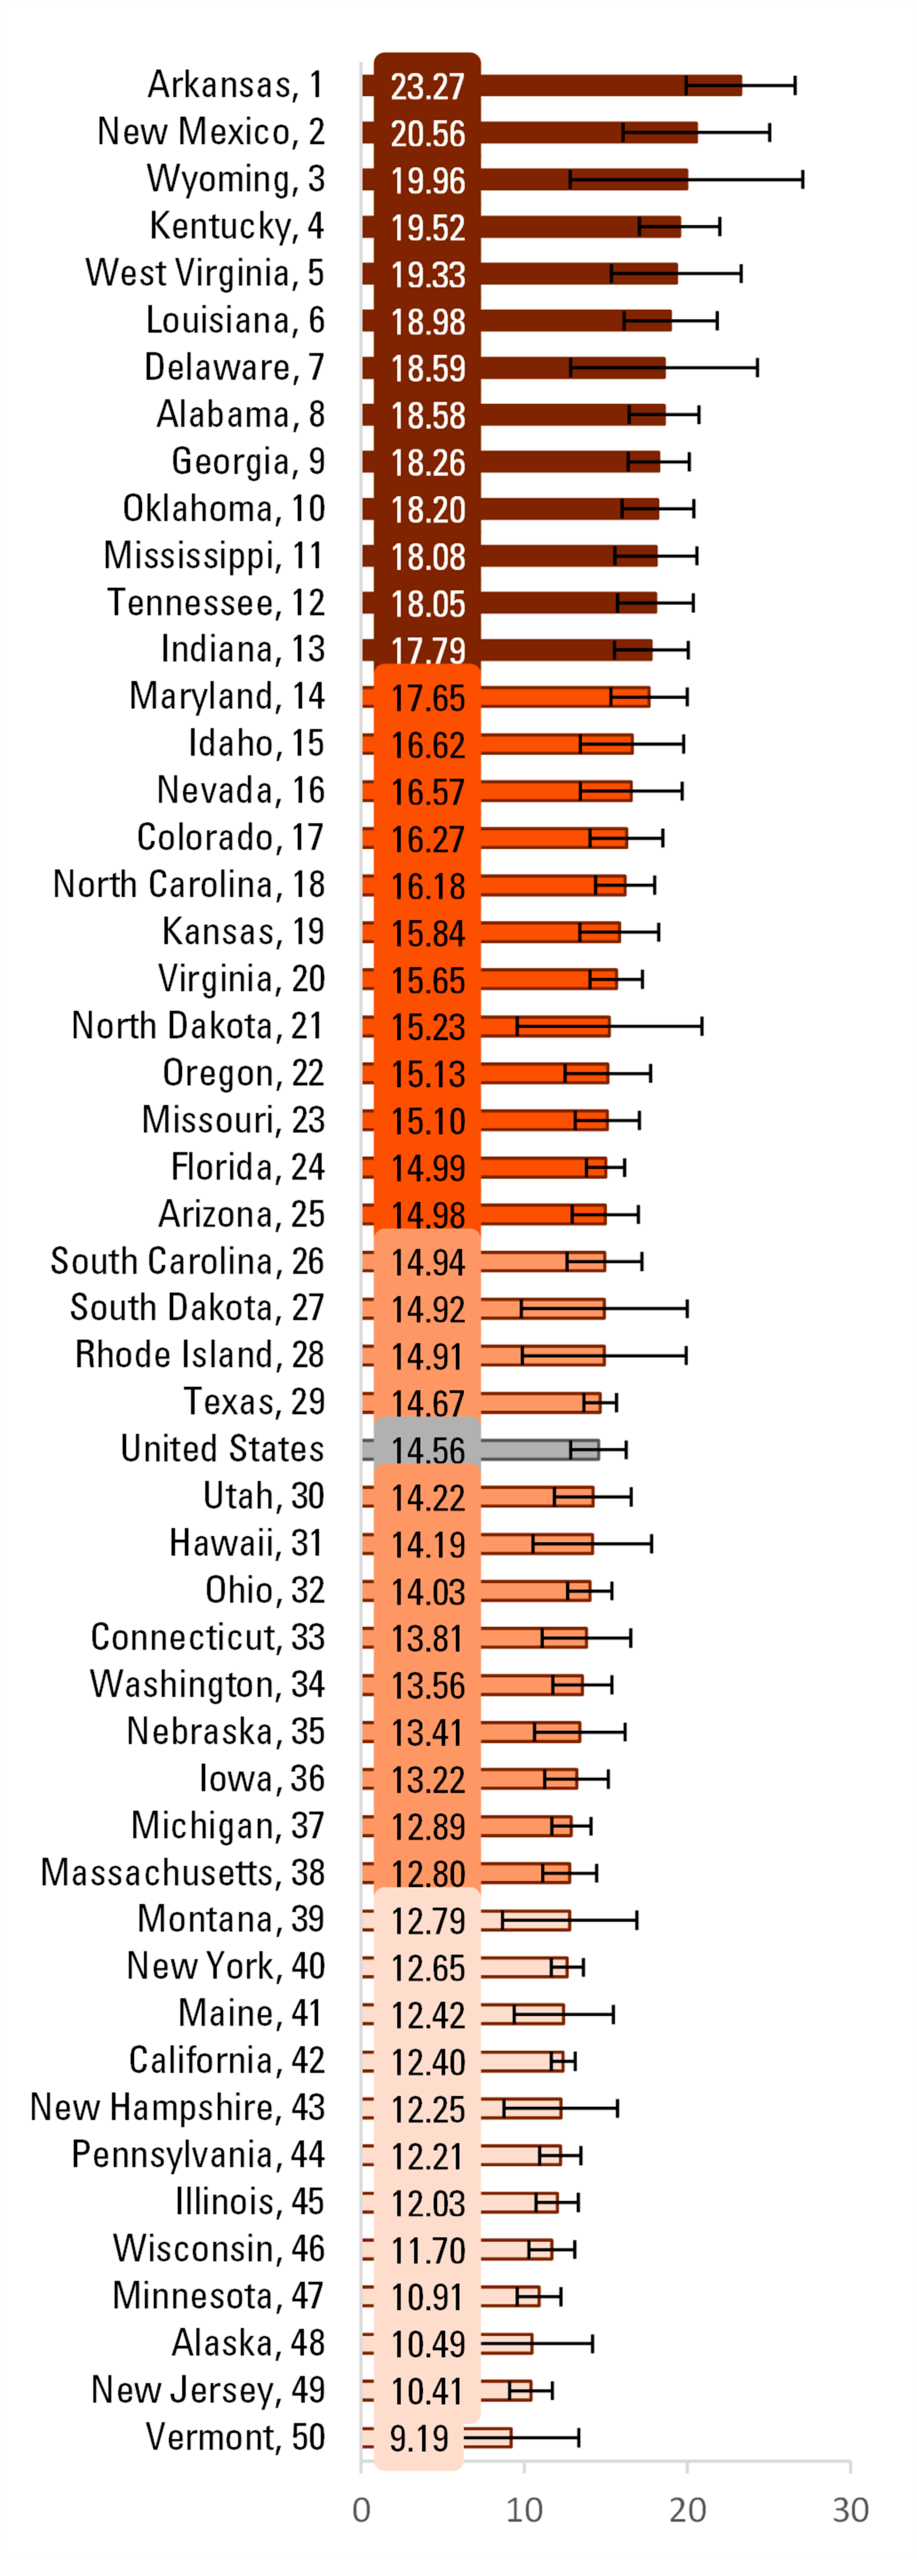
State Rankings and Geographic Variation in Divorce Rates, 2022
The 13 states in the top quartile had rates of at least 17.77 divorces per 1,000 married women in 2022.
- The 13 states in the bottom quartile had 12.82 or fewer divorces per 1,000 married women in 2022.
- The South contained 10 out of the 14 states in the top quartile for the US divorce rate, along with no states in the bottom quartile.
- The Northeast predominantly consisted of states in the bottom quartile, with no states in the third or top quartiles.
- There was variation in quartile representation in the Midwest and West regions, with each region containing at least one state in all four quartiles.
Figure 4. State-Level Women’s Adjusted Divorce Rate by Quartile, 2022

Data Sources:
Clarke. S. C. (1995). Advanced report of final marriage statistics, 1989 and 1990. Monthly Vital Statistics Report, 42(12). National Center for Health Statistics. https://www.cdc.gov/nchs/data/mvsr/mv43_12.pdf
National Center for Health Statistics (1974). Summary report final marriage statistics, 1970. Monthly Vital Statistics Report, 23(2), Supp. 1. U.S. Department of Health, Education, and Welfare. https://www.cdc.gov/nchs/data/mvsr/supp/mv23_02s1acc.pdf
National Center for Health Statistics (1977). Advance report of final divorce statistics, 1975. Monthly Vital Statistics Report, 26(2), Supp. 2. U.S. Department of Health, Education, and Welfare. https://www.cdc.gov/nchs/data/mvsr/supp/mv26_02s2acc.pdf
National Center for Health Statistics (1983). Advance report of final marriage statistics, 1980. Monthly Vital Statistics Report, 32(5), Supp. U.S. Department of Health and Human Services. https://www.cdc.gov/nchs/data/mvsr/supp/mv32_05s.pdf
National Center for Health Statistics (2001). Births, marriages, divorces, and deaths: Provisional data for January-December 2000. National Vital Statistics Report, 49(6), Associated Table 3. Department of Health & Human Services, Center for Disease Control and Prevention. https://www.cdc.gov/nchs/data/nvsr/nvsr49/nvsr49_06.pdf
U.S. Census Bureau (2019). American Community Survey, 2019 1-Year Estimates [Table B12001]. https://data.census.gov/cedsci/table?q=B12001&lastDisplayedRow=18&table=B12001&tid=ACSDT1Y2018.B12001
U.S. Census Bureau (2019). American Community Survey, 2019 1-Year Estimates [Table B12503]. https://data.census.gov/cedsci/table?q=B12503&hidePreview=false&table=B12503&tid=ACSDT1Y2018.B12503&lastDisplayedRow=10
U.S. Census Bureau (2021). American Community Survey, 2020 1-year Experimental PUMS
References:
Allred, C. (2019). Divorce rate in the U.S.: Geographic variation, 2018. Family Profiles, FP-19-23. Bowling Green, OH: National Center for Family & Marriage Research. https://doi.org/10.25035/ncfmr/fp-18-23
Hemez, P. (2017). Divorce rate in the U.S.: Geographic variation, 2016. Family Profiles, FP-17-24. Bowling Green, OH: National Center for Family & Marriage Research. https://doi.org/10.25035/ncfmr/fp-17-24
Payne, K. K. (2018). Charting marriage and divorce in the U.S.: The adjusted divorce rate. Bowling Green, OH: National Center for Family & Marriage Research. https://doi.org/10.25035/ncfmr/adr-2008-2017
Schweizer, V. (2018). Divorce rate in the U.S.: Geographic variation, 2017. Family Profiles, FP-18-21. Bowling Green, OH: National Center for Family & Marriage Research. https://doi.org/10.25035/ncfmr/fp-18-21
Reynolds, L. (2020). Divorce rate in the U.S.: Geographic variation, 2019. Family Profiles, FP-20-25. Bowling Green, OH: National Center for Family & Marriage Research. https://doi.org/10.25035/ncfmr/fp-20-25
Suggested Citation:
Loo, J. (2023). Divorce rate in the U.S.: Geographic variation, 2022. Family Profiles, FP-23-24. Bowling Green, OH: National Center for Family & Marriage Research. https://doi.org/10.25035/ncfmr/fp-23-24
Updated: 11/07/2025 04:45PM

