Characteristics of Single Adults in the U.S., 2021
Family Profile No. 30, 2022
Author: Gabrielle Juteau
Postponement of first marriage (Julian, 2022), the high prevalence of divorce (Carlson, 2022), and declining levels of remarriage (Reynolds, 2022) are linked to higher likelihoods of experiencing singlehood throughout one’s life course (Hemez, 2019). This Family Profile examines sociodemographic variation among single adults aged 18 and older in 2022 using data from the 2022 ASEC Current Population Survey from IPUMS-CPS. Singlehood is defined as not currently being married or cohabiting. We differentiate singles by marital status: never married, widowed, and divorced/separated.
- Among adults aged 18 and older, two out five (40%) were single in 2022.
Single Adults by Age
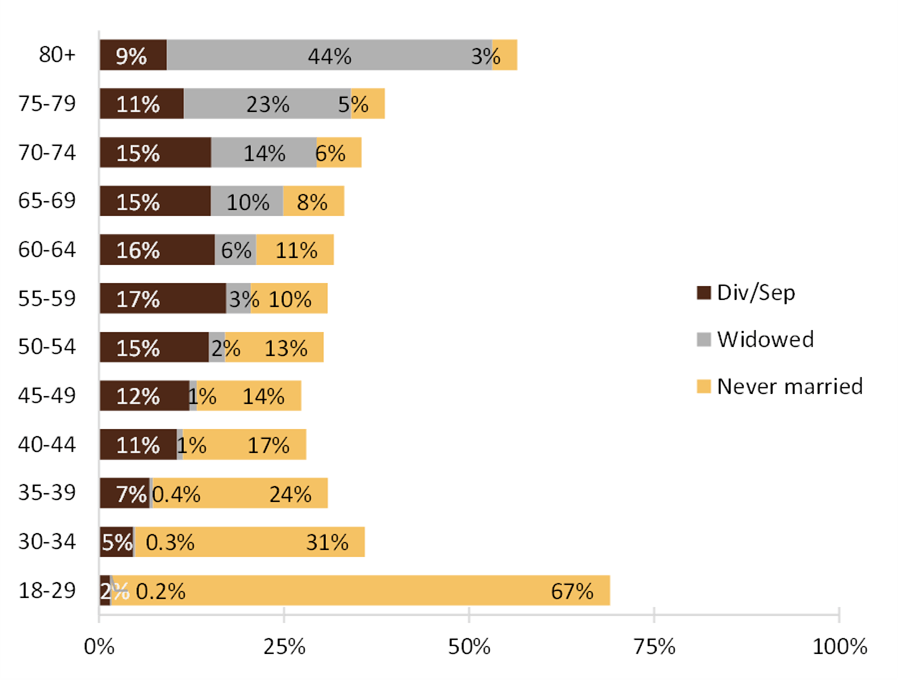
- The percentage of single adults initially decreased with age beginning among those aged 30 and older. The pattern stabilizes among individuals in their forties and fifties and then increases sharply after age 80.
- The marital status composition of singles differed markedly by age.
- The youngest age group had the highest share of never-married adults, 67%. The share of never-married adults declines with age.
- Among those in their fifties through their early seventies, most singles were divorced or separated, peaking at almost 17% among those aged 60-64.
- Widowhood increased with age, --nearly doubling from age 55-59 to age 60-64 (3% to 6%). The oldest age group (80+) experienced the highest levels of widowhood, over two in five (44%) were widowed.
Figure 1. Percentage of Single Adults by Age Group, 2022

Single Adults by Gender
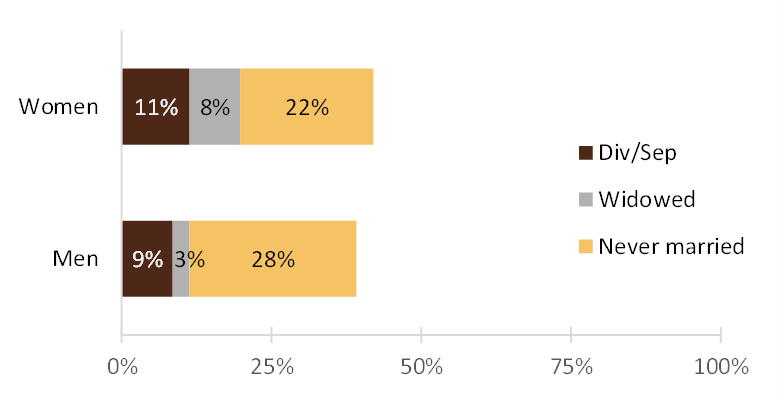
- In 2022, the share of adults who were single was slightly higher among women (42%) compared to men (39%). Over one-quarter of men (28%) had never been married, in contrast to 22% of women.
- Relative to men, women were more often widowed (3% of men versus 8% of women).
- The share of adults who were divorced/separated was slightly higher for women than men (11% compared to 9%).
Figure 2. Percentage of Single Adults by Gender, 2022

Single Adults by Race and Ethnicity
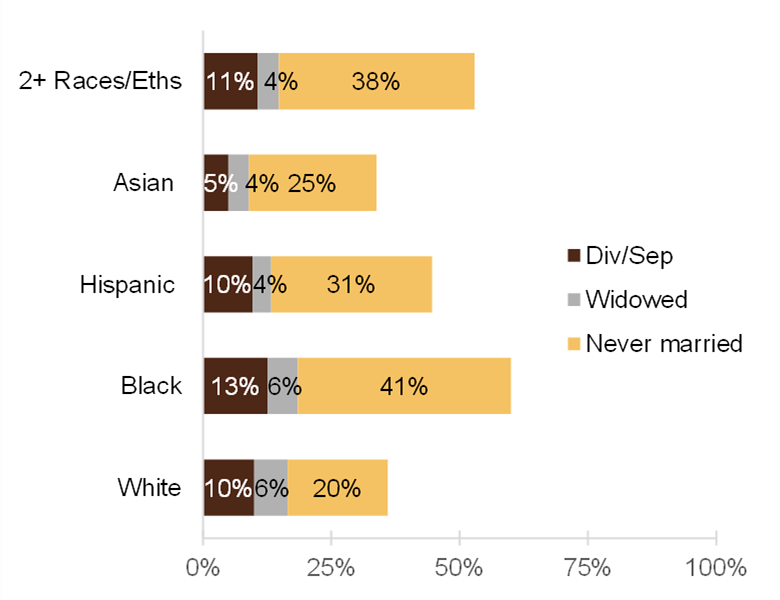
- The share of adults who were never married was highest among those who identified as Black and Multiracial (41% and 38%, respectively). These levels are twice as high as the share of White adults who had never married (19%).
- Hispanic single adults had the lowest proportion of widowhood (3.6%) while White and Black single adults had the highest (6.5% and 5.9% respectively).
- Being single and divorced/separated was substantially less common among Asian adults (4.9%) than either Black or White adults (13% and 10% respectively).
Figure 3. Percentage of Single Adults by Race and Ethnicity, 2022

Single Adults by Educational Attainment
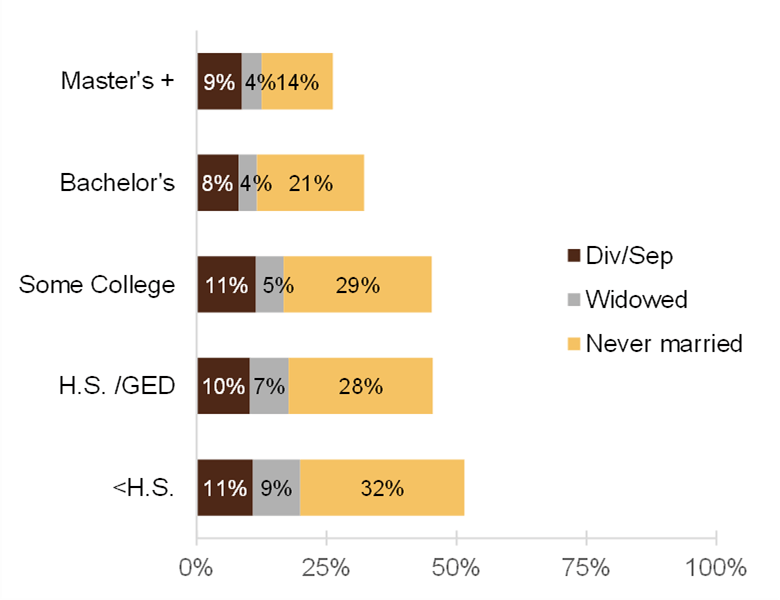
- An education gradient exists in terms of singlehood, the highest shares of adults who were single are highest among those with the lowest levels of educational attainment.
- In 2022, nearly one-third (32%) of adults who had not graduated from high school were single and never married. In contrast, 14% of adults with at least a master’s degree were single and never married.
- The share of adults who were widows decreased as educational attainment increased.
- One-in-ten (9.1%) of adults with less than a high school education was currently widowed compared to 3.6% of adults with at least a college degree.
- The prevalence of divorce or separation was not substantially different across levels of educational attainment among single adults.
Figure 4. Percentage of Single Adults by Educational Attainment, 2022

Data Source:
Flood, S., King, M., Rodgers, R., Ruggles, S., Warren, J. R., & Westberry, M. (2021). Integrated Public Use Microdata Series: Current Population Survey: Version 9.0 [dataset]. Minneapolis, MN: IPUMS. https://doi.org/10.18128/D030.V9.0
References:
Julian, C. A. (2022). Median age at first marriage, 2021. Family Profiles, FP-22-15. Bowling Green, OH: National Center for Family & Marriage Research. https://doi.org/10.25035/ncfmr/fp-22-15
Carlson, L. (2021). Age Variation in the Divorce Rate, 1990 & 2019. Family Profiles, FP-21-16. Bowling Green, OH: National Center for Family & Marriage Research. https://doi.org/10.25035/ncfmr/fp-21-16
Hemez, P. (2019). Single, cohabiting, & married households: 1995, 2012, & 2019. Family Profiles, FP-19-26. Bowling Green, OH: National Center for Family & Marriage Research. https://doi.org/10.25035/ncfmr/fp-19-26
Reynolds, L. (2021). The U.S. remarriage rate, 2019: Trends and geographic variation by gender. Family Profiles, FP-21-18. Bowling Green, OH: National Center for Family & Marriage Research. https://doi.org/10.25035/ncfmr/fp-21-18
Suggested Citation:
Juteau, G. (2022). Characteristics of single adults in the U.S., 2022. Family Profile, FP-22-30. National Center for Family & Marriage Research. https://doi.org/10.25035/ncfmr/fp-22-30
Updated: 11/07/2025 04:33PM


