Geographic Variation in Percentage of Unions Including Same-Sex and Different-Sex Couples Unions
Family Profile No. 06, 2023
Author: Christopher A. Julian
In 2015 the landmark Obergefell v. Hodges U.S. Supreme Court ruling legalized marriages to same-sex couples across all 50 states. Estimates from the 2021 ACS 1-year estimates indicated there were approximately 711,129 married and 498,333 cohabiting same-sex couples in the U.S., totaling more than 1.2 million unions.[1] We have a series of Family Profiles on marriage and cohabitation among same-sex couples (e.g.: Payne & Manning, 2021; Payne & Manning, 2021; Payne & Manning, 2021). In this Family Profile we explore the geographic variation of the percentage of unions that are to same-sex couples in the United States by pooling the U.S. Census Bureau’s 2019, 2020, and 2021 American Community Survey 1-year estimates to develop a 3-year period estimate.[2] While this profile examines LGBT+ population in the context of unions to same-sex couples, it is important to note that not all LGBT Americans are co-residing with a partner/spouse of the same-sex. For an estimate of the LGBT+ population see (Julian, 2023). In this profile we create a map of the U.S. to display the geographic clustering of states. Furthermore, we also rank states in the U.S. according to their percentage of same-sex unions.
[1] We use the term “same-sex” because the ACS asks respondents about their sex and the sex of their partner.
[2] We pool together 2019, 2020, and 2021 1-year estimates as opposed to using the 5-year estimates as the roster measurement changed in 2019, and the 5-year estimates would encompass years prior to this change (Manning & Payne, 2021).
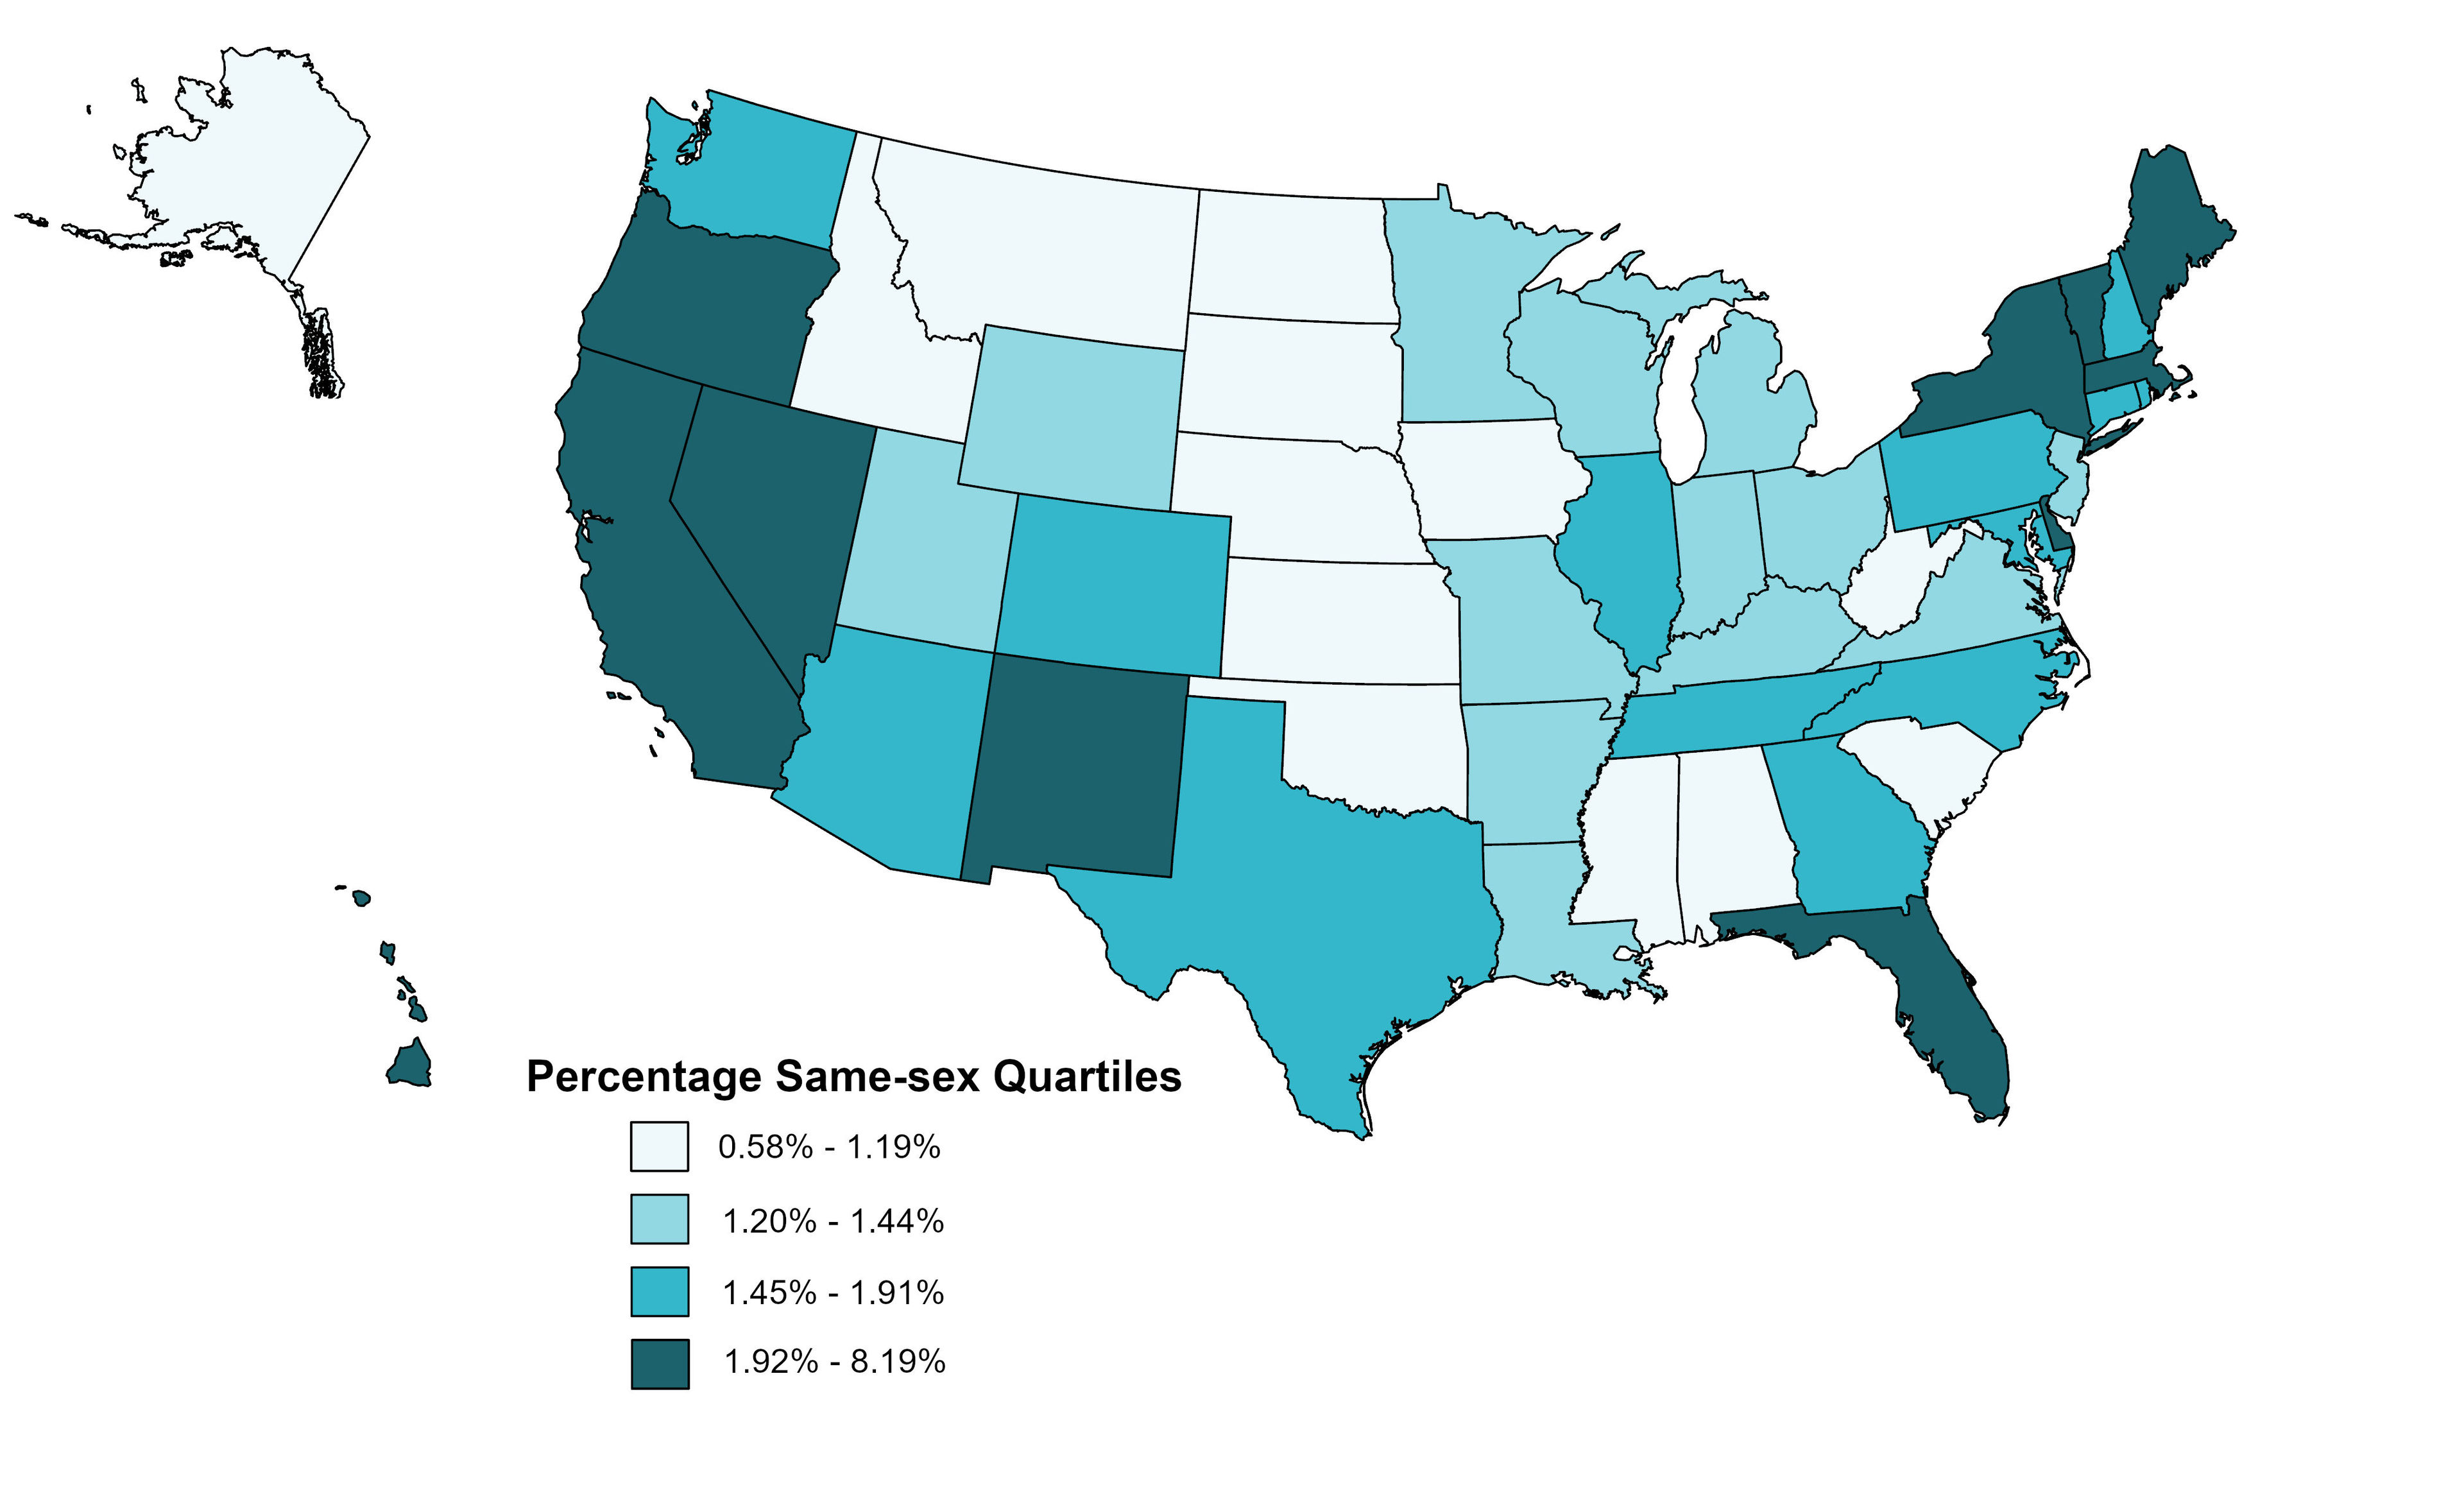
Map of Share of Unions to Same-sex Couples, 2019-2021
- A noticeable clustering of states with a high share of unions to same-sex couples were in the West and Southwest (Washington state, Oregon, California, Nevada, and New Mexico), as well as Northeast (New York, Massachusetts, Rhode Island, New Jersey, and Maine).
- A cluster of states with a low share of unions to same-sex couples were in the Northwest (North Dakota, South Dakota, Montana, Idaho, and Wyoming), Midwest (Nebraska, Kansas, and Iowa) and South (Arkansas, Mississippi, and Alabama).
Figure 1. Map of the share of unions to same-sex couples in the U.S., 2019-2021

Table 1. Ranking of Share of Same-sex Unions in the U.S., 2019-2021
Name |
Percentage |
Ranking |
District of Columbia |
8.19% |
1 |
Delaware |
2.44% |
2 |
Massachusetts |
2.23% |
3 |
Hawaii |
2.17% |
4 |
Oregon |
2.17% |
5 |
Florida |
2.16% |
6 |
Nevada |
2.14% |
7 |
Vermont |
2.13% |
8 |
California |
2.10% |
9 |
New Mexico |
2.07% |
10 |
New York |
2.05% |
11 |
Maine |
2.03% |
12 |
Washington |
1.91% |
13 |
Arizona |
1.86% |
14 |
Connecticut |
1.86% |
15 |
Rhode Island |
1.78% |
16 |
Colorado |
1.75% |
17 |
Georgia |
1.73% |
18 |
Maryland |
1.69% |
19 |
Texas |
1.66% |
20 |
New Hampshire |
1.60% |
21 |
Pennsylvania |
1.50% |
22 |
Illinois |
1.47% |
23 |
Tennessee |
1.44% |
24 |
North Carolina |
1.44% |
25 |
Missouri |
1.44% |
26 |
Kentucky |
1.43% |
27 |
Utah |
1.42% |
28 |
Louisiana |
1.40% |
29 |
Ohio |
1.38% |
30 |
Indiana |
1.38% |
31 |
Minnesota |
1.36% |
32 |
Virginia |
1.36% |
33 |
Wyoming |
1.36% |
34 |
New Jersey |
1.26% |
35 |
Wisconsin |
1.26% |
36 |
Michigan |
1.24% |
37 |
Arkansas |
1.20% |
38 |
South Carolina |
1.19% |
39 |
West Virginia |
1.16% |
40 |
North Dakota |
1.15% |
41 |
Alabama |
1.13% |
42 |
Oklahoma |
1.12% |
43 |
Alaska |
1.09% |
44 |
Kansas |
0.97% |
45 |
Nebraska |
0.96% |
46 |
Iowa |
0.90% |
47 |
Montana |
0.85% |
48 |
Mississippi |
0.83% |
49 |
Idaho |
0.61% |
50 |
South Dakota |
0.58% |
51 |
Source: NCFMR analyses of U.S. Census Bureau, American Community Survey 1-year estimates, 2019-2021
For more Family Profiles on the LGBTQ+ population visit here: https://www.bgsu.edu/ncfmr/resources/data/resources-by-topic/lgbtq-population.html
Data Source:
Ruggles, S., Flood, S., Goeken, R., Schouweiler, M., and Sobek, M. (2022). Integrated Public Use Microdata Series: IPUMS USA: Version 12.0 [dataset]. Minneapolis, MN: IPUMS, 2022. https://doi.org/10.18128/D010.V12.0
References:
Payne, K. K. & Manning, W. D. (2021). Recent marriages to same-sex and different-sex couples: Mobility, region, home ownership, and household income. Family Profiles, FP-21-20. Bowling Green, OH: National Center for Family & Marriage Research. https://doi.org/10.25035/ncfmr/fp-21-20
Payne, K. K. & Manning, W. D. (2021). Recent (2019) marriages to same-sex and different-sex couples: Marital history and age at marriage. Family Profiles, FP-21-19. Bowling Green, OH: National Center for Family & Marriage Research. https://doi.org/10.25035/ncfmr/fp-21-19
Payne, K. K. & Manning, W. D. (2021). Median age at first marriage for same-sex and different-sex couples, 2019. Family Profiles, FP-21-11. Bowling Green, OH: National Center for Family & Marriage Research. https://doi.org/10.25035/ncfmr/fp-21-11
Manning, W. D., & Payne, K. K. (2021). Measuring marriage and cohabitation: Assessing same-sex relationship status in the current population survey. Demography, 58(3), 811-820. https://doi.org/10.1215/00703370-9162213
Suggested Citation:
Julian, C. A. (2023). Geographic variation in percentage of unions including same-sex and different-sex couples unions. Family Profiles, FP-23-05. National Center for Family & Marriage Research. https://doi.org/10.25035/ncfmr/fp-23-06
Updated: 11/07/2025 04:21PM


