Cohabitation among Young Adults
Family Profile No. 29, 2022
Author: Christopher A. Julian
In 2019, 9.5 million household heads aged 18 to 29 were unmarried. Of these unmarried household heads, one in four (24.7%) or 2.3 million were cohabiting. Using the 2019 American Community Survey 1-year estimates, this Family Profile estimates the percentage of cohabitation among unmarried younger adults. This measure was calculated as the total number of household heads aged 18 to 29 that were cohabiting per 100 unmarried household heads aged 18 to 29 (we then multiplied by 100 to express this fraction as a percentage). We also examine the percentage of young adult cohabitors across all 50 states, and the percentage of unmarried young adults cohabiting by age and gender. This profile is a companion to our Prevalence of Cohabitation Among Older Adults profile (Julian, 2022).
The Trend in Young Adult Cohabitation
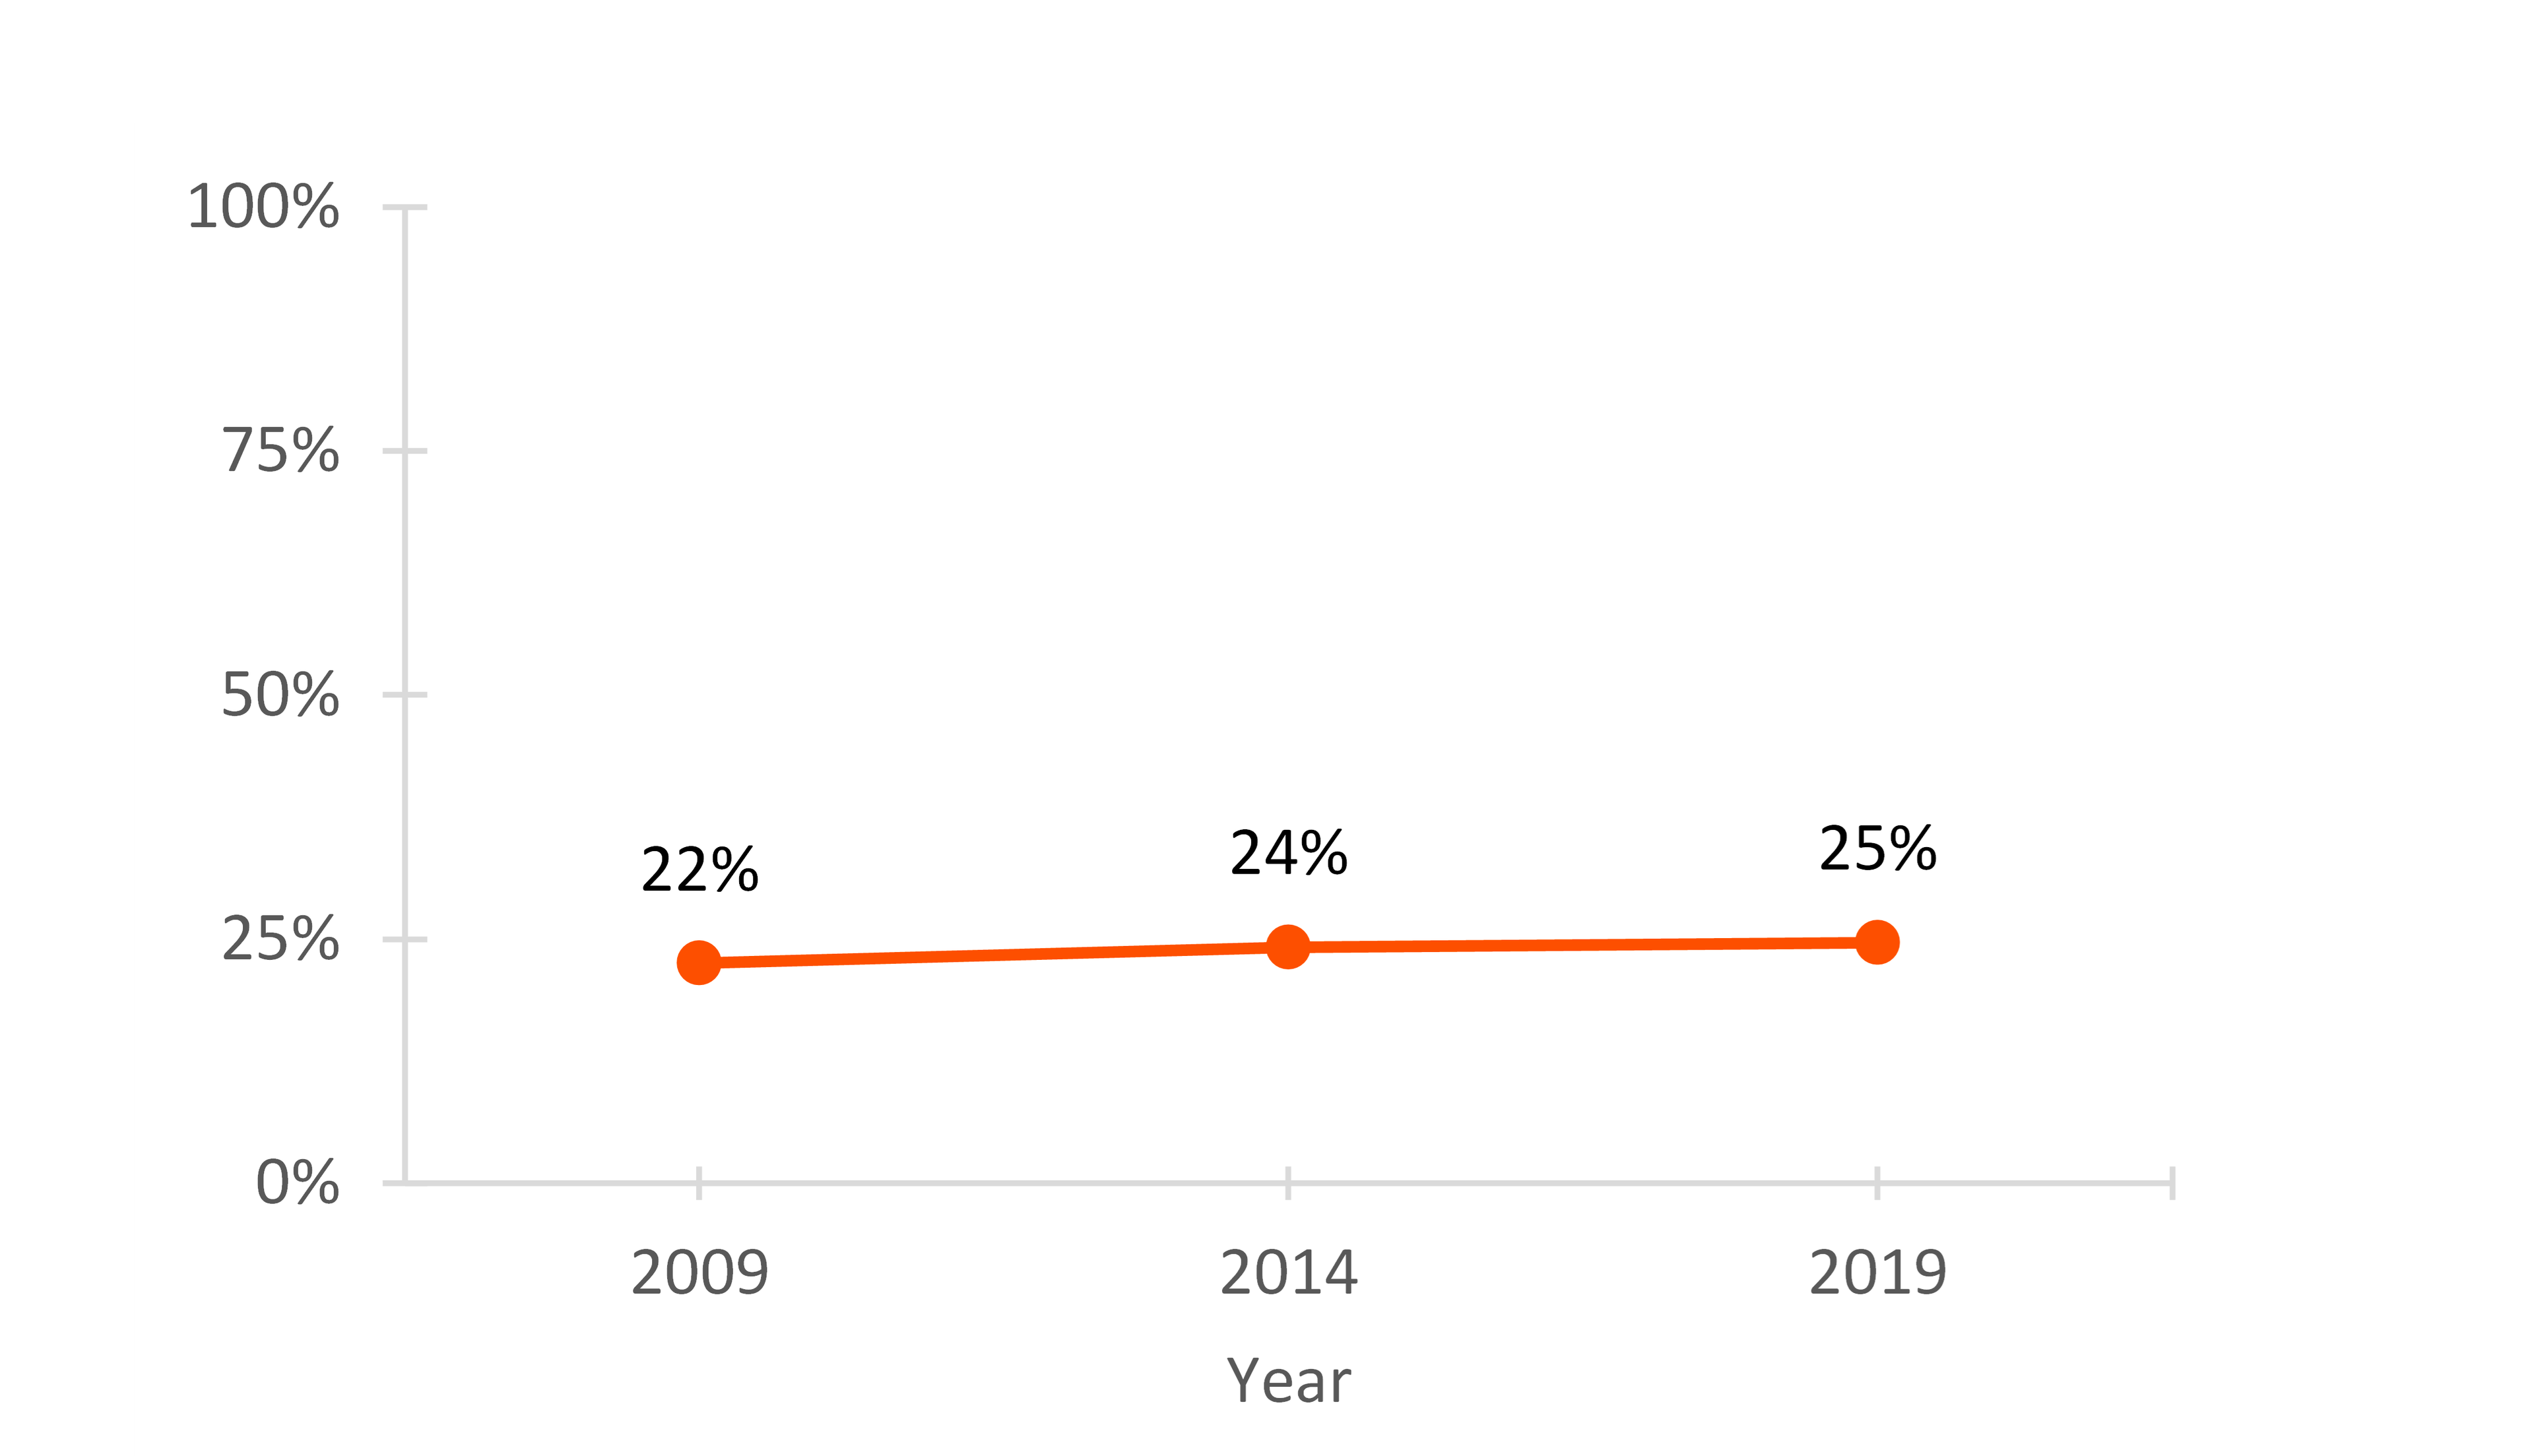
- Cohabitation has increased slightly among young adults. In 2009, the percentage cohabiting among young adults aged 18 to 29 was 22%, and the level rose to 24% in 2014, a 2% increase over the 5-year timespan. In 2019, the percentage had increased to 25%.
- The levels of cohabitation among unmarried young adults were four times higher than those observed among those unmarried adults age 50 and older (results shown in Julian, 2022).
Figure 1. Percentage of Unmarried Younger Adults Cohabiting

Unmarried Young Adult Cohabitors by State
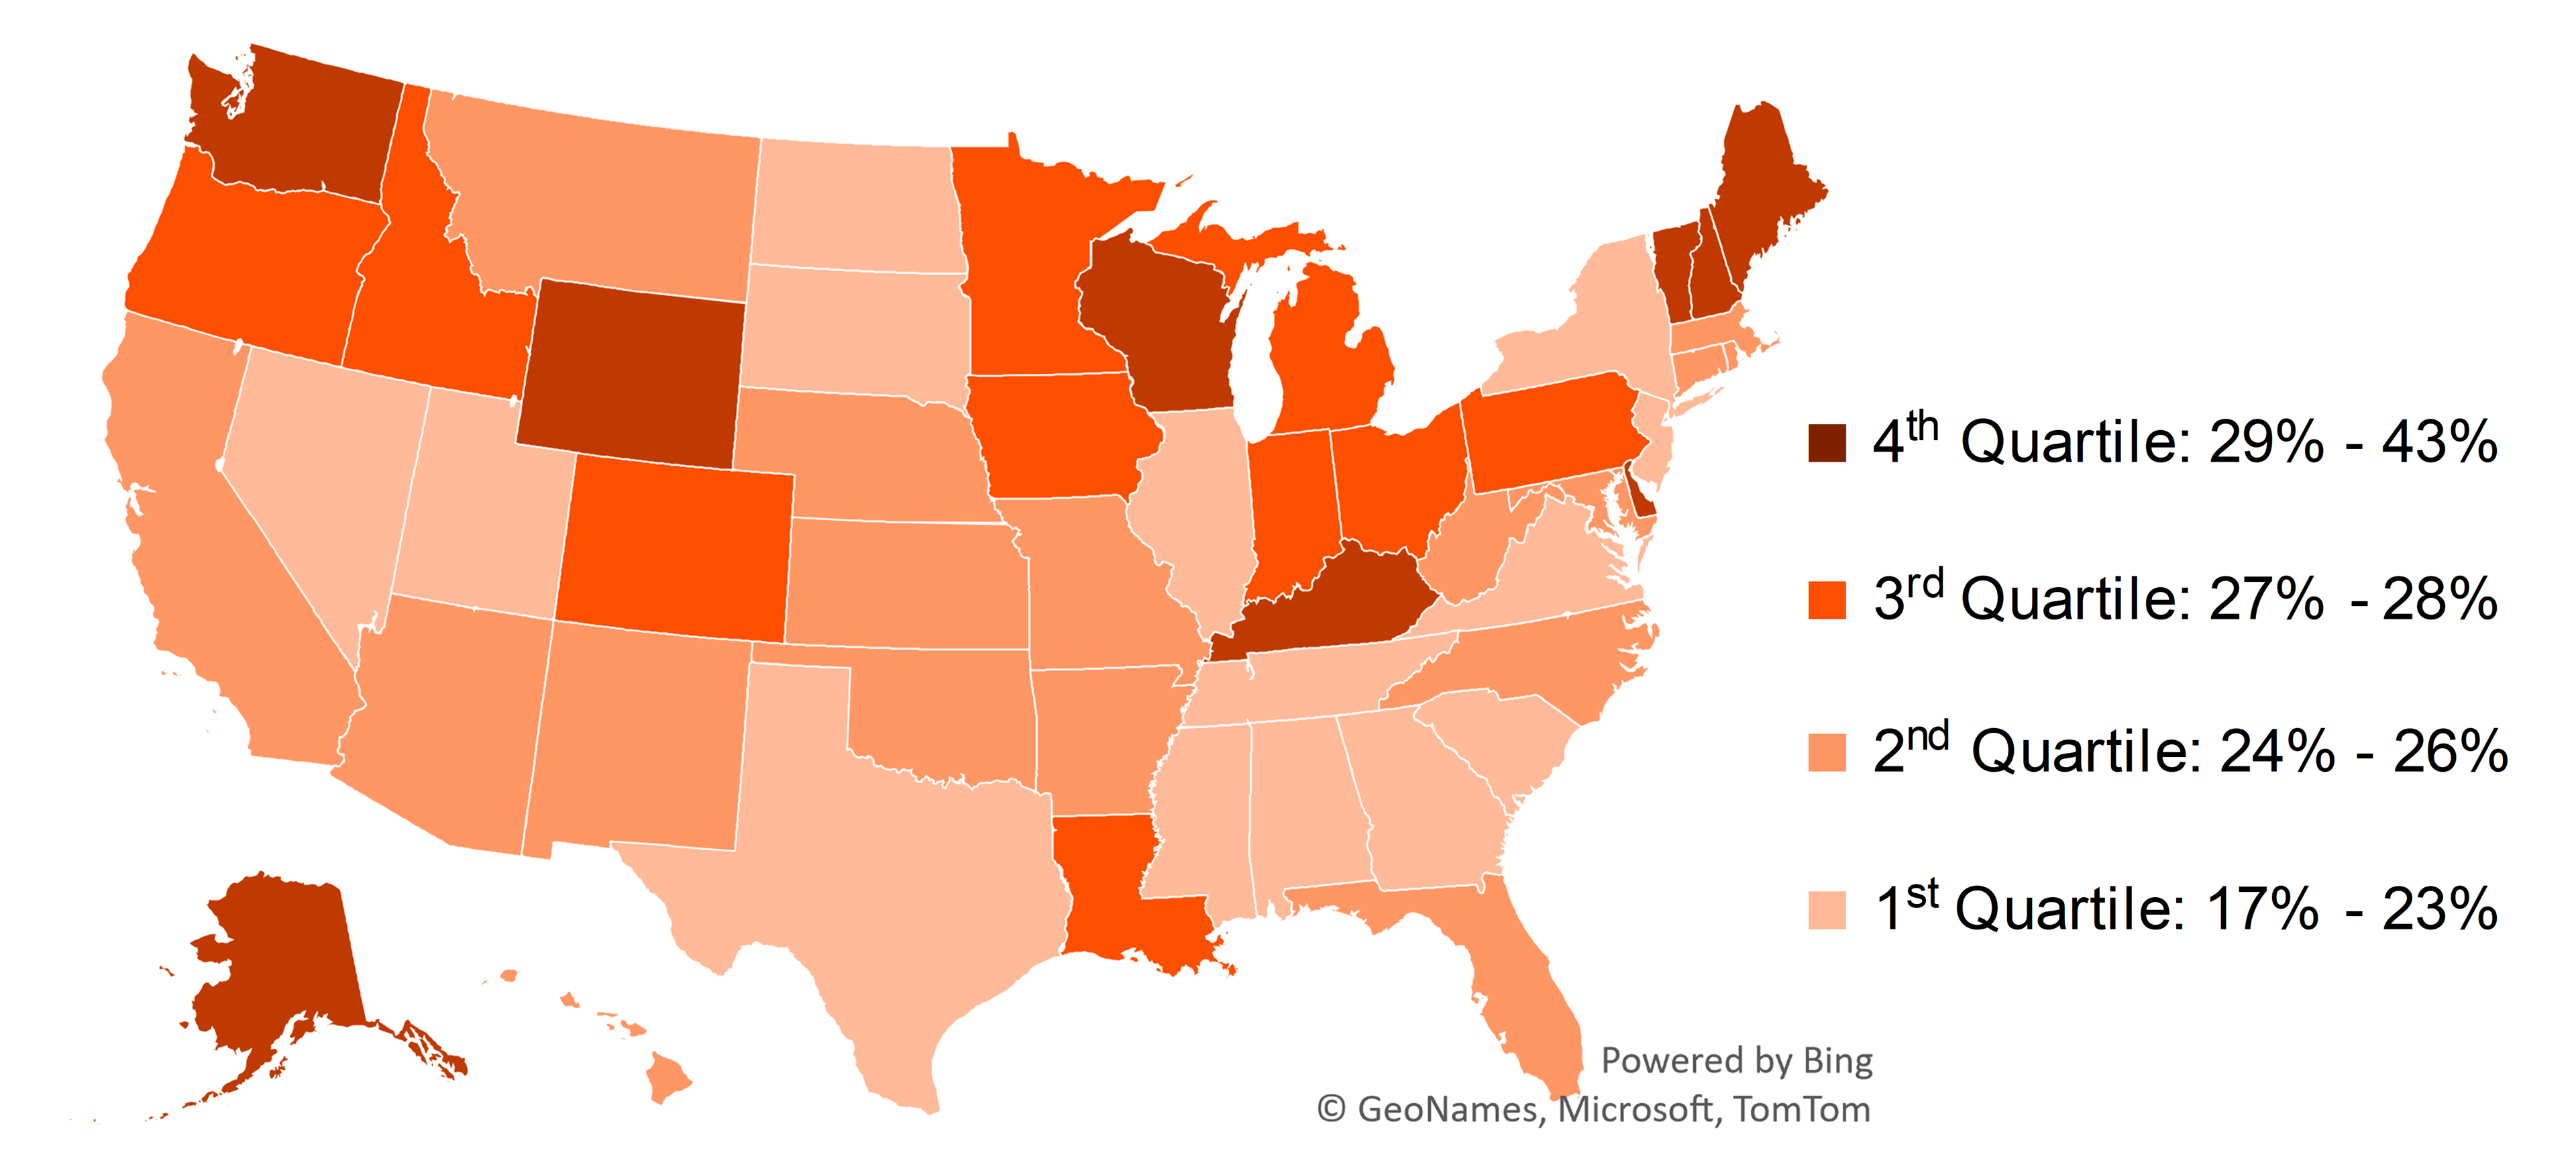
Figure 2 illustrates the percentage of unmarried young adults cohabiting by state.
- Mississippi experienced the lowest percentage of cohabiting unmarried young adults, 17%.
- In New Hampshire 43% of unmarried young adults were cohabiting, which was the highest level in the nation.
- Geographic variation in cohabitation is evident among unmarried young adults.
- In the West (Oregon, Washington) and Northeast (Maine, Vermont, New Hampshire, Pennsylvania) regions, there was a noticeable cluster of states with relatively high levels of cohabiting young adults.
- The South (Texas, Tennessee, Virginia, South Carolina, Georgia, Mississippi, & Alabama) is an area marked by relatively low shares of cohabiting young adults
Figure 2. Percentage of Unmarried Young Adults Cohabiting by State, 2019

Unmarried Young Adults Cohabiting by Age Group
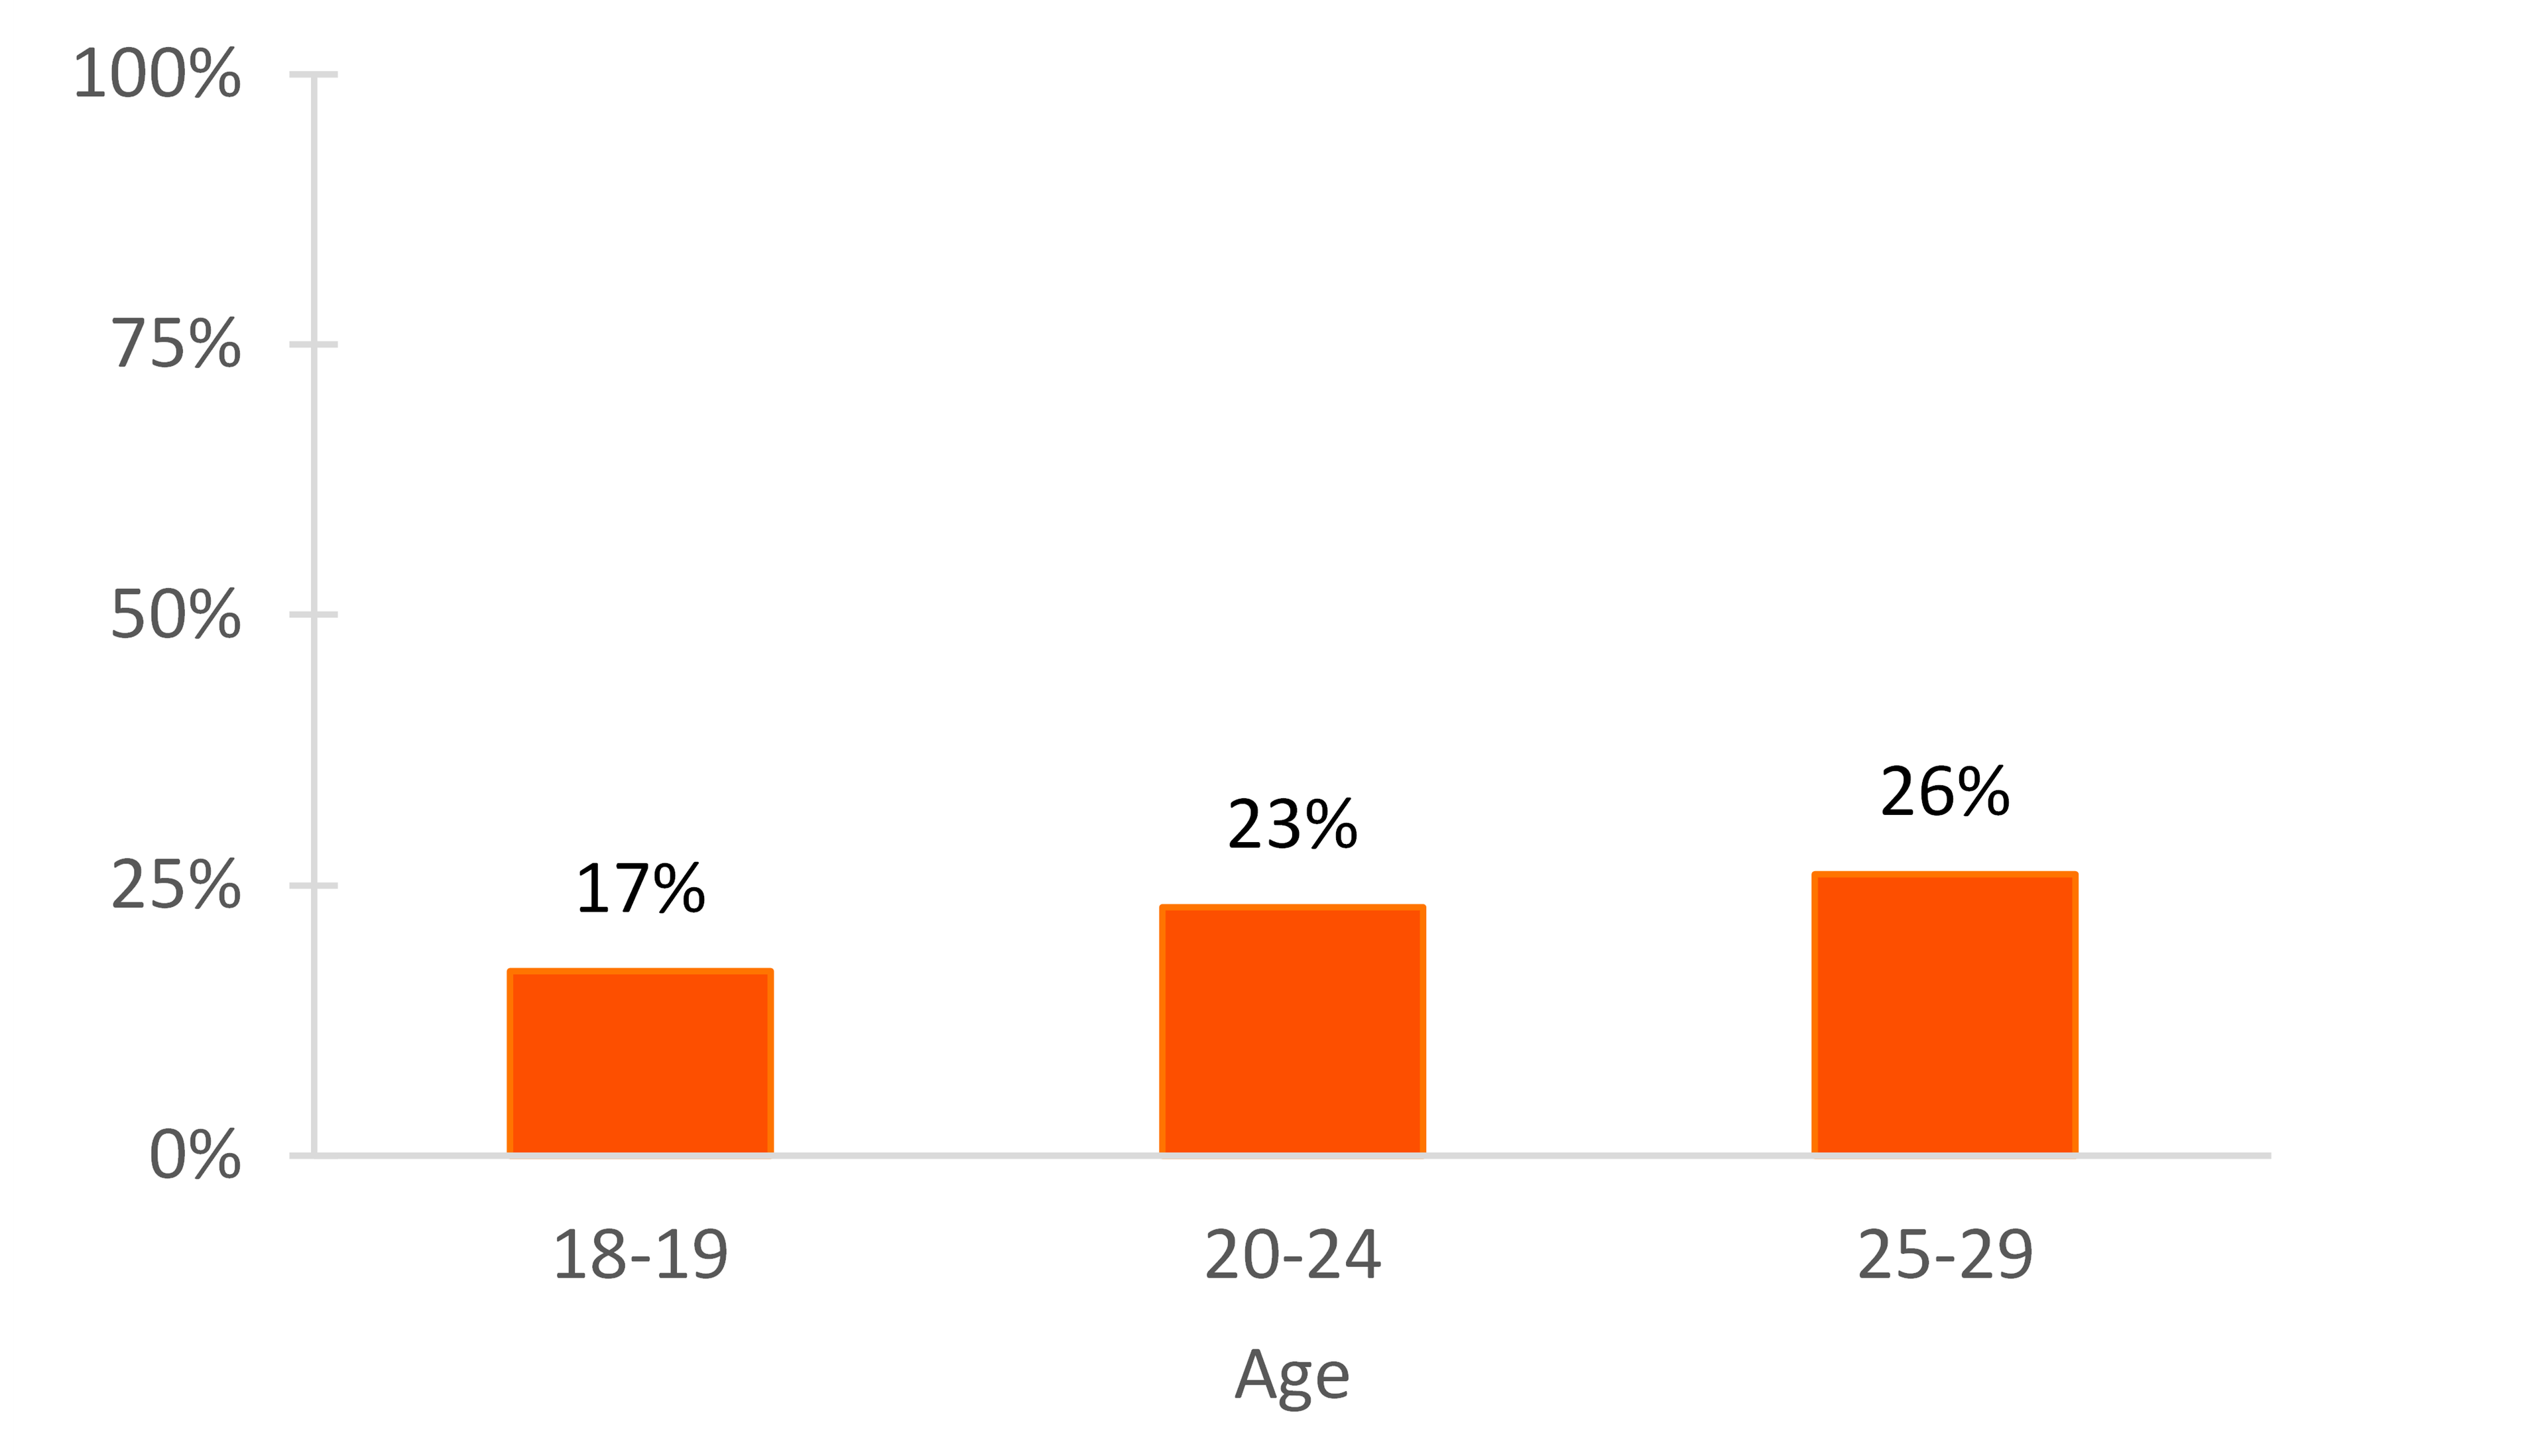
Figure 3 illustrates the percentage of unmarried young adults cohabiting by age group. Overall, the percentage cohabiting slightly increased with age.
- Among unmarried 18-19-year-olds, one in six (17%) were cohabiting.
- The levels of cohabitation were highest among those in their late twenties. One in four (26%) unmarried men and women between the ages of 25 and 29 were cohabiting.
Figure 3. Percentage of Unmarried Young Adults Cohabiting by Age Group, 2019

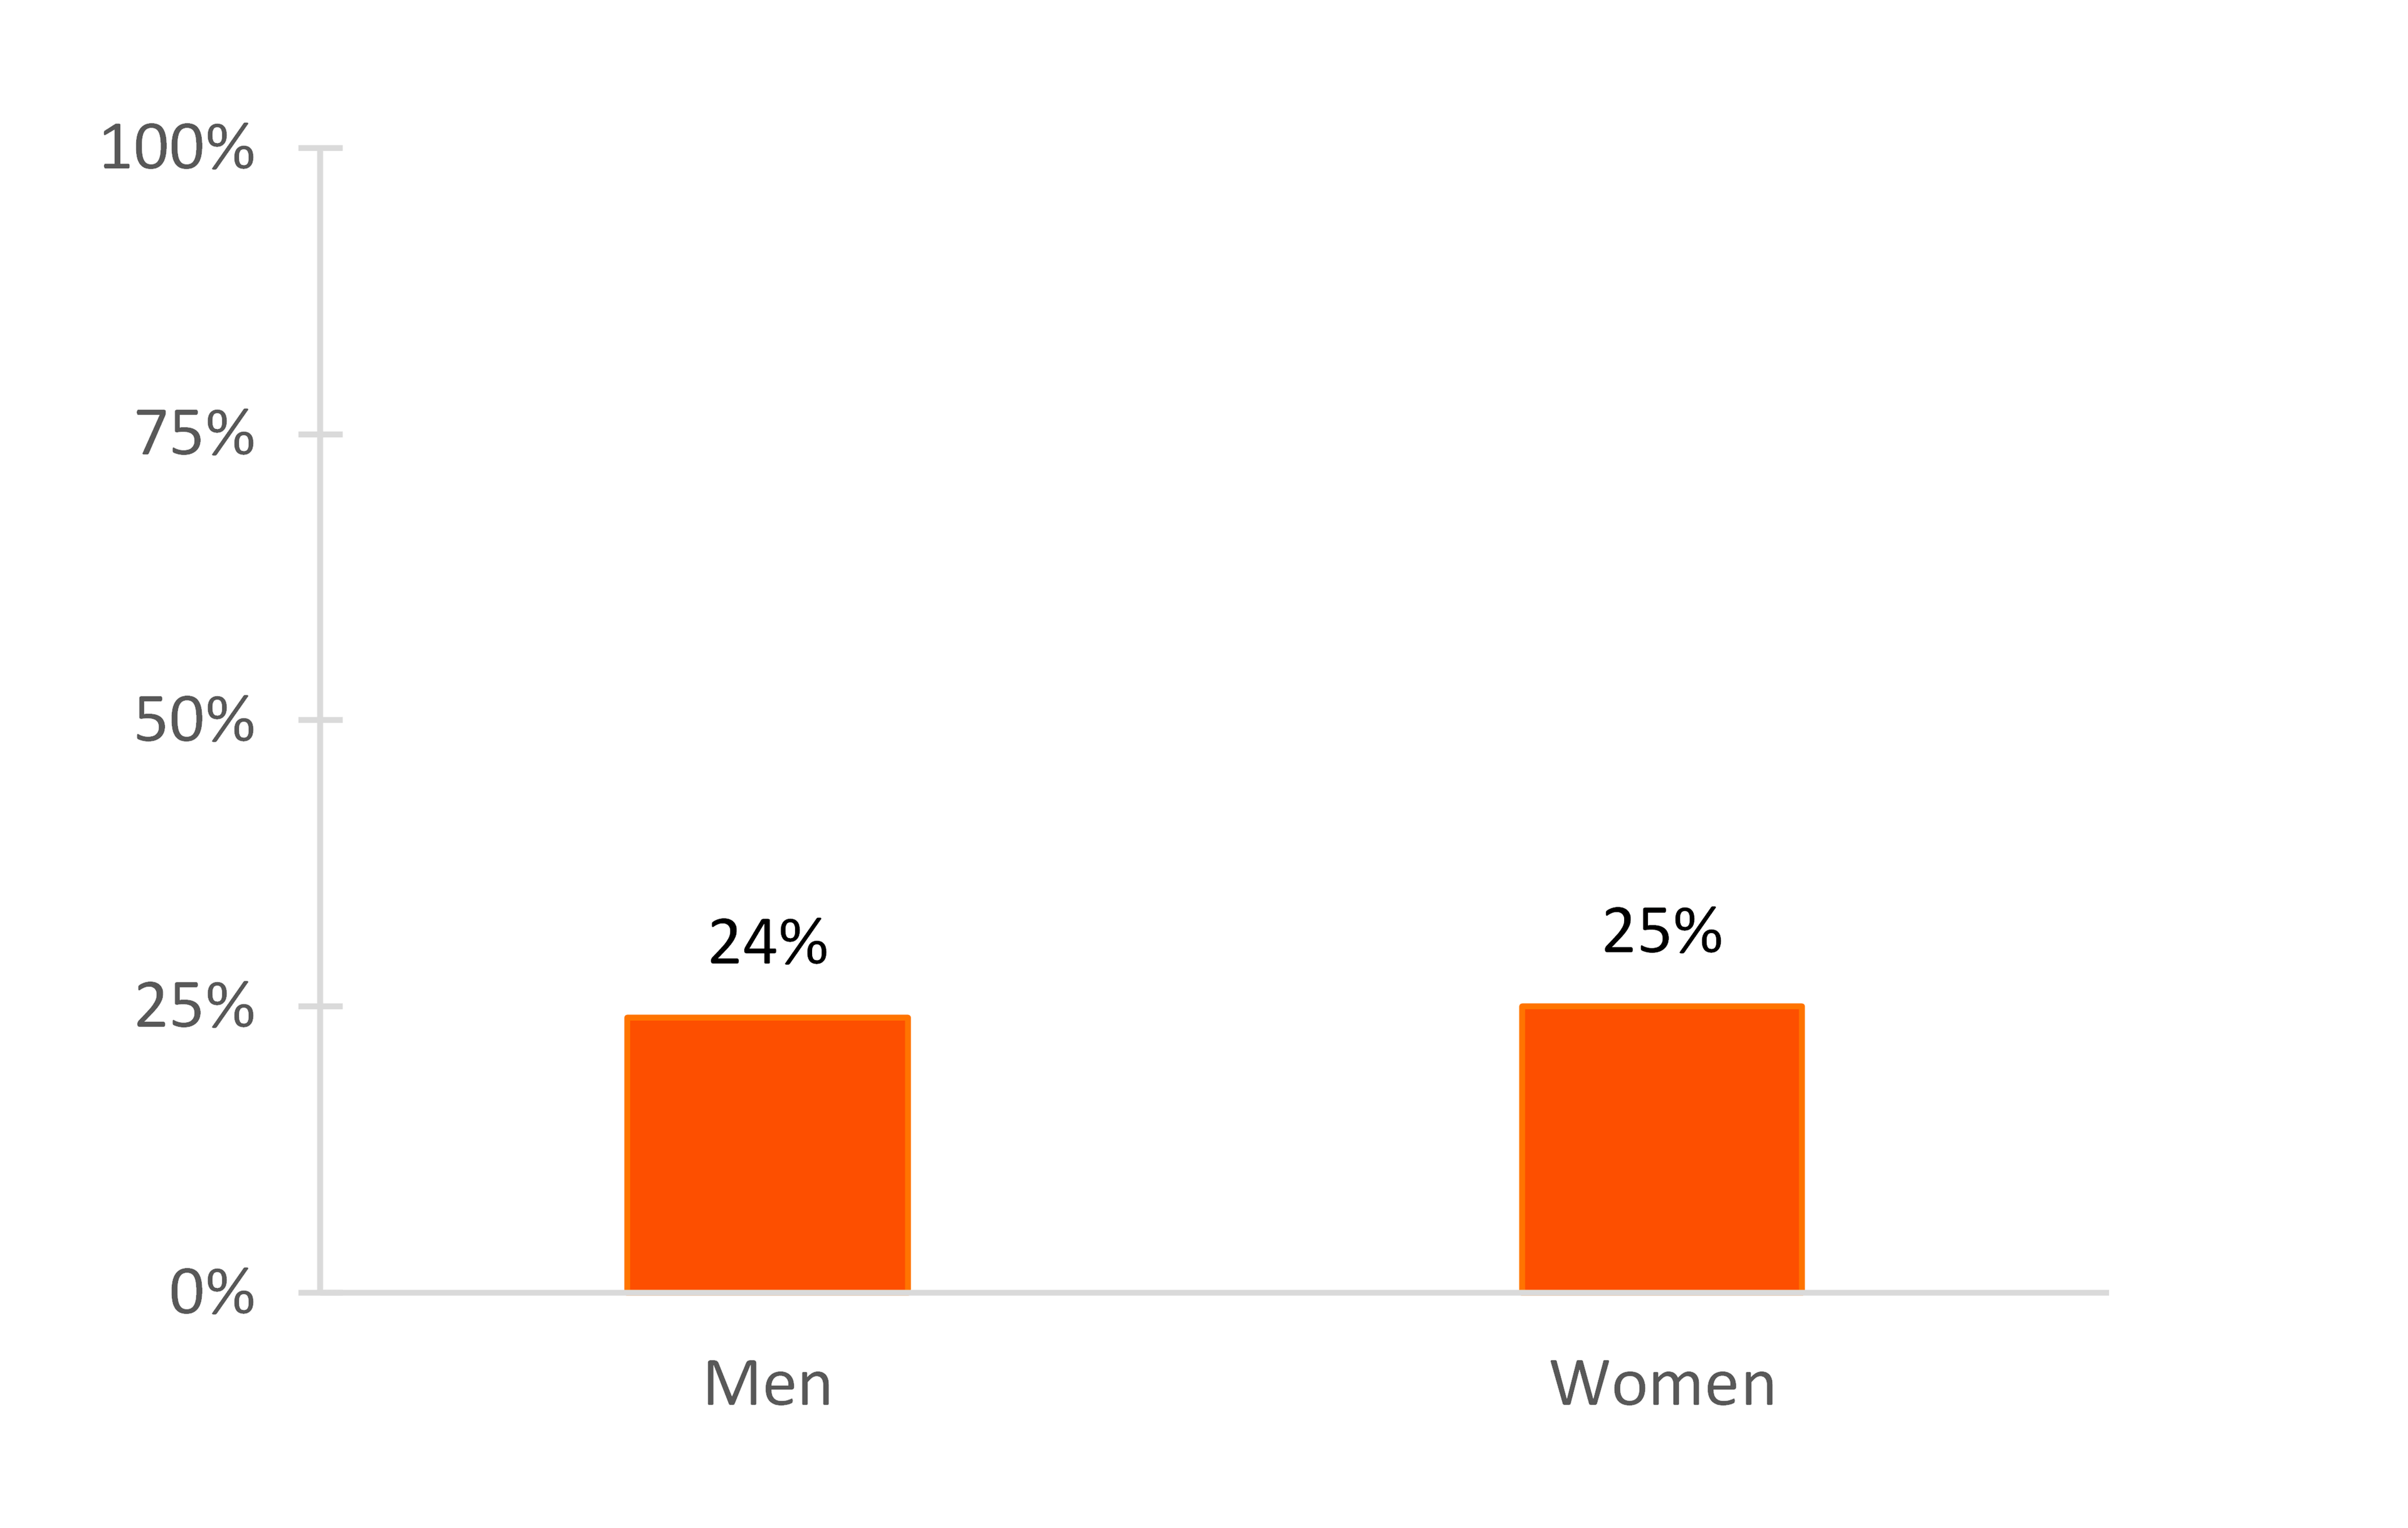
Figure 4 illustrates the percentage of unmarried young adults cohabiting by their gender. In 2019, there was little gender difference in the percentage of cohabitation among young adult men (24%) and among young adult women (25%).
- In 2019 an estimated 4.5 million young adult men were unmarried. Of these unmarried men, 1.1 million were cohabiting (24%).
- Conversely, an estimated 4.9 million young adult women were unmarried, with an estimated 1.2 million cohabiting (25%).
Figure 4. Percentage of Unmarried Young Adults Cohabiting by Gender, 2019


In 2019, 9.5 million household heads aged 18 to 29 were unmarried. Of these unmarried household heads, one in four (24.7%) or 2.3 million were cohabiting.

Data Source:
U.S Census Bureau American Community Survey, 1-year estimates, 2019
References:
Julian, C. A. (2022). Prevalence of cohabitation among unmarried older adults. Family Profiles, FP-22-10. Bowling Green, OH: National Center for Family & Marriage Research. https://doi.org/10.25035/ncfmr/fp-22-10
Suggested Citation:
Julian, C. A. (2022). Cohabitation among young adults, 2022. Family Profile, FP-22-29. National Center for Family & Marriage Research. https://doi.org/10.25035/ncfmr/fp-22-29
Updated: 11/07/2025 04:17PM


