Prevalence of Cohabitation Among Unmarried Older Adults
Family Profile No. 10, 2022
Author: Christopher A. Julian
In 2019, 35 million household heads aged 50 and older were unmarried. Of these unmarried older adults, 2.1 million were cohabiting. Using the 2019 American Community Survey 1-year estimates, this Family Profile estimates the prevalence rate of cohabitation among unmarried older adults, calculated as the number of household heads cohabiting aged 50 and older per 1,000 unmarried household heads aged 50 and older. We also examine the prevalence rate of older adult cohabitors across all 50 states, and the prevalence rate of unmarried older adults cohabiting by age and gender. This is an update of Family Profile FP-16-20.
Prevalence Rate of Unmarried Older Adults Cohabiting
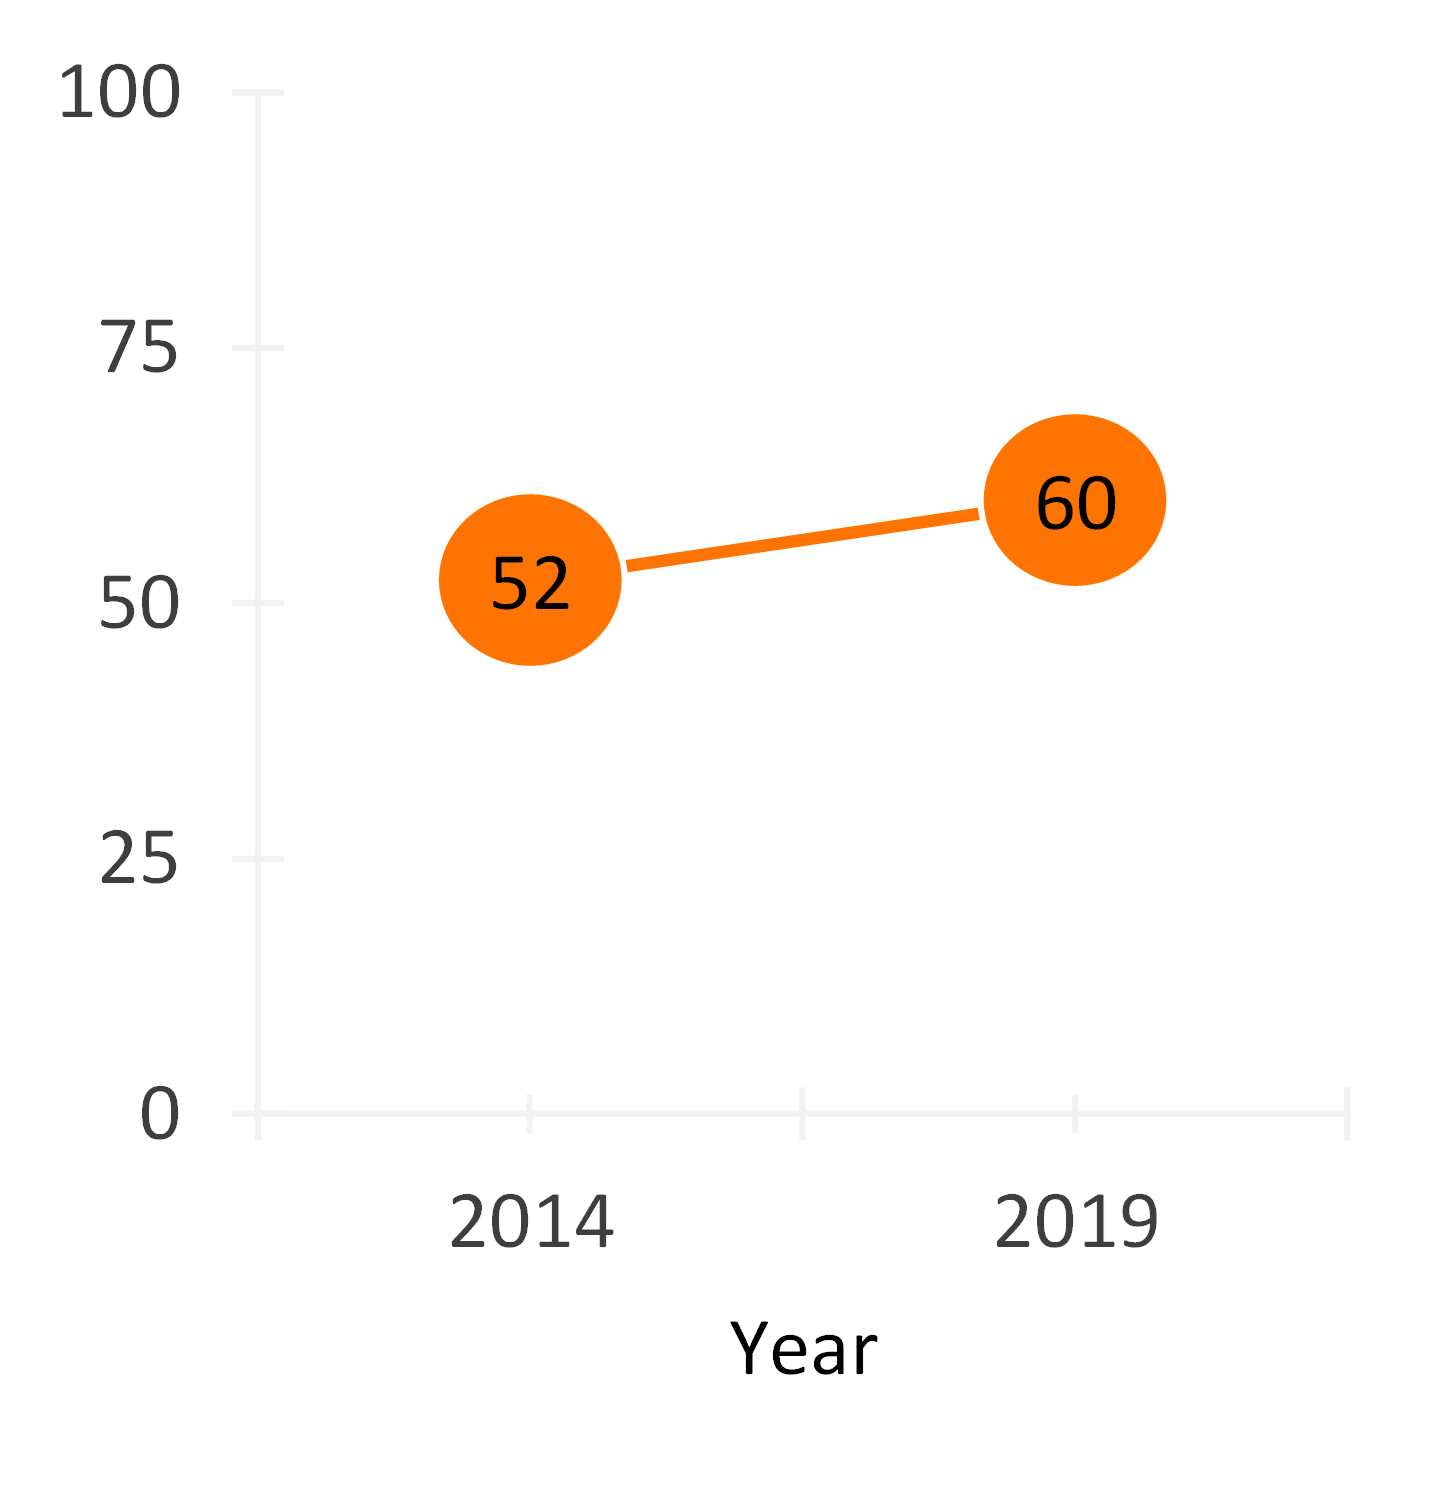
Figure 1 illustrates the prevalence rate of unmarried adults cohabiting in 2014 and 2019.
- In 2014, the prevalence rate of cohabitation among older adults was 52 per 1,000 unmarried adults 50 and older, rising to 60 in 2019. For comparison, the prevalence rate of cohabitation among unmarried adults aged 18-34 and aged 35-49 was 242 and 164, respectively, per 1,000 unmarried in 2019 (not shown). For a comparison of the age variation in cohabitation, visit FP-20-12.
Note: Prevalence rate of cohabitors are represented as the number of household heads cohabiting aged 50 and older per 1,000 unmarried household heads aged 50 and older.
Figure 1. Prevalence Rate of Unmarried Older Adults Cohabiting

Prevalence Rate of Unmarried Older Adults Cohabiting by State
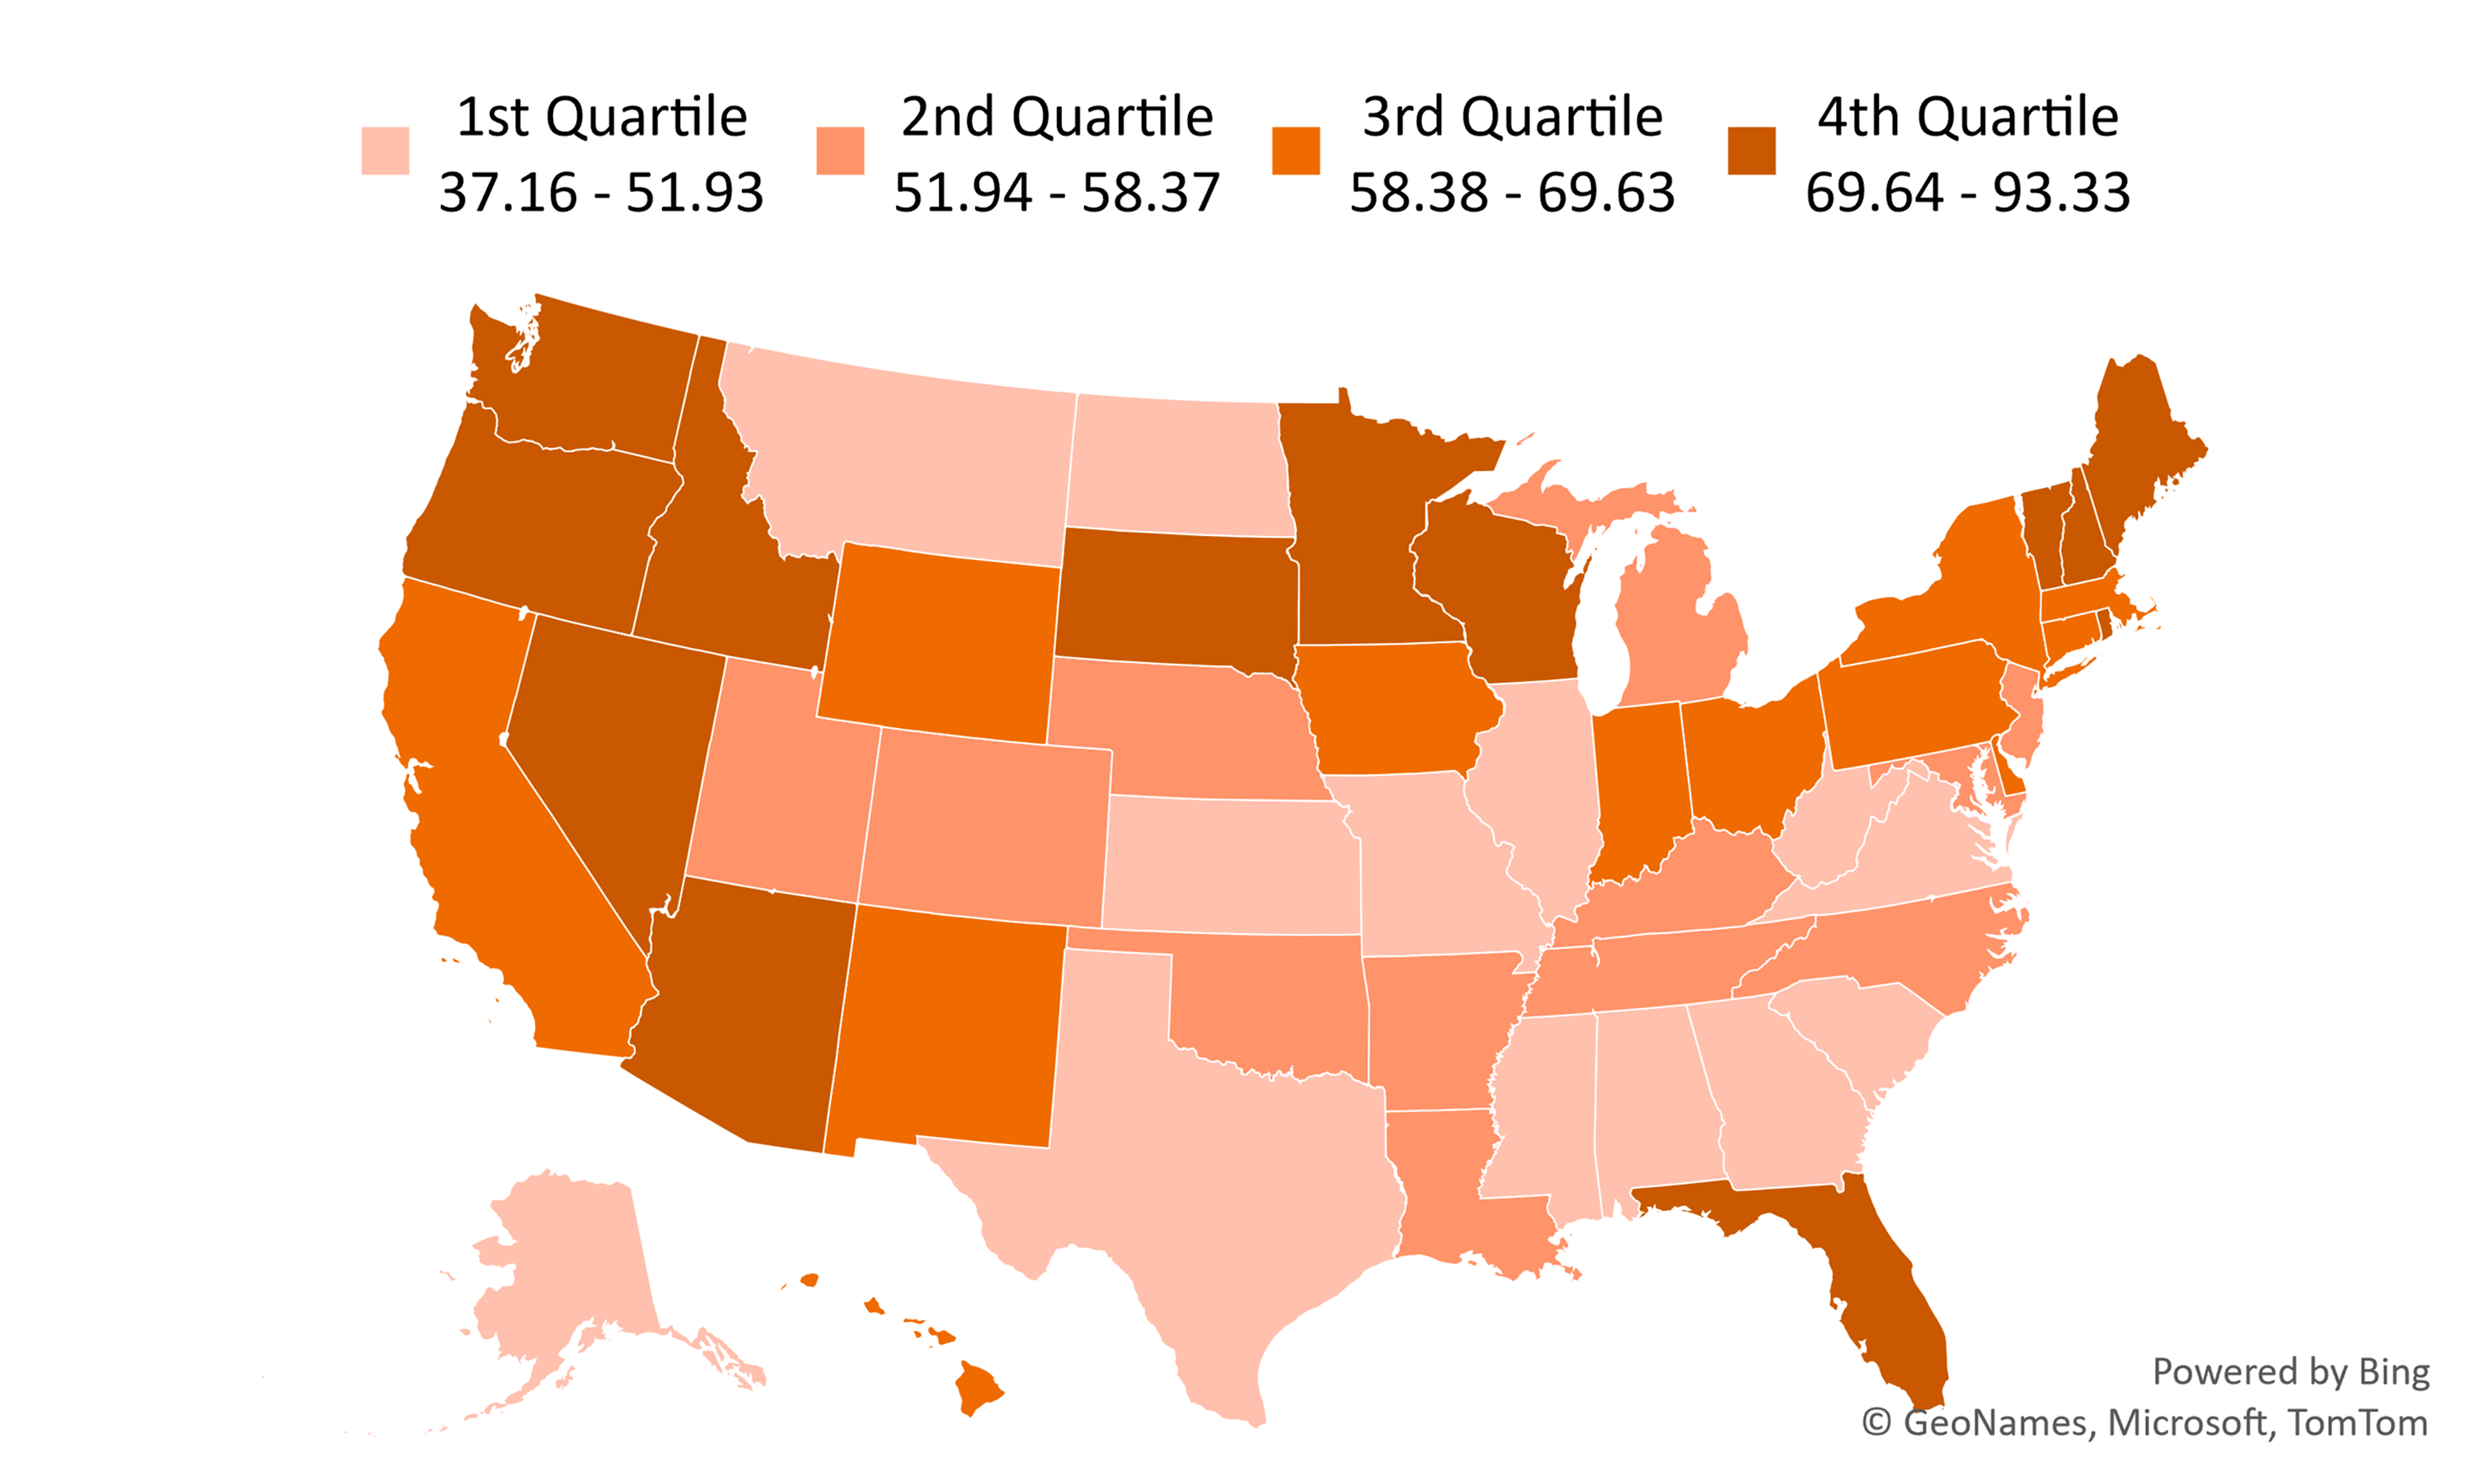
- Alabama had the lowest prevalence rate of cohabitation among unmarried older adults, at 37 per 1,000 unmarried adults aged 50 and older.
- Vermont had the highest prevalence rate of cohabitation at 90 per 1,000 unmarried adults aged 50 and older, more than double the rate of Alabama.
- There is geographic clustering of cohabitation prevalence rates among unmarried older adults.
- In the West (Oregon, Washington, Nevada, and Arizona) and Northeast (Maine, Vermont, New Hampshire) coasts, there was a noticeable cluster of states with relatively high prevalence rates of cohabitation.
- In the South (South Carolina, Georgia, Mississippi, Alabama, Arkansas, and Texas), there is a noticeable cluster of states with relatively low prevalence rates.
Note: Prevalence rate of cohabitors are represented as the number of household heads cohabiting aged 50 and older per 1,000 unmarried household heads aged 50 and older
Figure 2. Prevalence Rate of Unmarried Older Adults Cohabiting by State, 2019

Prevalence Rate of Unmarried Older Adults Cohabiting by Age Group
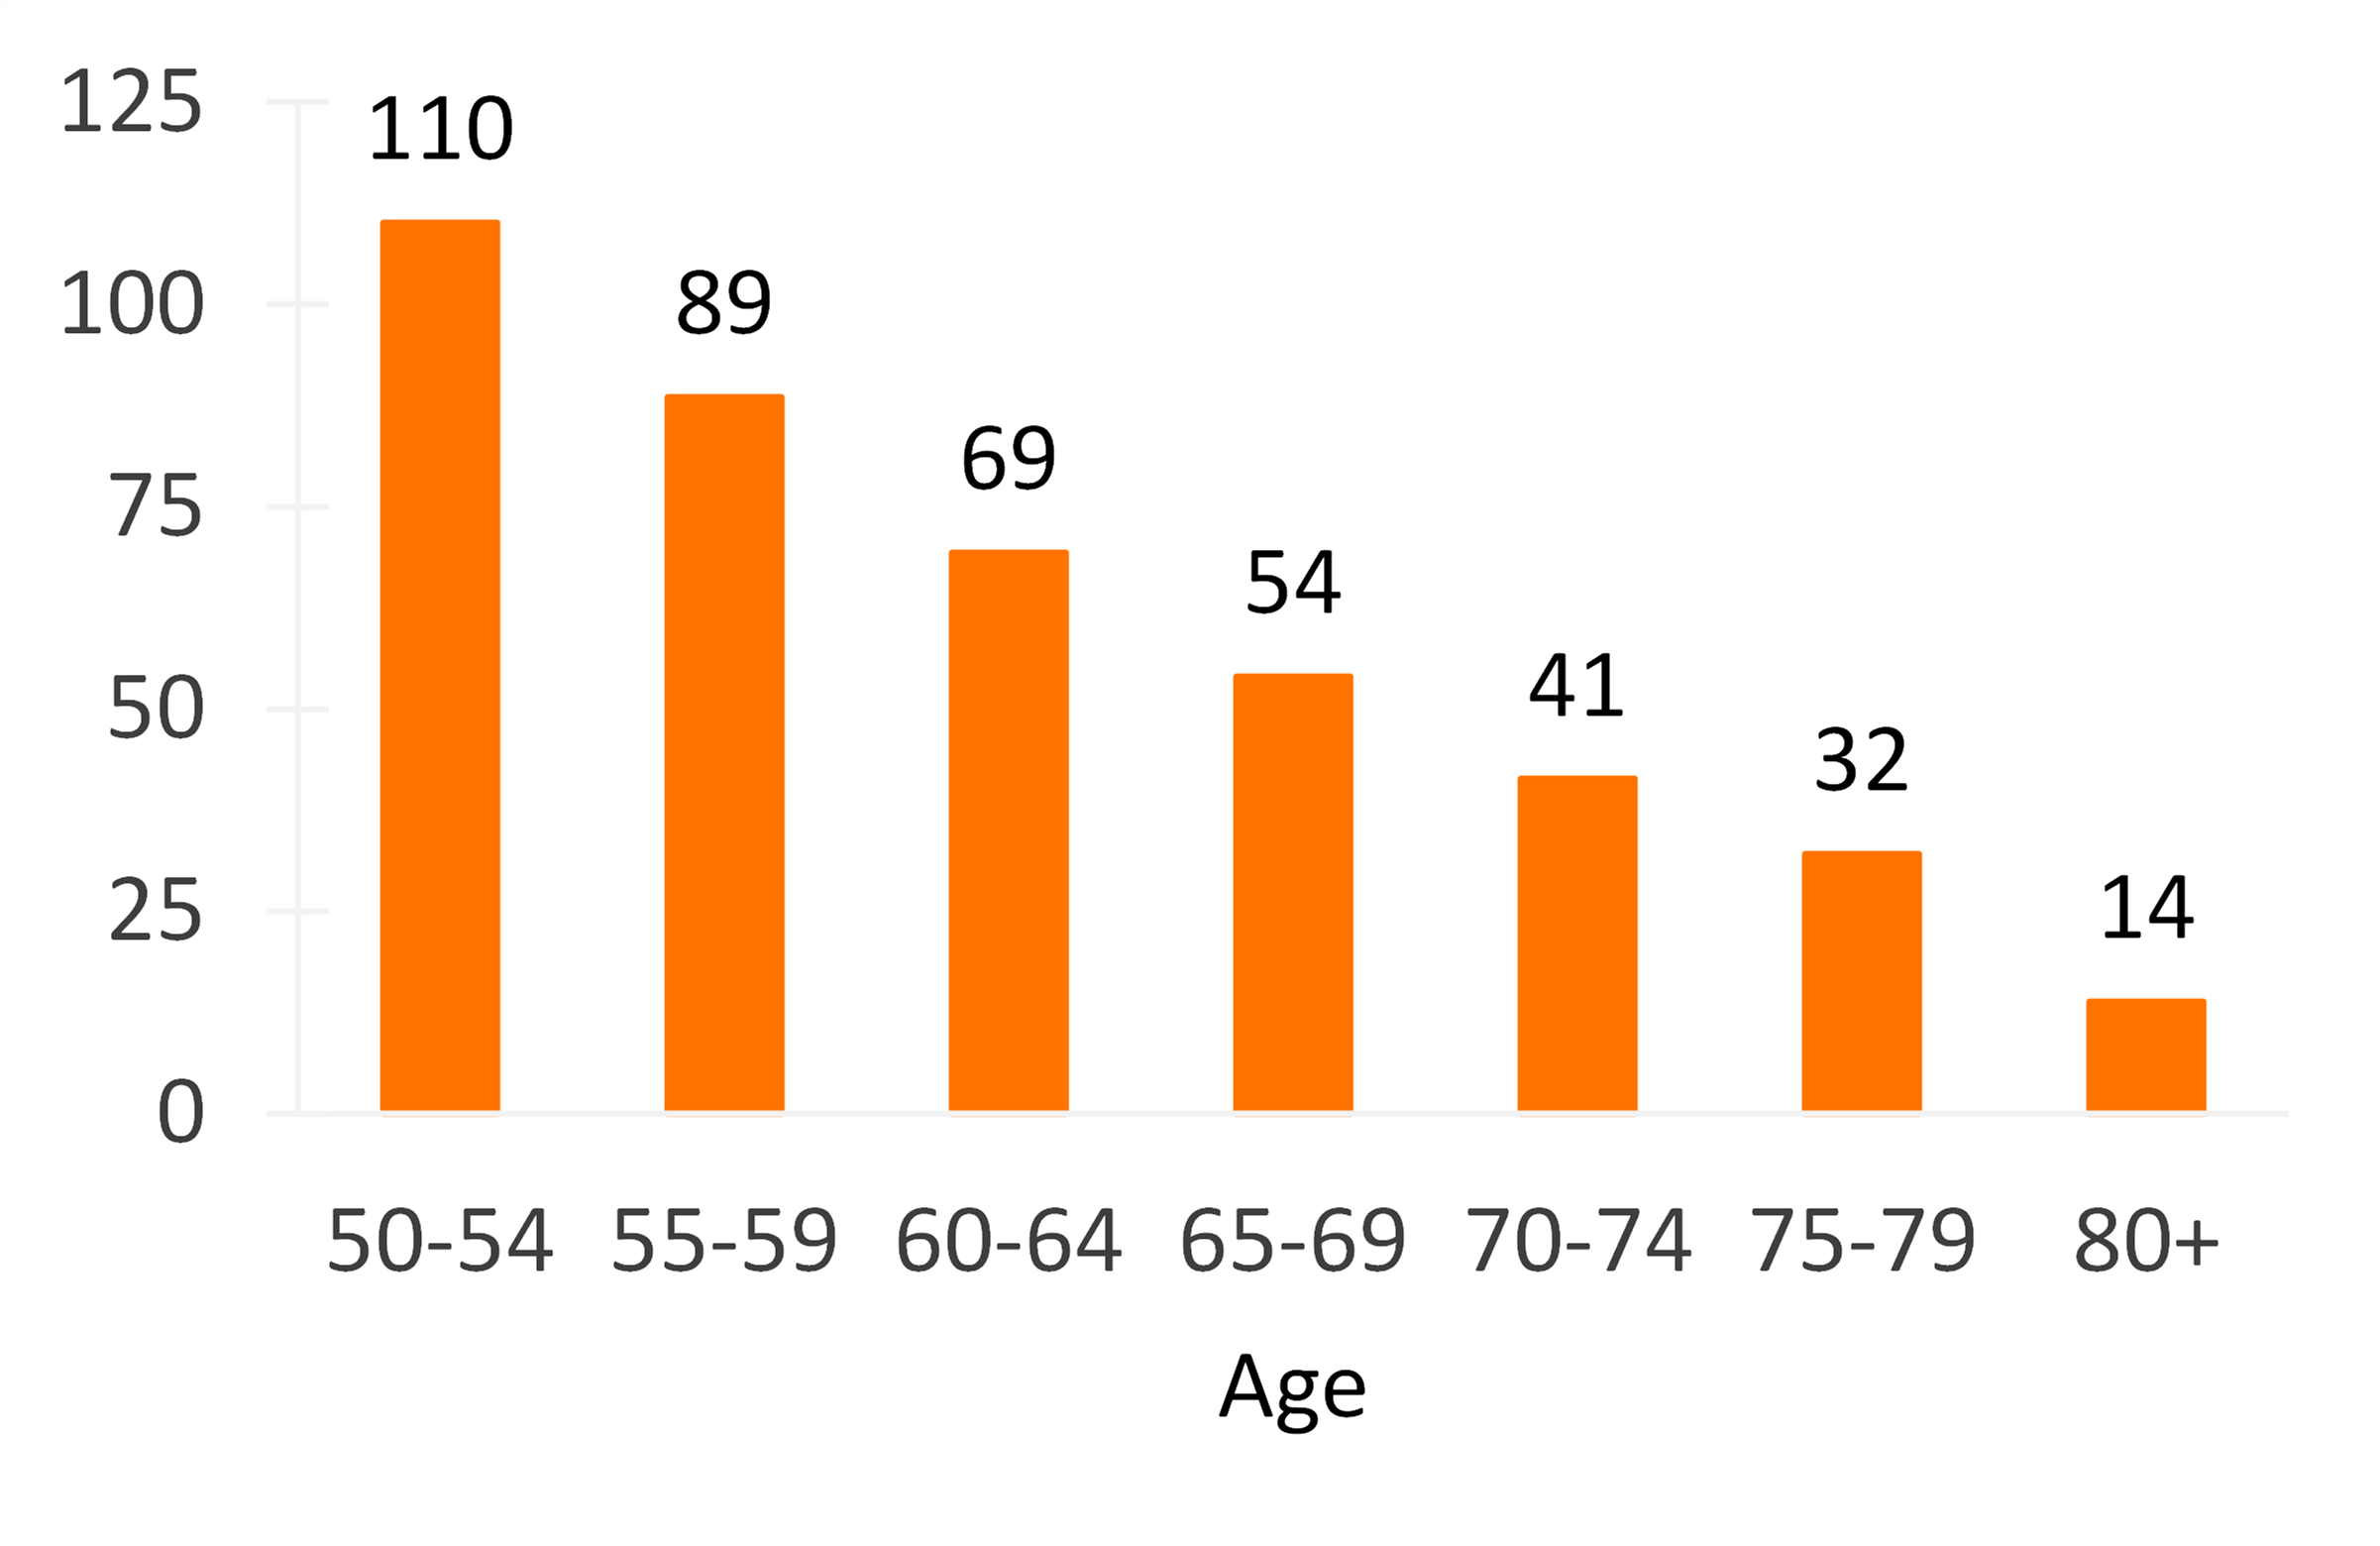
Figure 3 illustrates the prevalence rate of cohabitation among older adults by age group. Overall, the prevalence rate of cohabitation decreases with age.
- The highest prevalence rate of cohabitation exists among those aged 50-54 (110 per 1,000 unmarried older adults).
- The lowest prevalence rate of unmarried older adults cohabiting exists among men and women over the age of 80 (14 cohabiting per 1,000 unmarried adults), a nearly eight-fold difference.
Note: Prevalence rate of cohabitors are represented as the number of household heads cohabiting aged 50 and older per 1,000 unmarried household heads aged 50 and older
Figure 3. Prevalence Rate of Unmarried Older Adults Cohabiting by Age Group, 2019

Prevalence Rate of Unmarried Older Adults Cohabiting by Gender
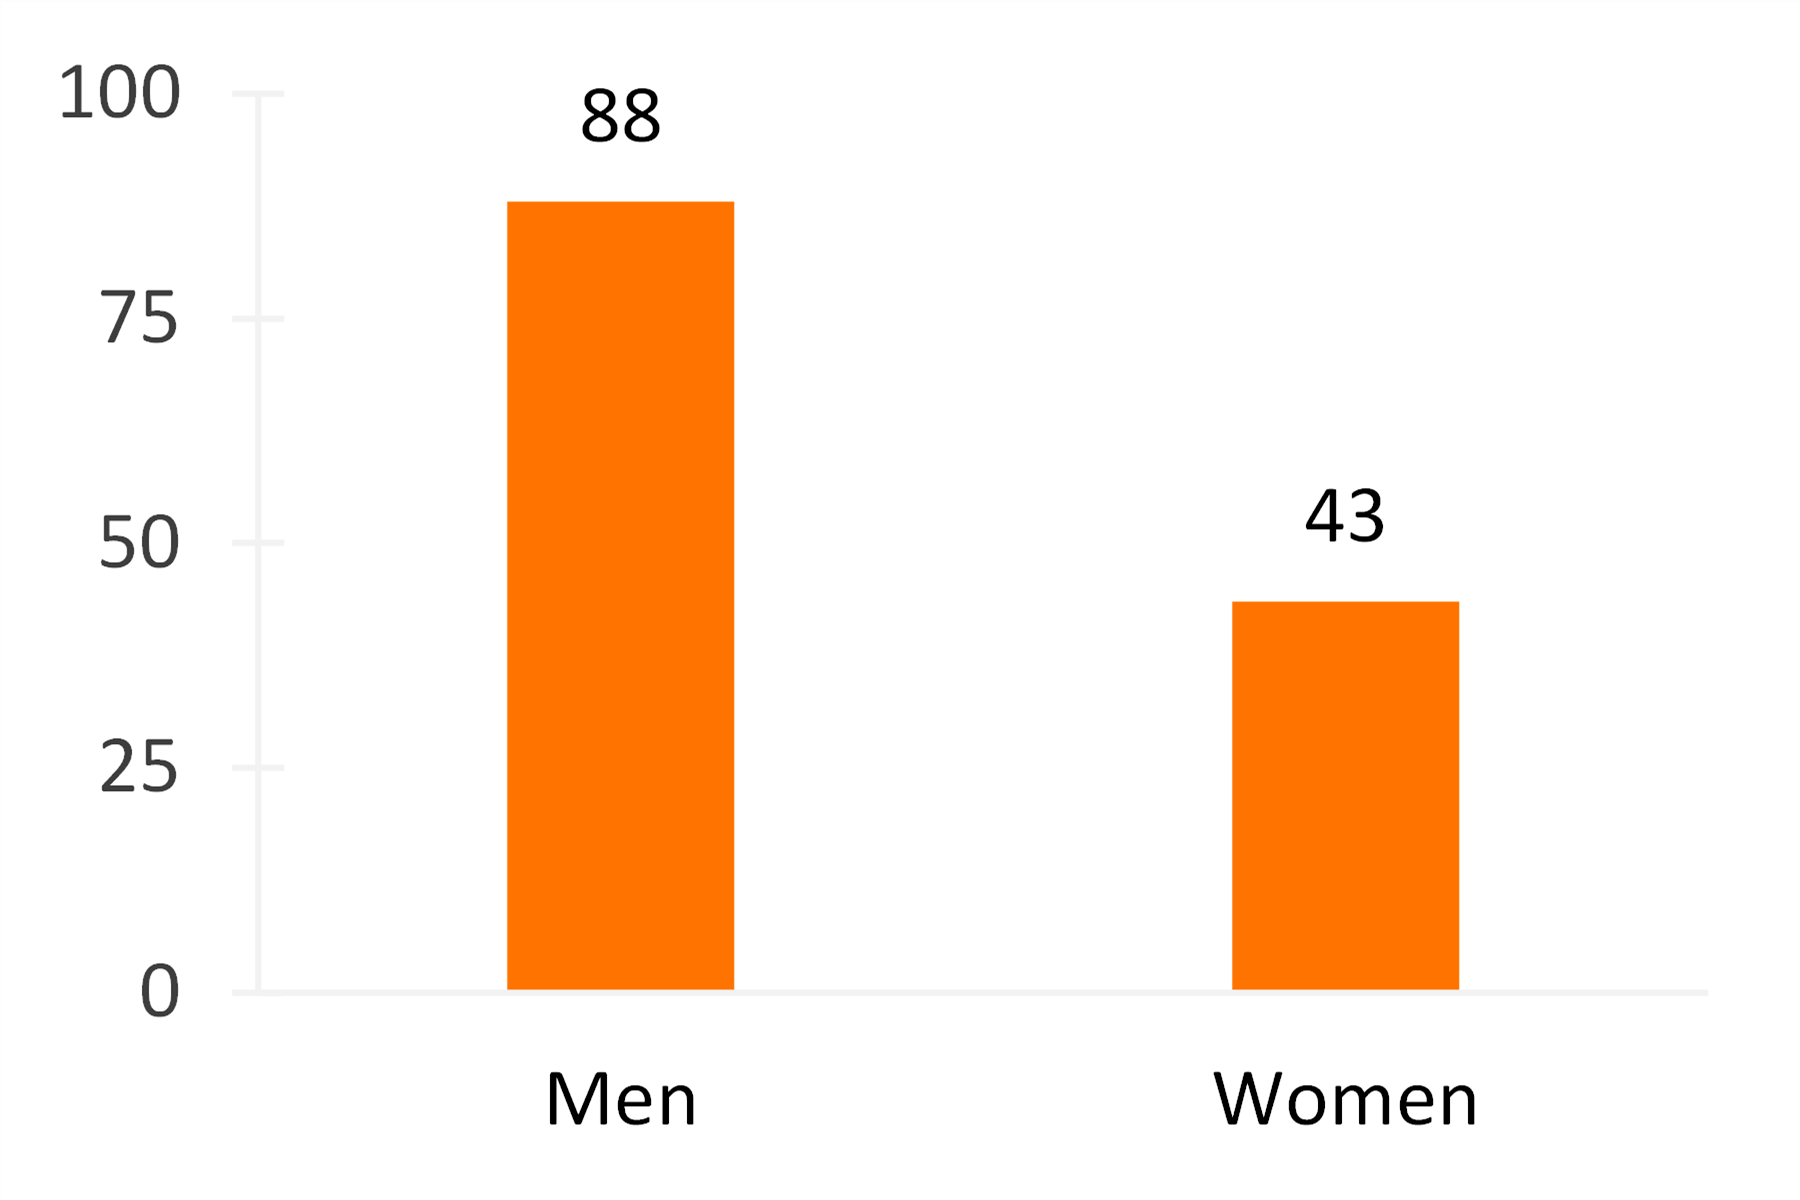
- In 2019 an estimated 13.1 million older adult men were unmarried. Of these men, 1.1 million were cohabiting.
- Conversely, an estimated 22.0 million older adult women were unmarried, with an estimated 960,000 cohabiting.
Note: Prevalence rate of cohabitors are represented as the number of household heads cohabiting aged 50 and older per 1,000 unmarried household heads aged 50 and older
Figure 4. Prevalence Rate of Unmarried Older Adults Cohabiting by Gender, 2019

Data Source:
U.S Census Bureau American Community Survey, 1-year estimates, 2019
References:
Hemez, P. & Brown, S.L. (2016). Cohabitation in middle and later life. Family Profiles, FP-16-20. Bowling Green, Ohio: National Center for Family & Marriage Research. https://www.bgsu.edu/ncfmr/resources/data/family-profiles/hemez-brown-cohabitation-middle-later-life-2014-fp-16-20.html
Reynolds, L. & Brown, S. L. (2020). Age variation in cohabitation, 2018. Family Profiles, FP-20-12. Bowling Green, OH: National Center for Family & Marriage Research. https://doi.org/10.25035/ncfmr/fp-20-12
Suggested Citation:
Julian, C. A. (2022). Prevalence of cohabitation among unmarried older adults. Family Profiles, FP-22-10. Bowling Green, OH: National Center for Family & Marriage Research. https://doi.org/10.25035/ncfmr/fp-22-10
Updated: 11/07/2025 04:14PM


