Unintended Births: Variation Across Social and Demographic Characteristics
Family Profile No. 2, 2021
Author: Karen Benjamin Guzzo
Disparities in unintended childbearing remain a public health concern (Healthy People 2030). Using the 2015-19 cycle of the National Survey of Family Growth, we examine sociodemographic variation in birth intendedness, looking at births occurring between 2014-2018 to women aged 15-49. Birth intendedness is based on a series of questions in which women are asked to characterize each birth as on time, mistimed (wanted but occurring earlier than desired), or unwanted (the respondent did not want any births at all, or any additional births). When births are reported as too early, women were then asked how much earlier than desired the birth occurred. We categorize mistimed births into two groups: slightly mistimed (less than two years earlier than desired) or seriously mistimed (two or more years too early). This profile is an update of FP-17-09(1) and the second in a series on unintended childbearing in the U.S.
Birth Intendedness by Birth Order
Overall, 69% of all recent births to women aged 15-49 between 2014 and 2018 were intended; that is, they were reported as on time (not shown).
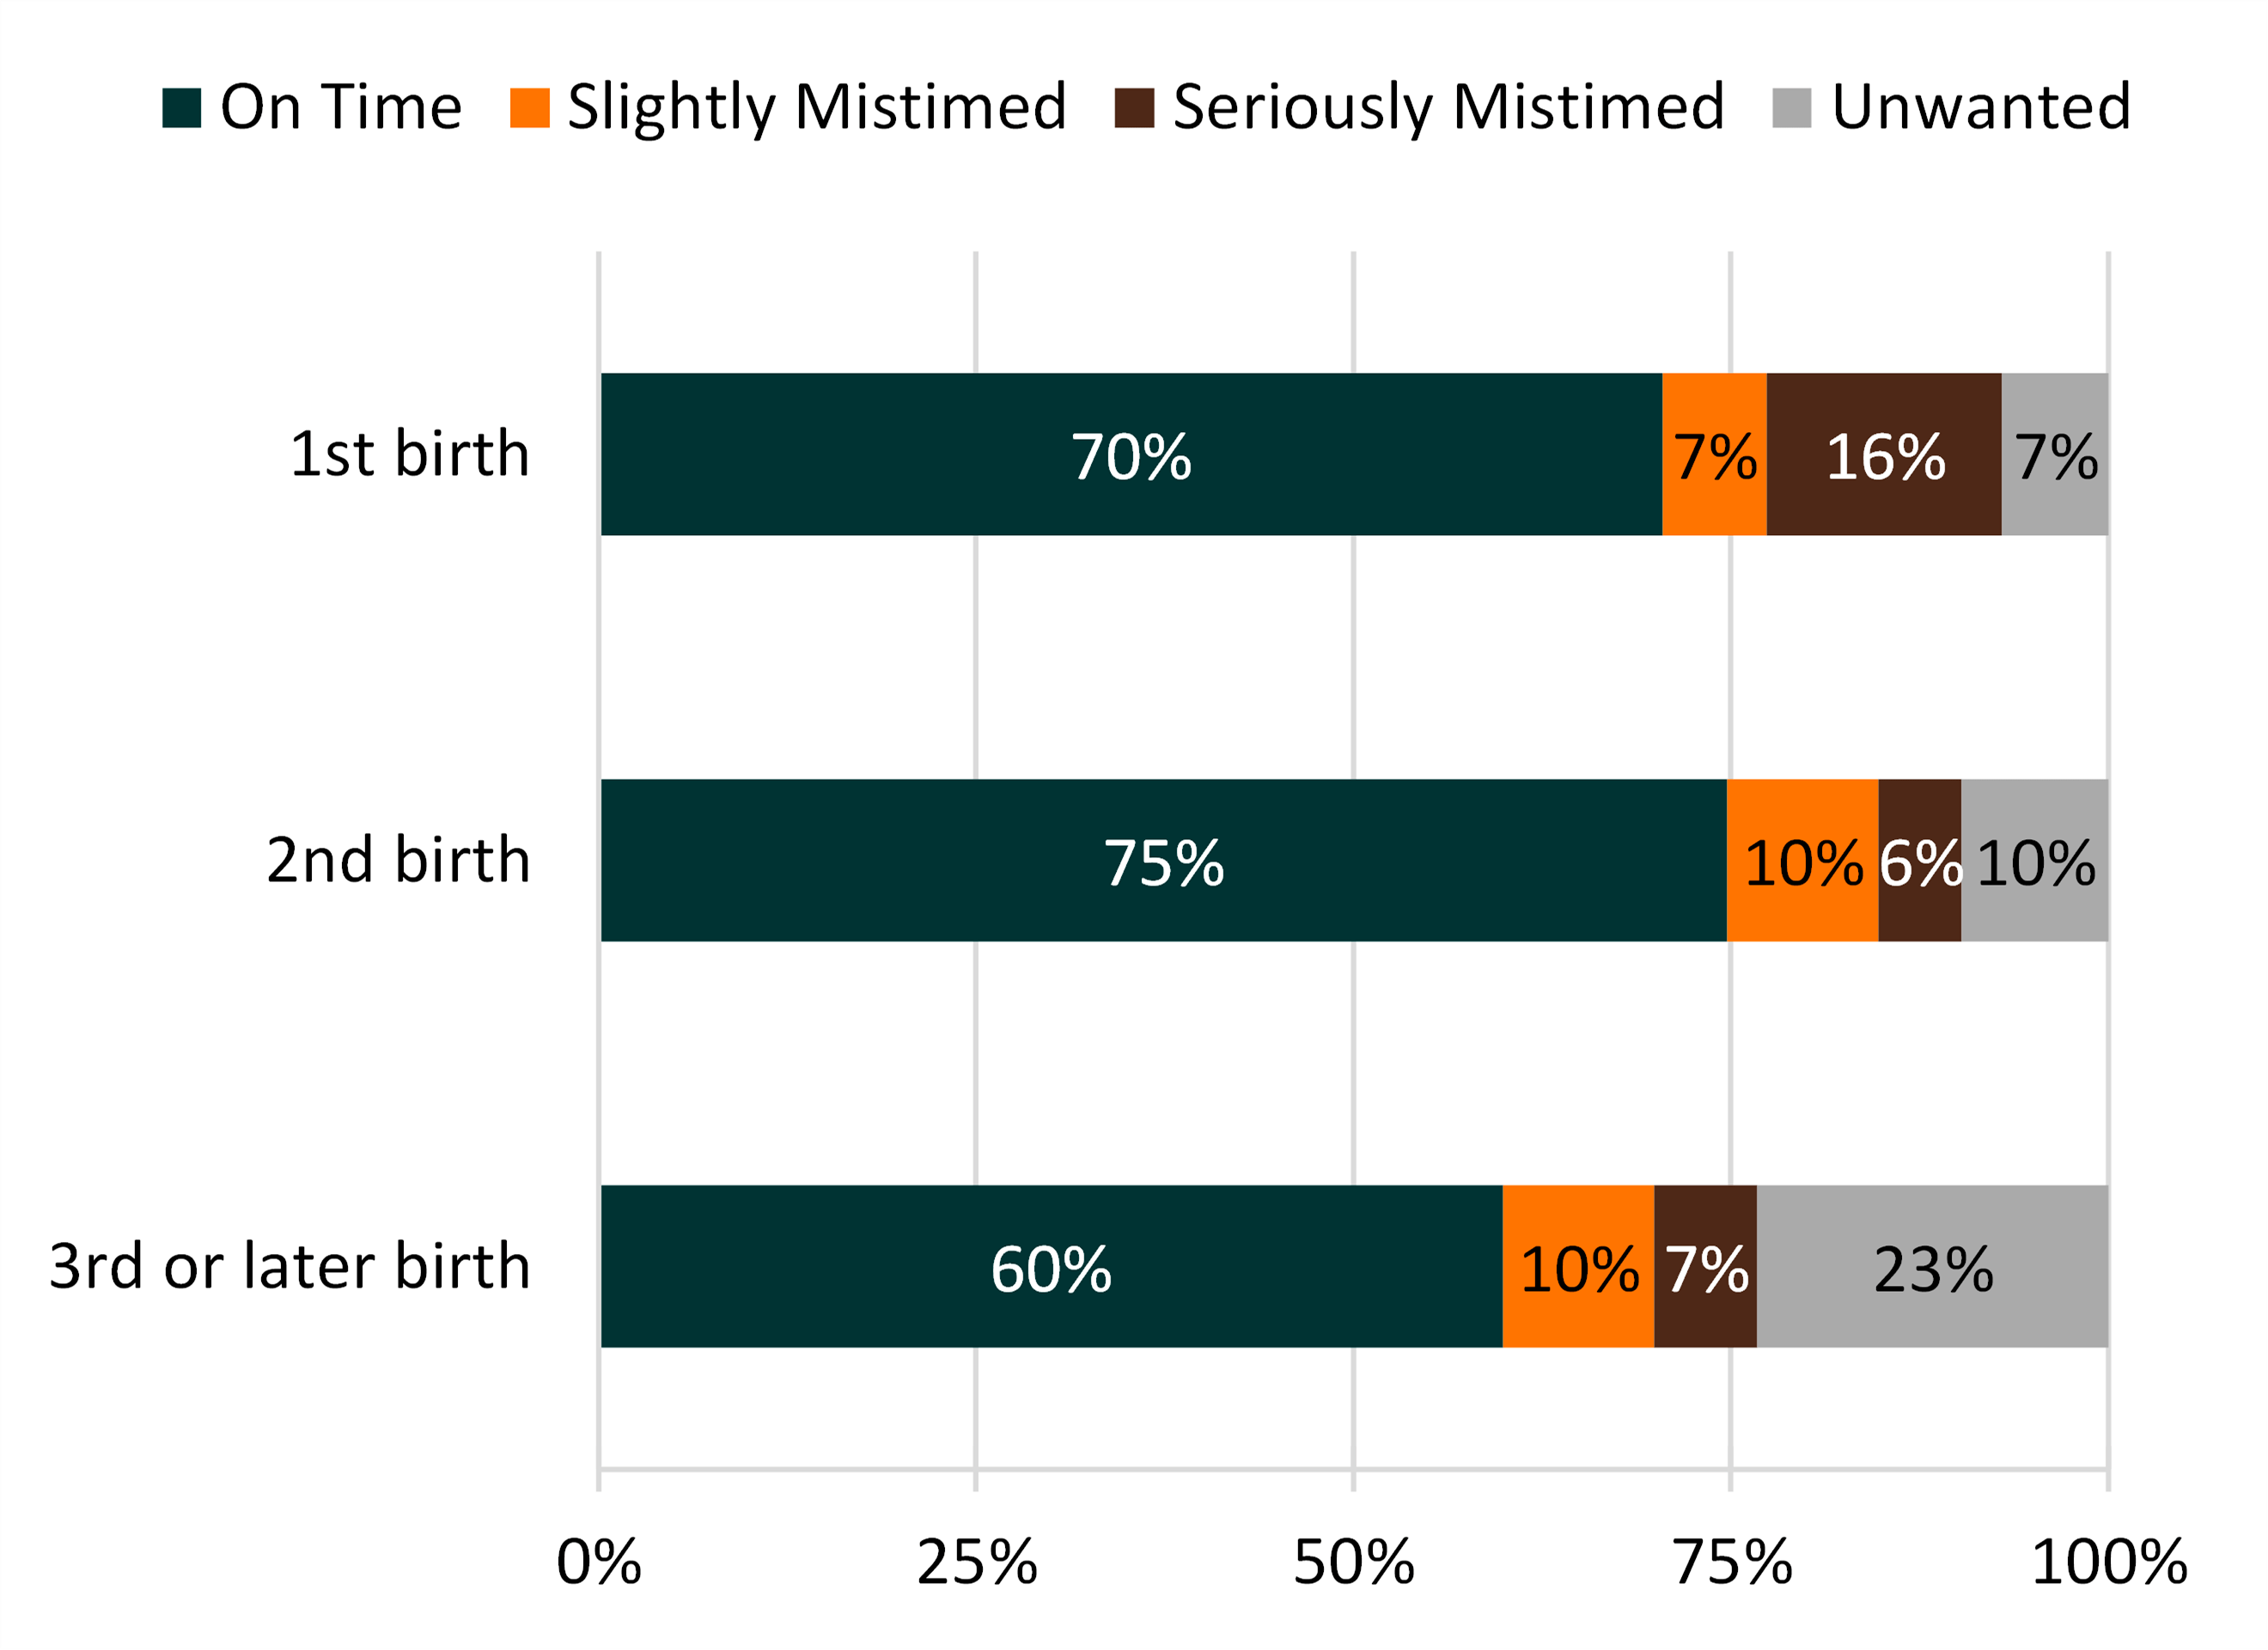
- The majority of births across all birth orders were on time, with the highest proportion of on-time births occurring among second births (75%).
- Seriously mistimed births – those more than two years too early – were most common among first births (16%).
- Slightly mistimed births – those two years too early or less – comprised a larger share of second and third or later births (10% for both) than first births (7%).
- Third or later births were more often unwanted (23%) than second (10%) or first (7%) births.
Figure 1. Variation in Intendedness by Birth Order
Birth Intendedness by Union Status
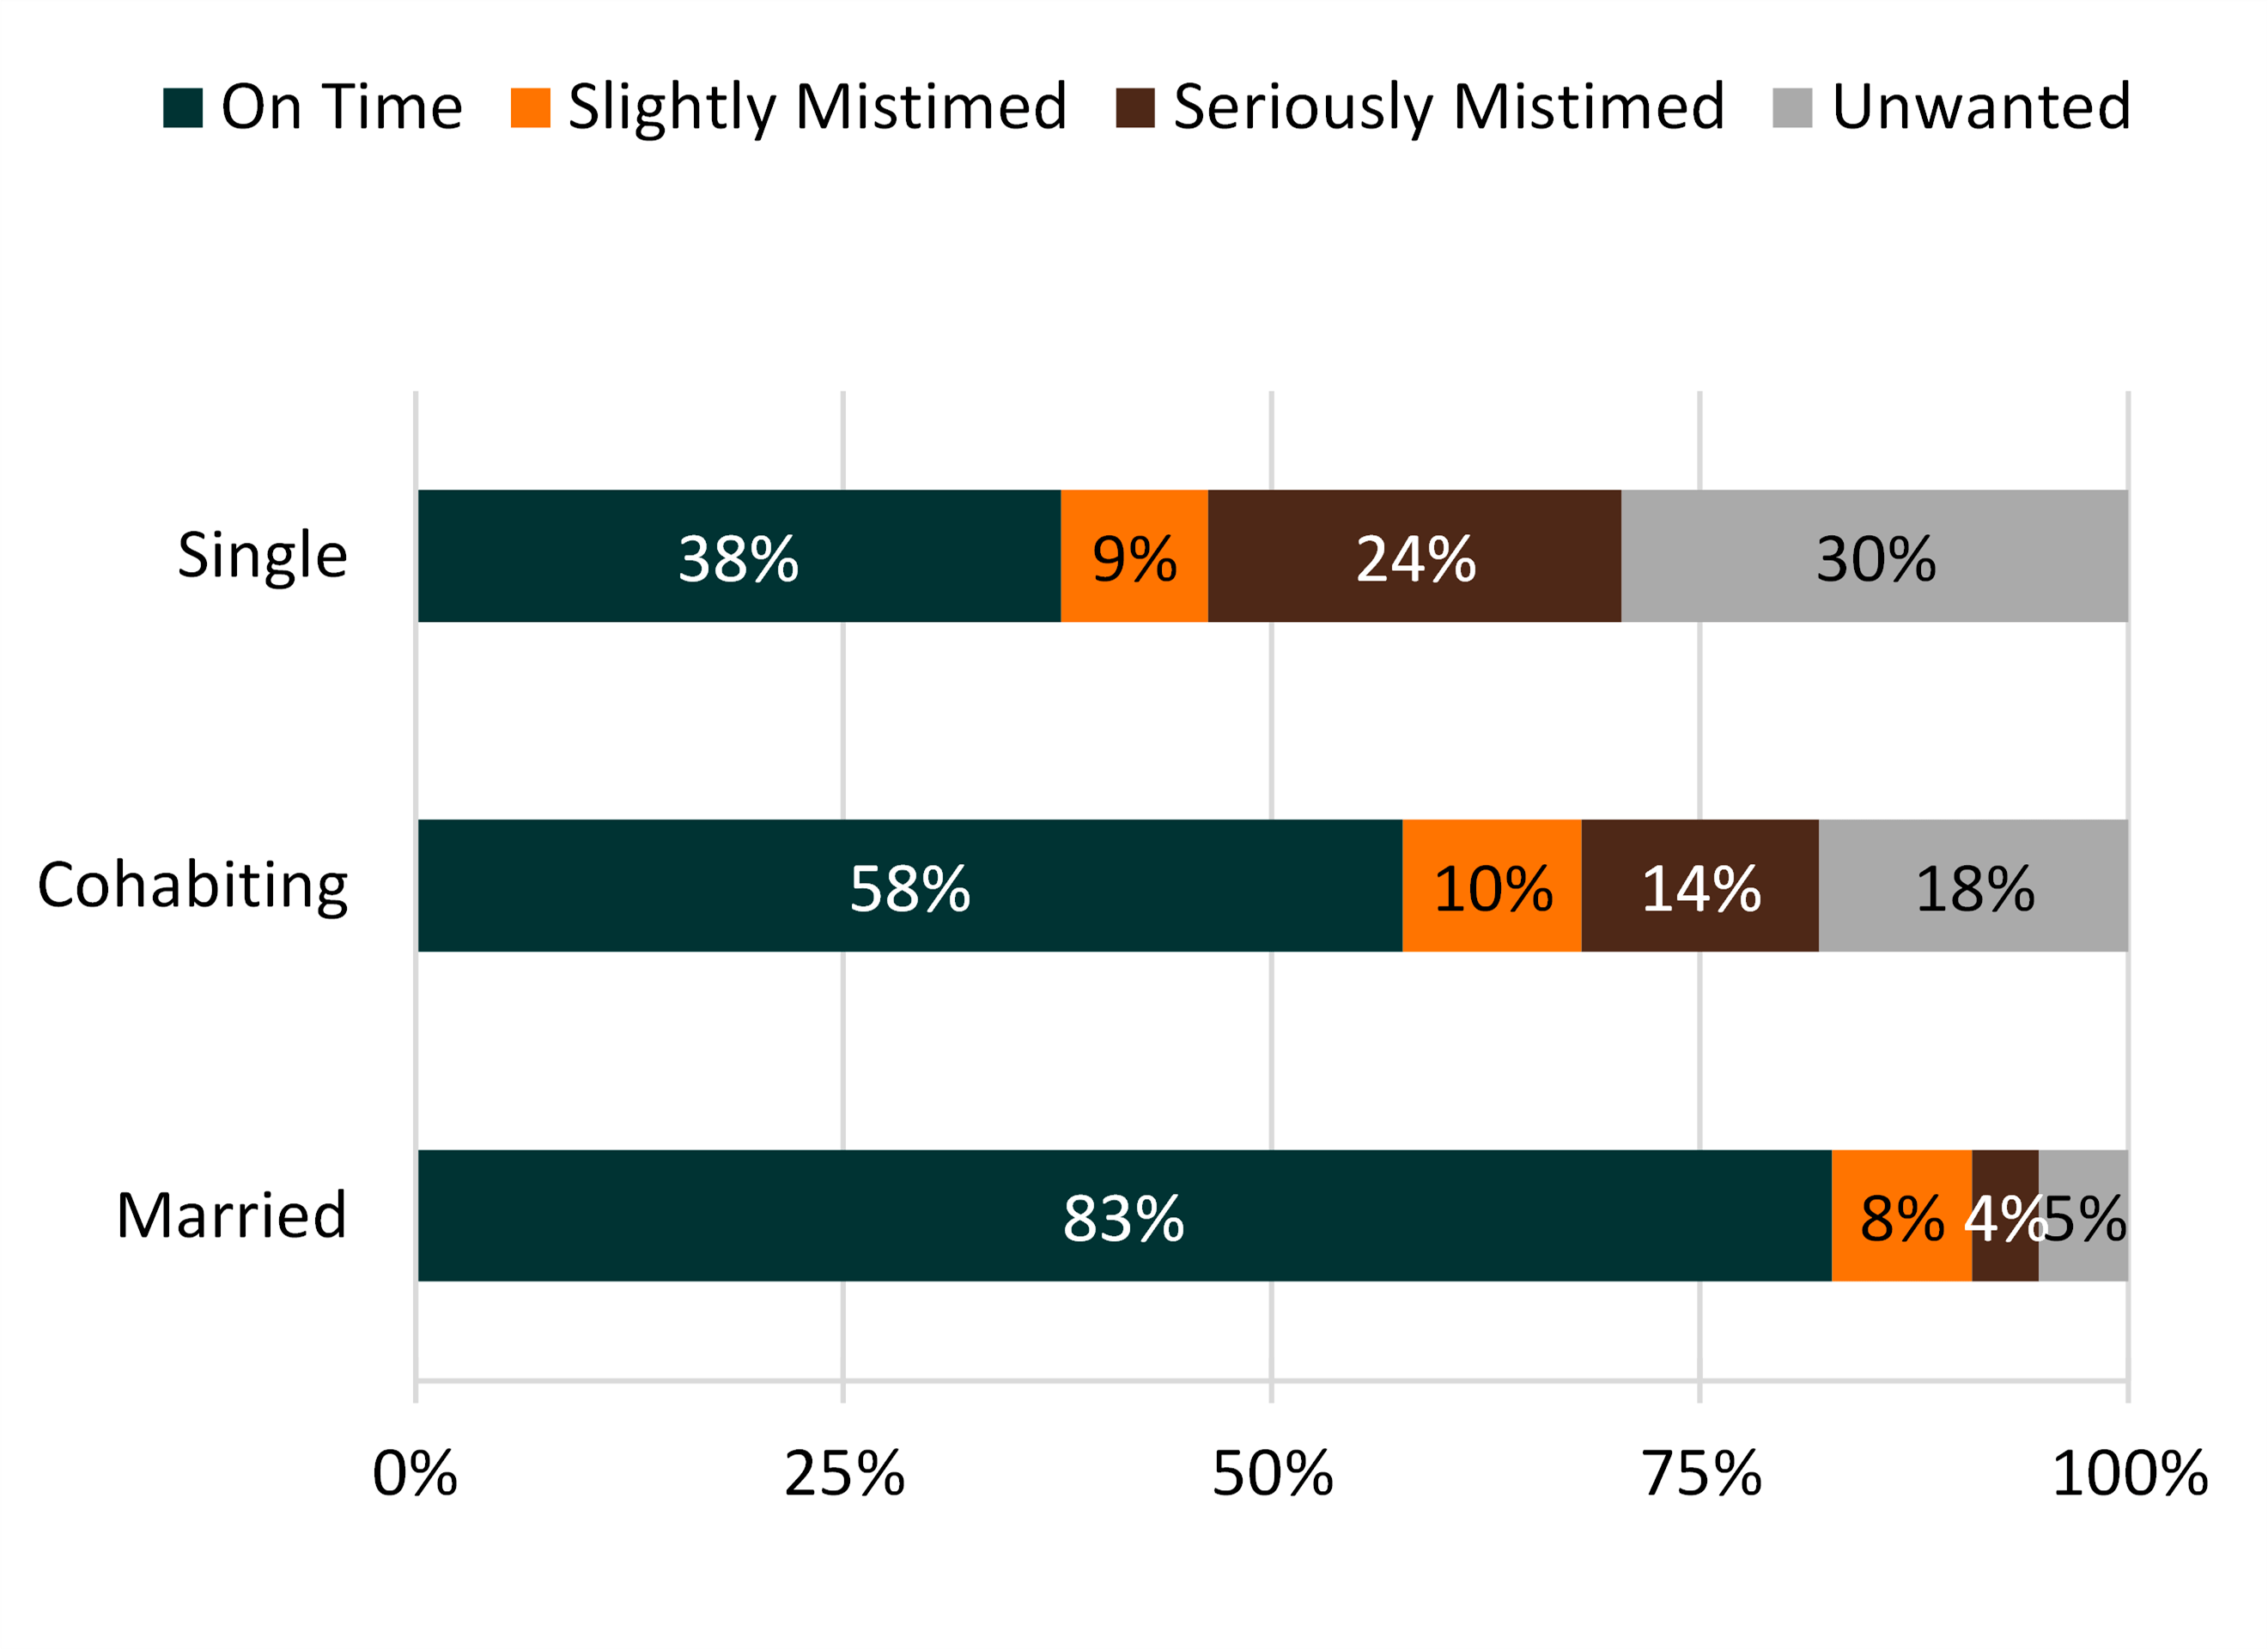
- A large majority (83%) of marital births were on time compared to 58% of cohabiting births and 38% of single births.
- Mistimed births occurred more often among single (33%) and cohabiting (24%) women than married women (12%).
- The share of recent births to single women that were seriously mistimed was six times higher than for married women.
- Nearly one in three (30%) births to single women was unwanted, considerably higher than the 18% of such births to cohabiting women and 5% of such births to married women.
- The share of recent births to single women that were seriously mistimed was six times higher than for married women.
Figure 2: Variation in Intendedness by Union Status
Birth Intendedness by Educational Attainment
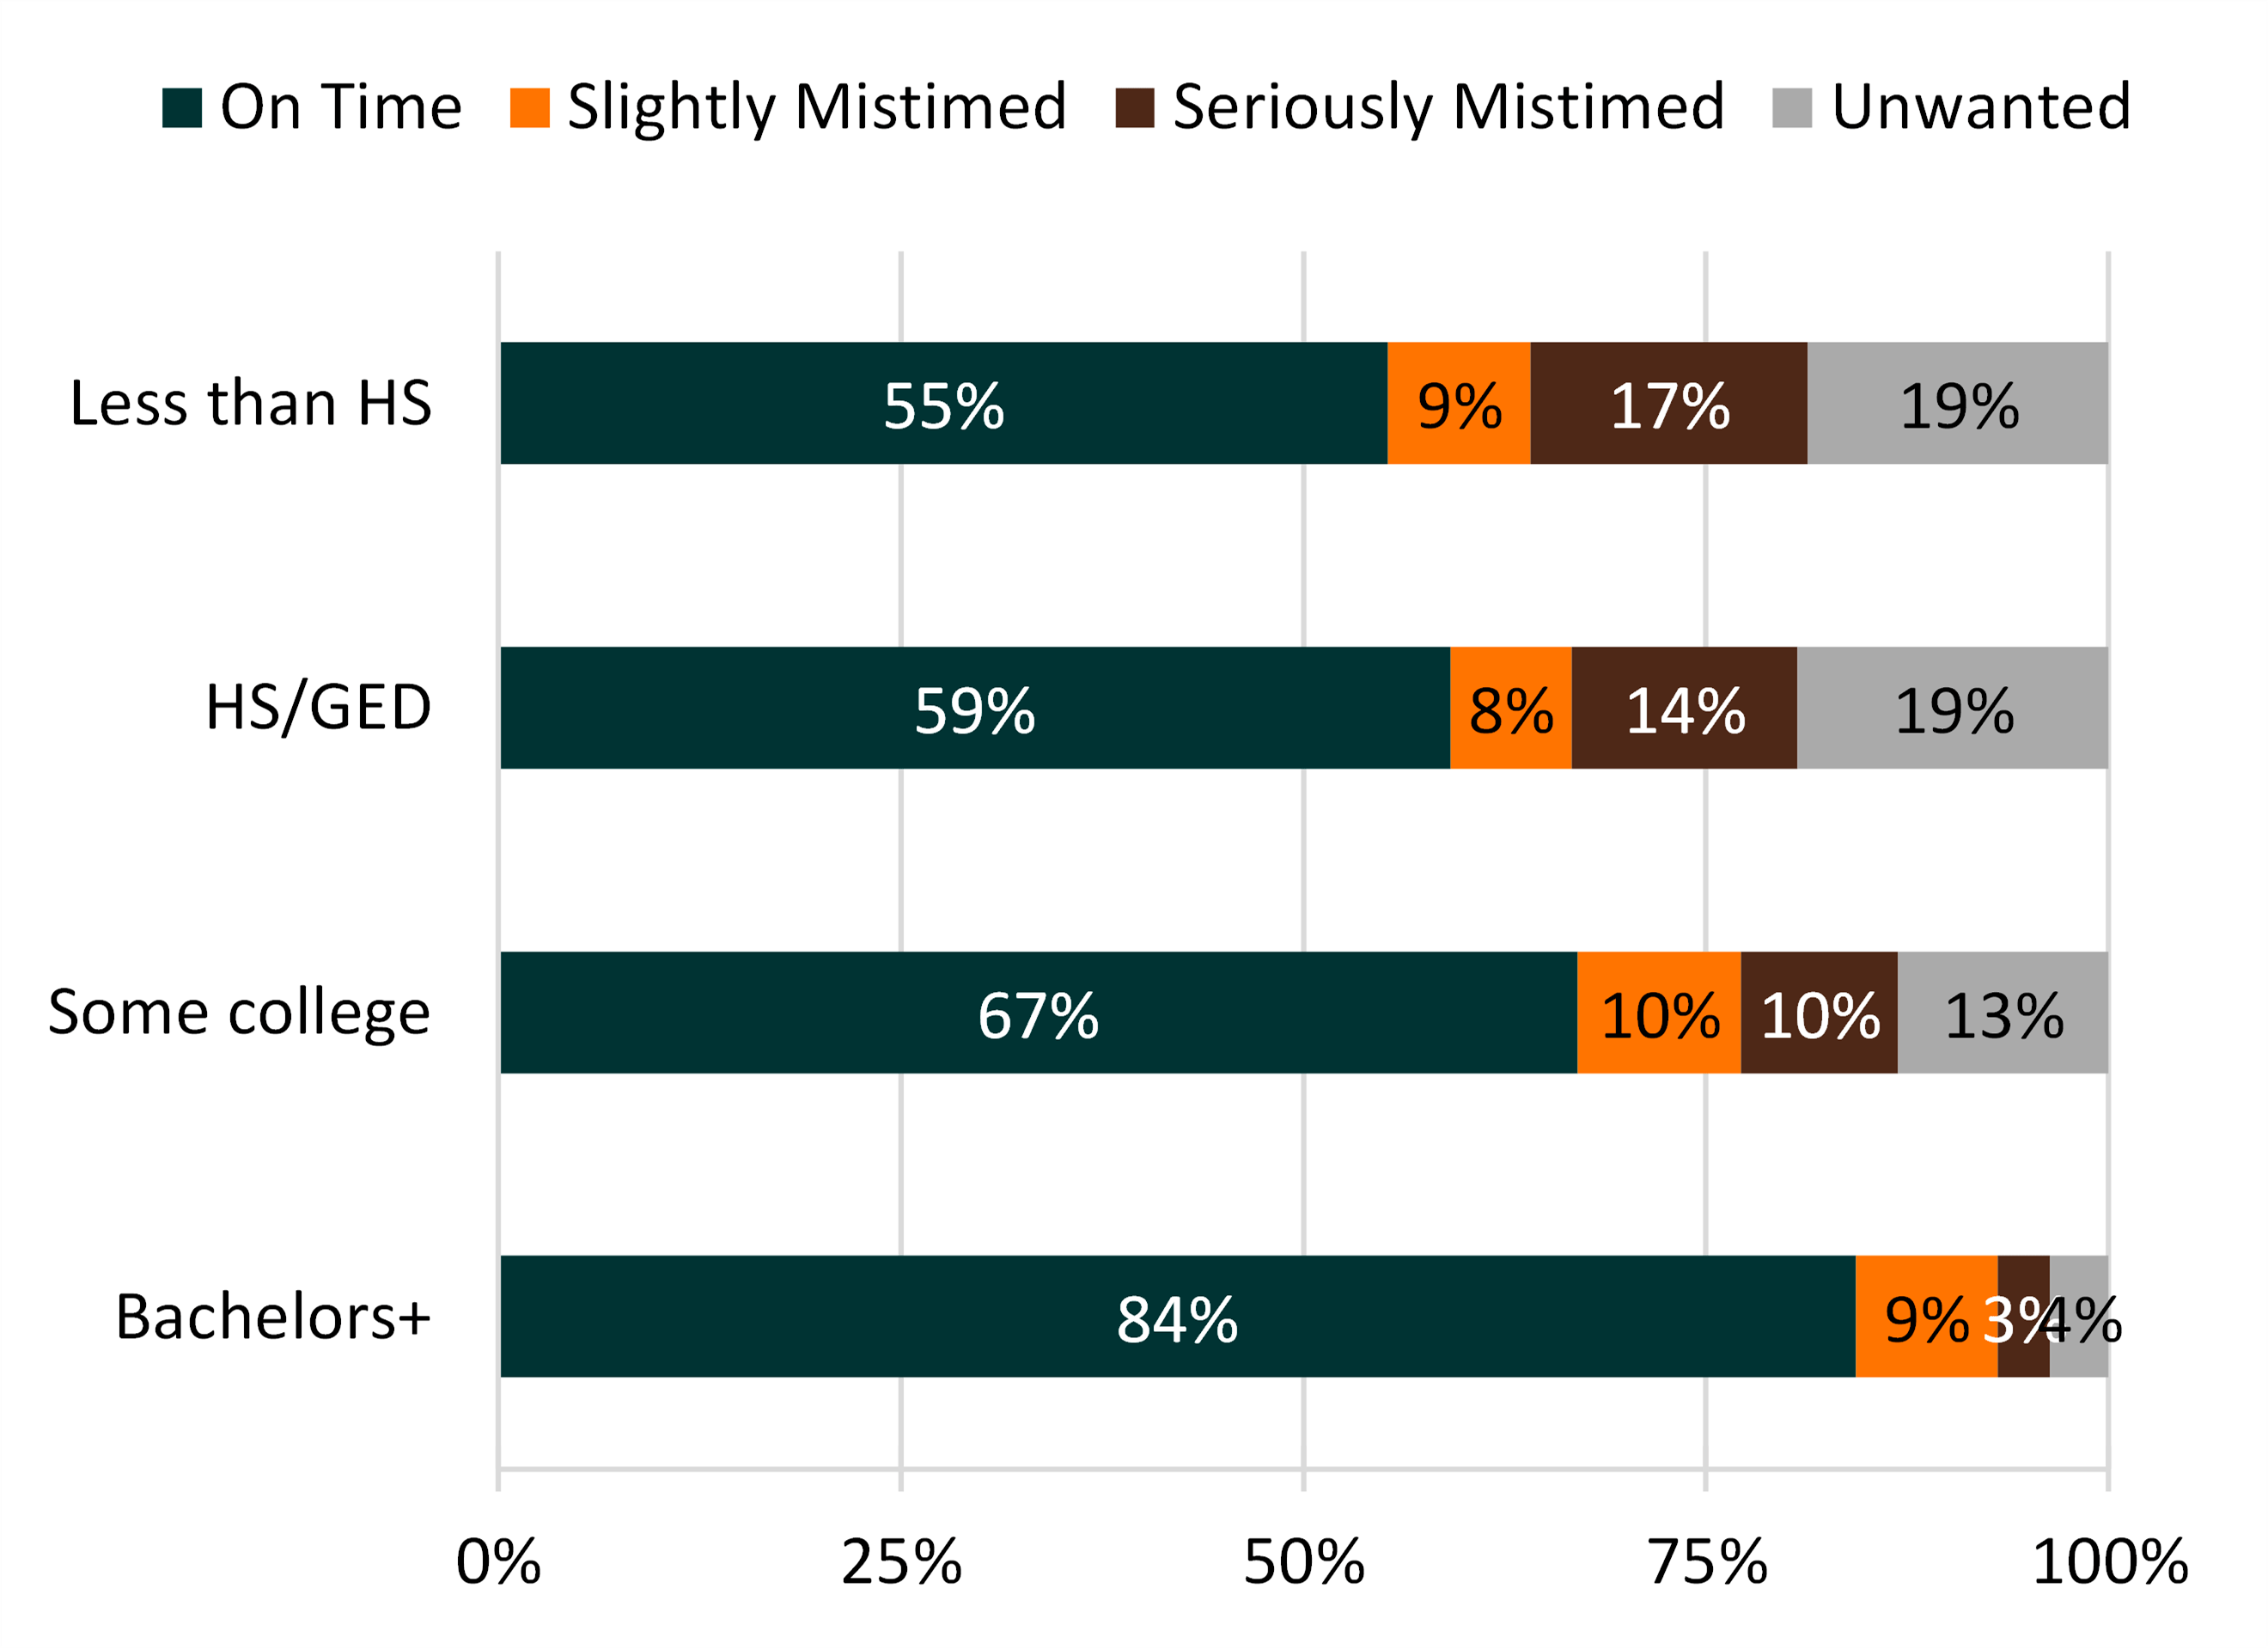
There was a clear educational gradient to unintended fertility among recent births.
- Most recent births (84%) to women with a college degree were on time compared to just over half (55%) of births to women without a high school diploma.
- Just 3% of births to women with a college degree were seriously mistimed, with much higher percentages among women with less than a college degree (ranging from 10%-17%).
- Only 4% of births to women with a college degree were unwanted, while one in five of such births (19%) to women without a high school degree was unwanted.
Figure 3: Variation in Intendedness by Educational Attainment
Birth Intendedness by Race & Ethnicity
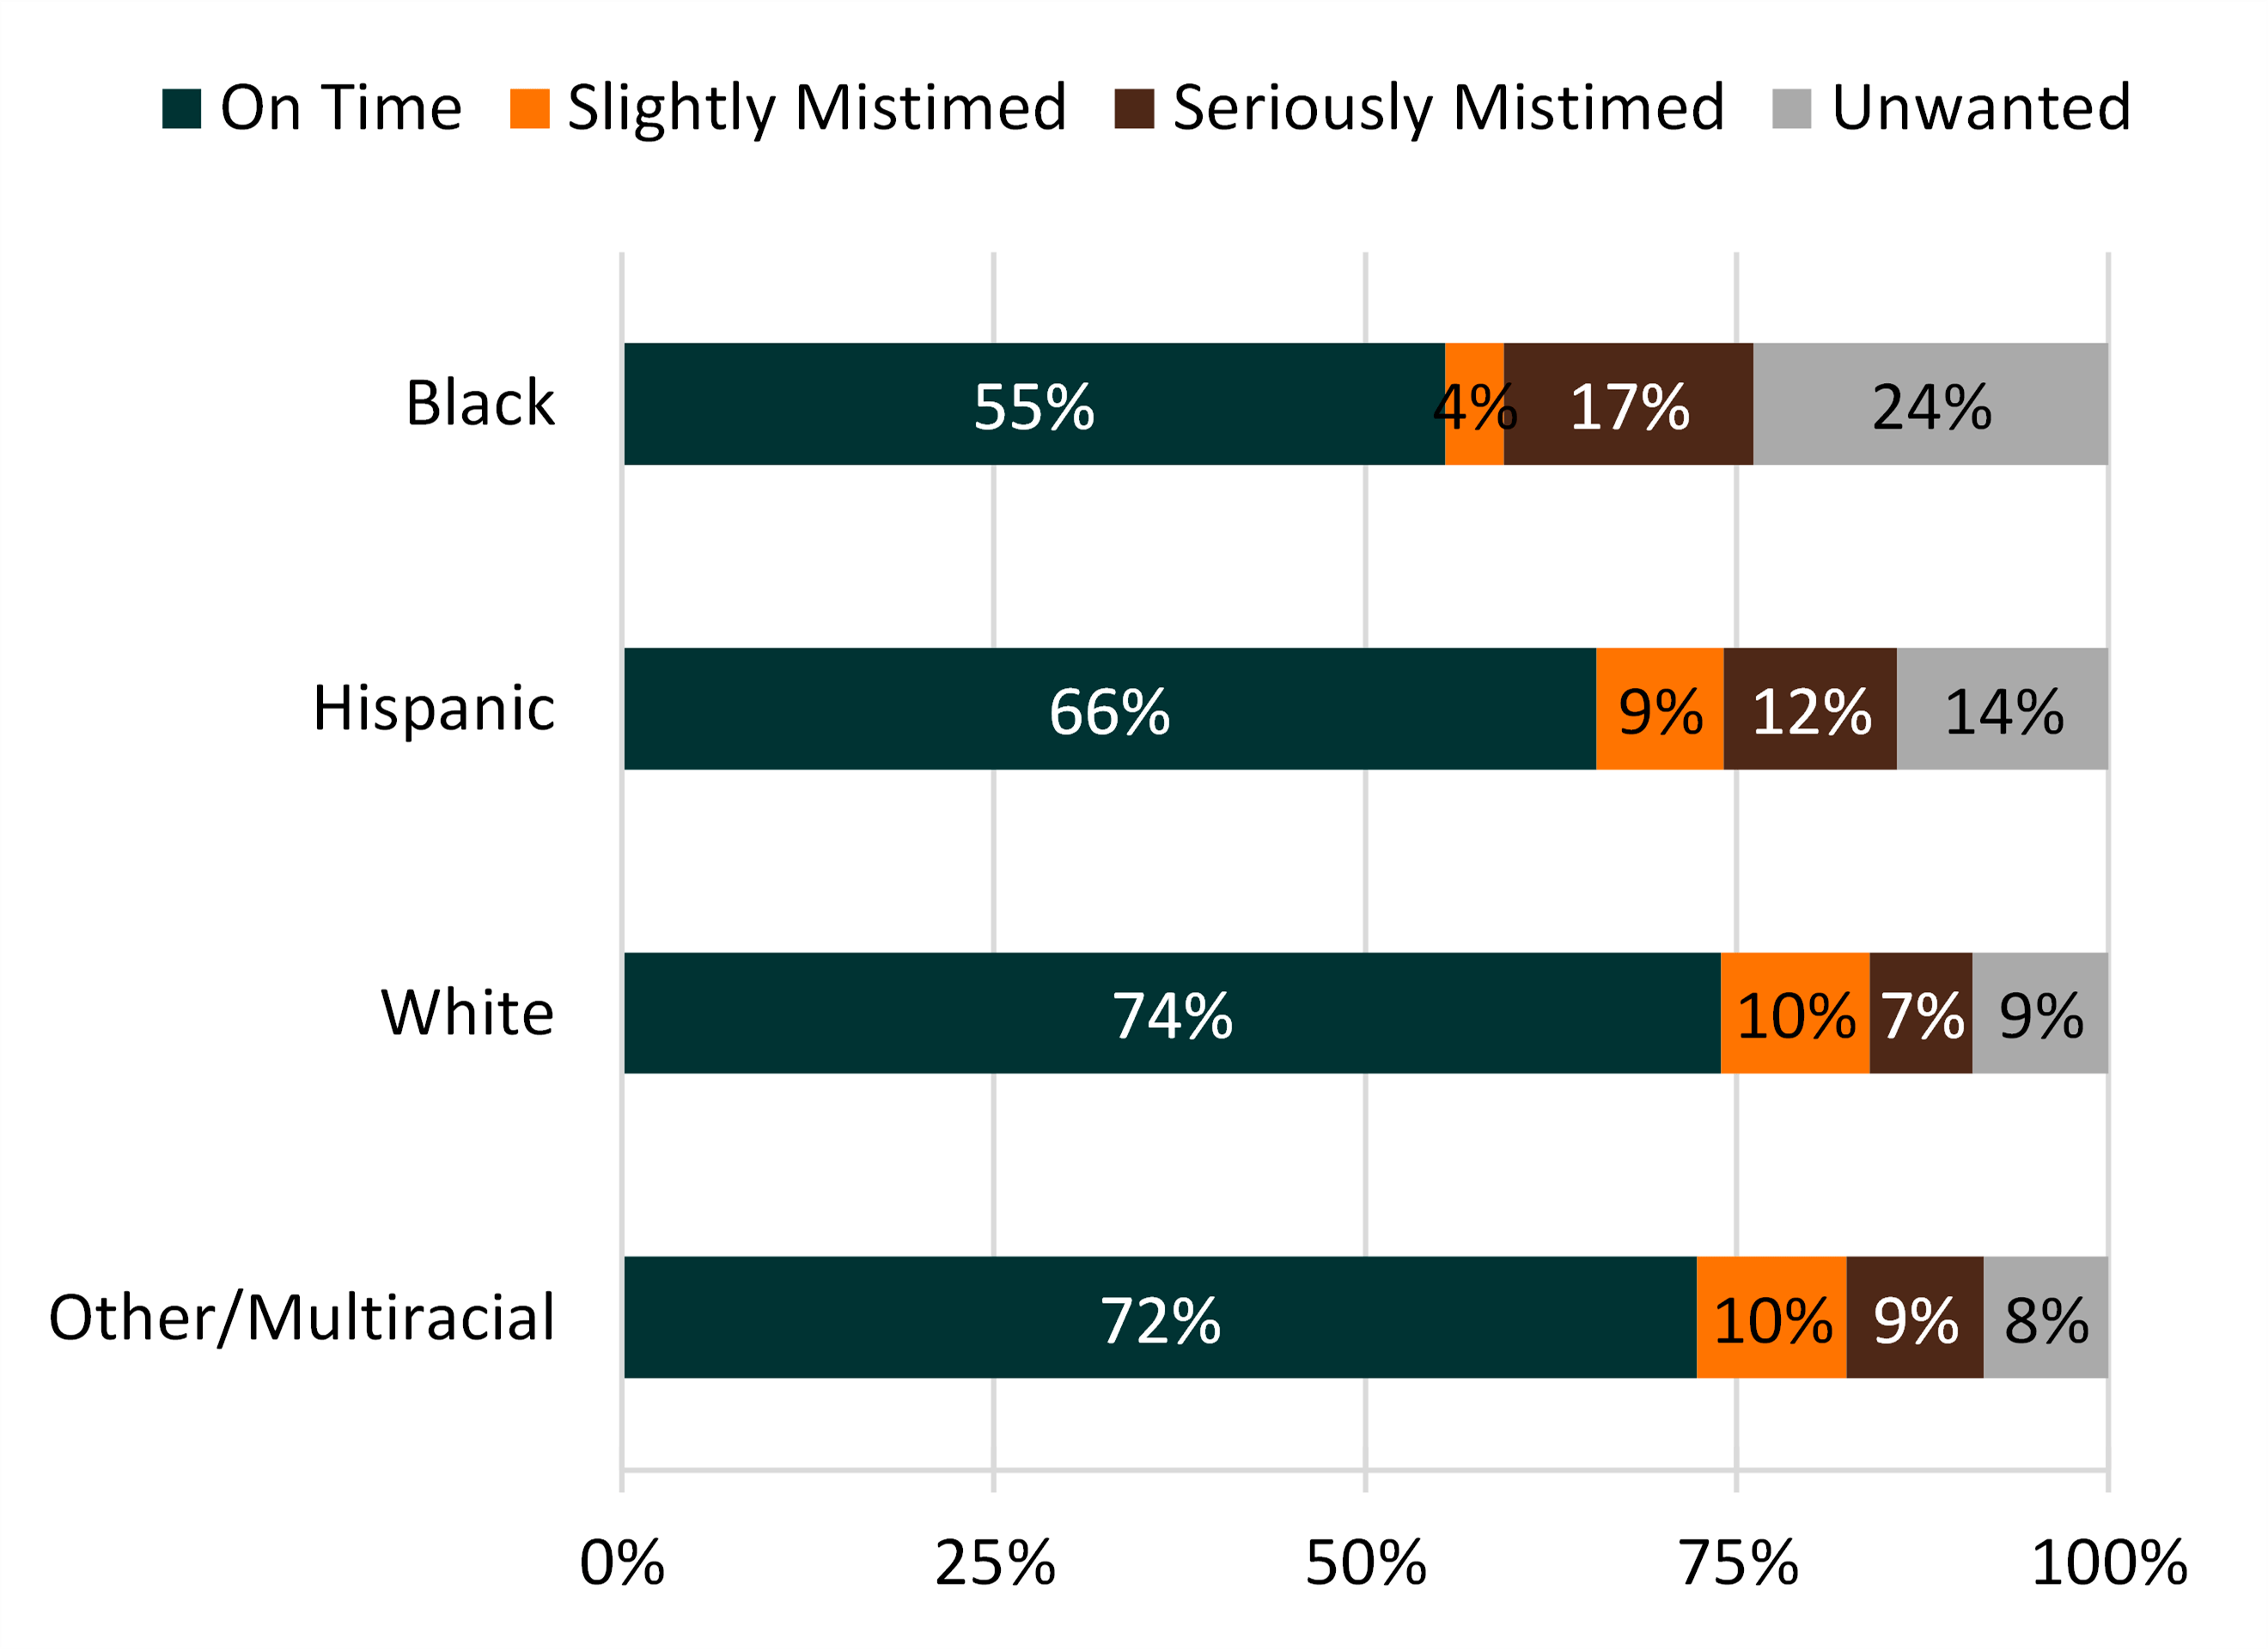
The majority of recent births were on time across racial-ethnic groups.
- The proportion of births that were on time ranged from 55% among Black women to 74% among White women.
- Mistimed births occurred most often among Hispanic and Black women (21%) and least often among White women (17%).
- Black women had the highest share of births characterized as unwanted (24%) whereas births to multiracial and other-race women (8%) were least often unwanted.
Figure 4: Variation in Intendedness by Race & Ethnicity
Data Source
- National Center for Health Statistics (NCHS). 2015-17 and 2017-2019 National Survey of Family Growth Public-Use Data and Documentation. Hyattsville, MD: CDC National Center for Health Statistics. https://www.cdc.gov/nchs/nsfg/index.htm
Reference
- Healthy People 2030 (2021). Reduce the proportion of unintended pregnancies, FP-01. Washington, DC: U.S. Department of Health and Human Services, Office of Disease Prevention and Health Promotion. Healthy People 2030 | health.gov Accessed 1/7/21.
Suggested Citation
- Guzzo, K. B. (2021). Unintended births: Variation across social and demographic characteristics. Family Profiles, FP-21-02. Bowling Green, OH: National Center for Family & Marriage Research. https://doi.org/10.25035/ncfmr/fp-21-02
Footnote
1. The 2015-2019 cycle of the NSFG expanded its age range to 49 (up from age 45 in prior cycles) and released a slightly different set of variables on race-ethnicity. As such, the estimates in this profile are not directly comparable to profile FP-17-09.
This project is supported with assistance from Bowling Green State University. From 2007 to 2013, support was also provided by the U.S. Department of Health and Human Services, Office of the Assistant Secretary for Planning and Evaluation. The opinions and conclusions expressed herein are solely those of the author(s) and should not be construed as representing the opinions or policy of any agency of the state or federal government.
Updated: 04/06/2021 01:32PM


