Childbearing Among Women 40 and Older
Family Profile No. 07, 2018
Author: Karen Benjamin Guzzo
As the age at first birth has continued to rise (FP-17-22), childbearing among women at the end of their childbearing years occurs more frequently. This profile examines births to women aged 40 and older. First, using data from the Centers for Disease Control and Prevention’s (CDC) Vital Statistics System, the profile documents trends from 1960-2016 in overall age-specific birth rates (all births to women in a specific age group per 1,000 women in the specified group) and first age-specific birth rates (first births to women in a specific age group per 1,000 women in the specified group). Second, the profile uses data from the CDC Wonder online database to examine the share of marital and nonmarital births to older mothers, looking at trends in overall births since 1995 and in first births since 2003 (the earliest year for which birth data is disaggregated by marital status and parity).Marriage to Divorce Ratio in the U.S., 2017.
Birth Rates for Women 40 and Older
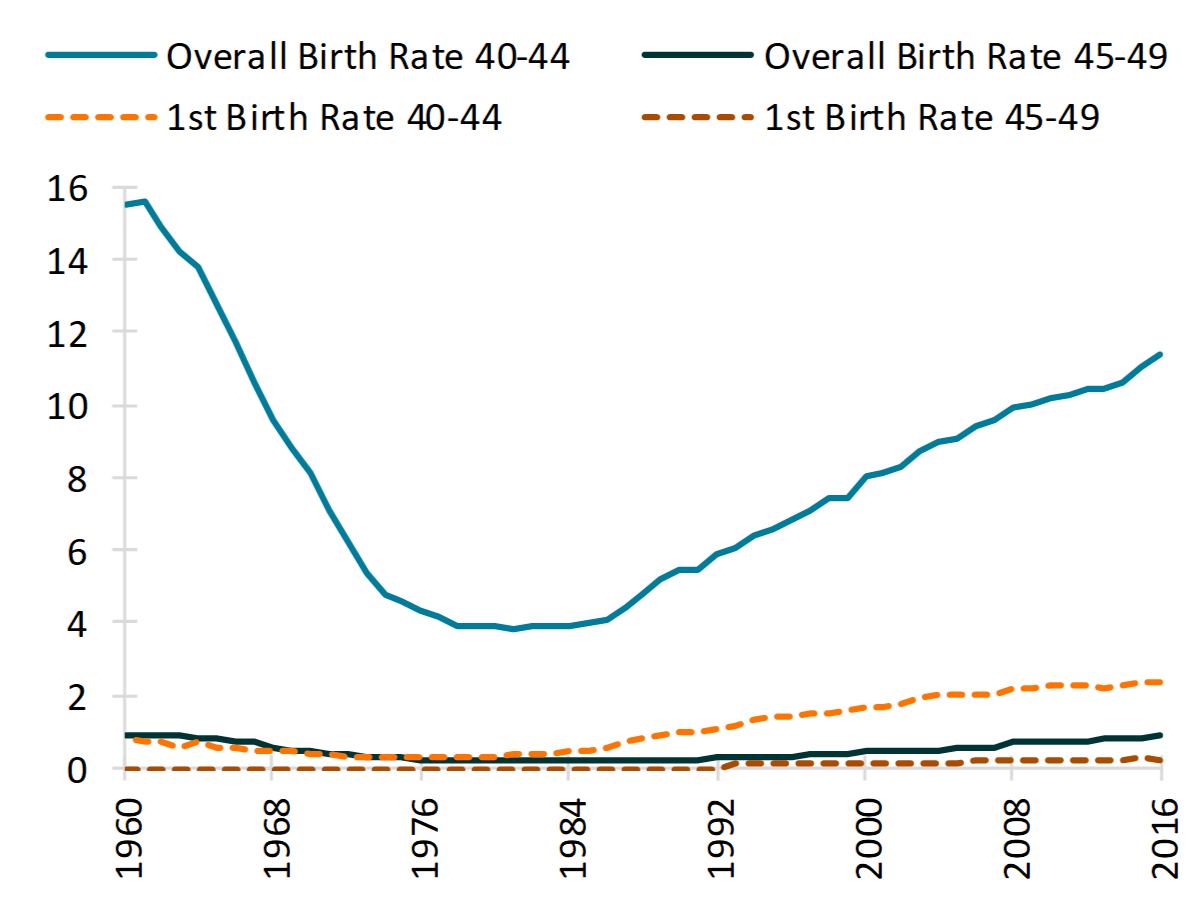
- The overall birth rate for women 40-44 peaked during the Baby Boom and reached a low in 1981 of 3.8 births per 1,000 women aged 40- 44. Since then, the overall birth rate has increased steadily, reaching 11.4 in 2016.
- First birth rates for women 40-44 have consistently been much lower than overall rates and have risen more slowly.
- The first birth rate was quite low in 2016, despite an eightfold increase since the 1970s (from 0.3 births to 2.4 births per 1,000 women).
- The overall birth rate for women 45-49 has stayed very low since 1960, always below one birth per 1,000 women 45-49.
- First birth rates among this group have increased but were still near zero in 2016.
Figure 1. Birth Rates for Women 40 and Older, 1960-2016

Share of All Births to Older Mothers by Marital Status
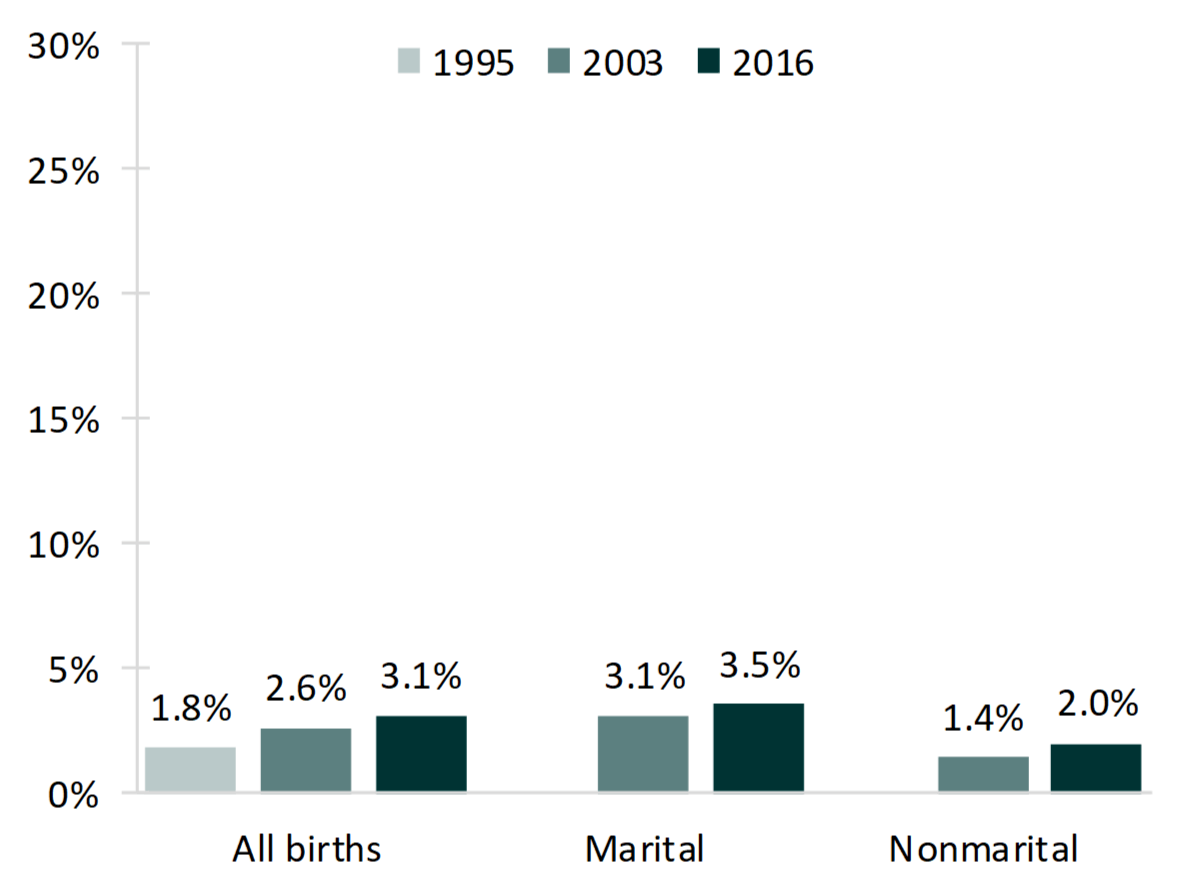
- In 1995, there were nearly 70,000 births to mothers 40 and older. By 2016, the number had risen to approximately 122,000 births.
- Mothers aged 40 and older accounted for an increasing share of all births over time, regardless of whether the births occurred within marriage, but the percentages remained quite low.
- In 1995, births to mothers 40 and older accounted 36% for 1.8% of all births, rising to 3.1% by 2016.
- The share of all marital births to older mothers was 3.5% in 2016.
- Only 2.0% of all nonmarital births were to mothers 40 and over in 2016.Share of First Births to Older Mothers by Marital Status
Figure 2. Share of All Births to Mothers 40 and Older, by Marital Context, 1995, 2003, and 2016

Share of First Births to Older Mothers by Marital Status
- In 2003, there were just under 24,000 first births to mothers 40 and older. This rose to nearly 27,000 in 2016.
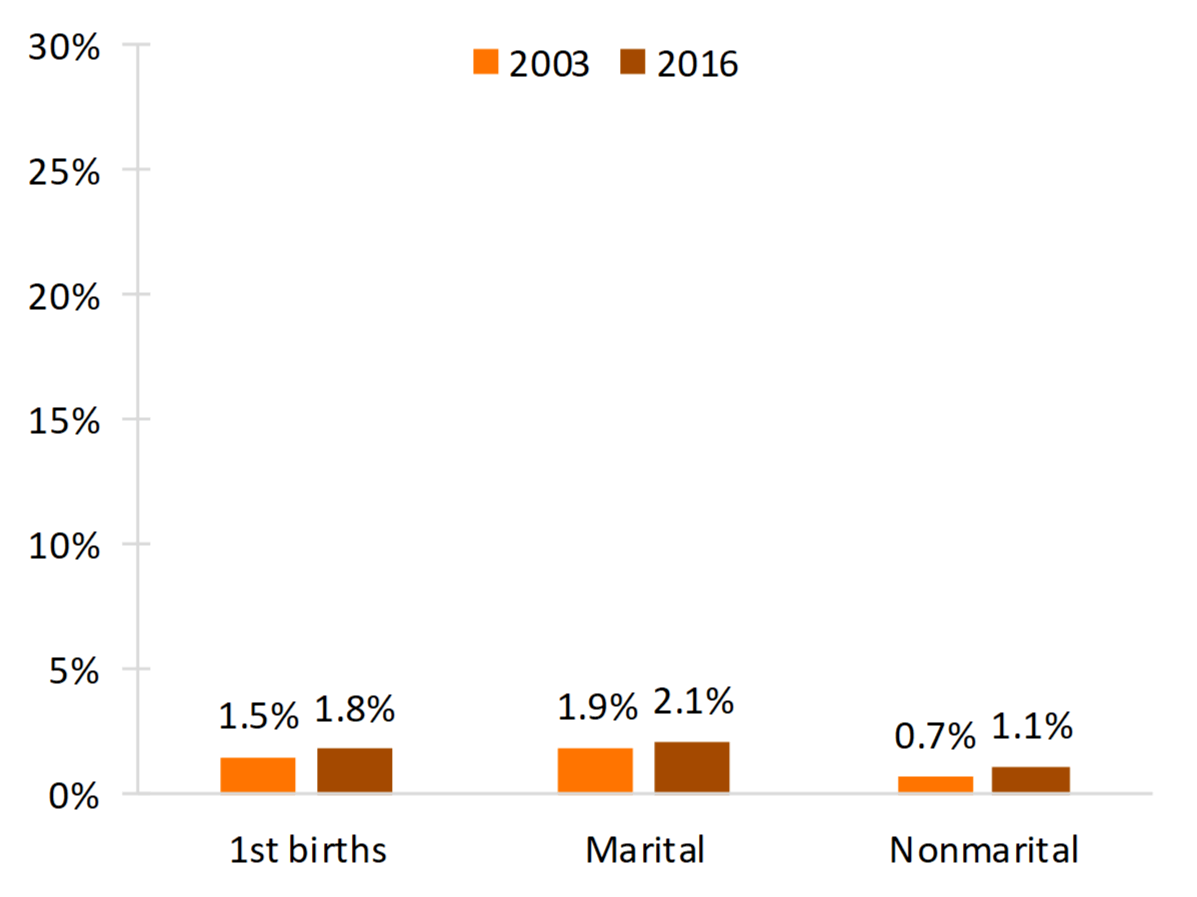
- Among first births, the share attributable to mothers aged 40 and over increased slightly between 2003 and 2016 but remained very low.
- Less than 2% of all first births were to mothers aged 40 and over in 2016.
- There was very little change in the share of marital first births to older mothers, staying around 2%.
- Among first births, the largest increase in the share of first births to older mothers occurred for nonmarital births. Even so, only 1.1% of all nonmarital first births were to older mothers in 2016.
- Of all births in 2016, less than 0.2% were first births to older unmarried mothers (not shown).
Figure 3. Share of First Births to Mothers 40 and Older, by Marital Context, 2003 and 2016

The Marital Context of Births to Women Aged 40 and Older
In this section, we shift the focus specifically examining changes in the marital context of births to women aged 40 and older. At both time points, just over a fifth (22%) of births to women aged 40 and older were first births.
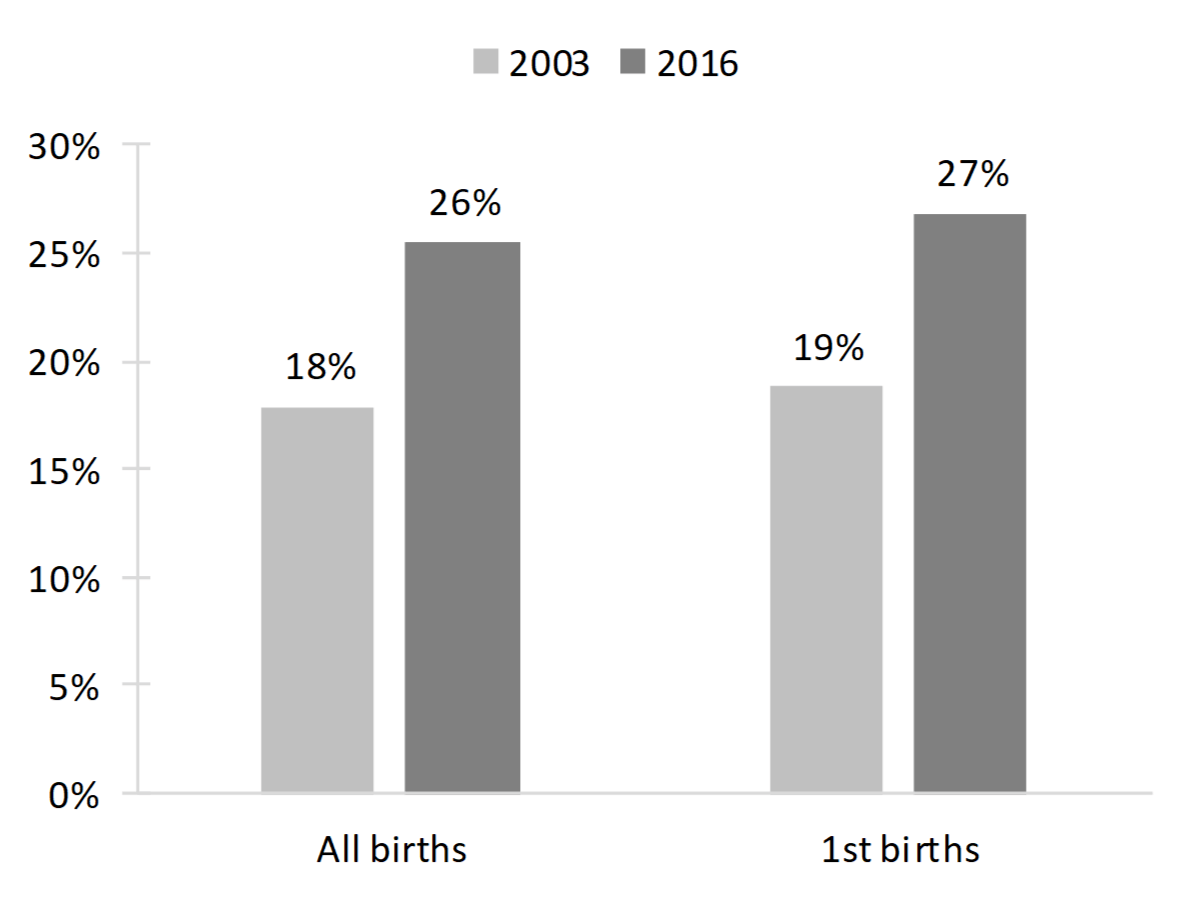
- The proportion of births to mothers aged 40 and older that occurred outside of marriage increased between 2003 and 2016.
- Just over a quarter of all births and first births were to unmarried women in 2016.
- Despite these increases, the absolute number of older mothers having children outside of marriage remains extremely small, especially for first births.
- In 2016, there were only 7,171 first births to unmarried mothers aged 40 and older in the entire United States.
Figure 4. Among Births to Women 40 and Older, Percentage Occurring to Unmarried Women

Data Source
- United States Department of Health and Human Services (US DHHS), Centers for Disease Control and Prevention (CDC), National Center for Health Statistics (NCHS), Division of Vital Statistics, Natality public-use data 1995-2002, on CDC WONDER Online Database, November 2005. Accessed at http://wonder.cdc.gov/natality-v2002.html on Apr 18, 2018 9:33:39 AM
- United States Department of Health and Human Services (US DHHS), Centers for Disease Control and Prevention (CDC), National Center for Health Statistics (NCHS), Division of Vital Statistics, Natality public-use data 2003-2006, on CDC WONDER Online Database, March 2009. Accessed at http://wonder.cdc.gov/natality-v2006.html on Apr 18, 2018 9:32:35 AM
- United States Department of Health and Human Services (US DHHS), Centers for Disease Control and Prevention (CDC), National Center for Health Statistics (NCHS), Division of Vital Statistics, Natality public-use data 2007-2016, on CDC WONDER Online Database, February 2018. Accessed at http://wonder.cdc.gov/natality-current.html on Apr 18, 2018 9:30:40 AM
References
- Eickmeyer, K. J., Payne, K. K., Brown, S. L., & Manning, W. D. (2017). Crossover in the median age at first marriage and first birth: Thirty-five years of change. Family Profiles, FP-17-22. Bowling Green, OH: National Center for Family & Marriage Research. https://doi.org/10.25035/ncfmr/fp-17-22
Suggested Citation
- Guzzo, K. B. (2018). Childbearing among women 40 and older. Family Profiles, FP-18-07. Bowling Green, OH: National Center for Family & Marriage Research. https://doi.org/10.25035/ncfmr/fp-18-07
Updated: 11/07/2025 03:37PM


