Variation in Birth Spacing by Maternal Characteristics
Family Profile No. 14, 2017
Author: Karen Benjamin Guzzo
Most American parents have at least two children, and spacing between children's births is associated with maternal and child health (Conde-Agudelo, Rosas-Bermudez, Castano, and Norton, 2012). In this profile, we use the National Survey of Family Growth (NSFG) to examine spacing between births (the number of months between two consecutive births) among American mothers aged 15-44 in 2013. We present median spacing for second and third births by mother's age, race-ethnicity, and completed education. This profile is a companion piece to FP-17-13, Variation in Birth Spacing by Family Context.
Birth Spacing by Mother’s Age at Prior Birth
- The median spacing between first and second births was lowest for mothers aged 30-34 (29 months) at their first birth and highest for mothers who had their first birth as a teenager (38 months).
Figure 1. Median Spacing for Second Birth by Age at Prior Birth
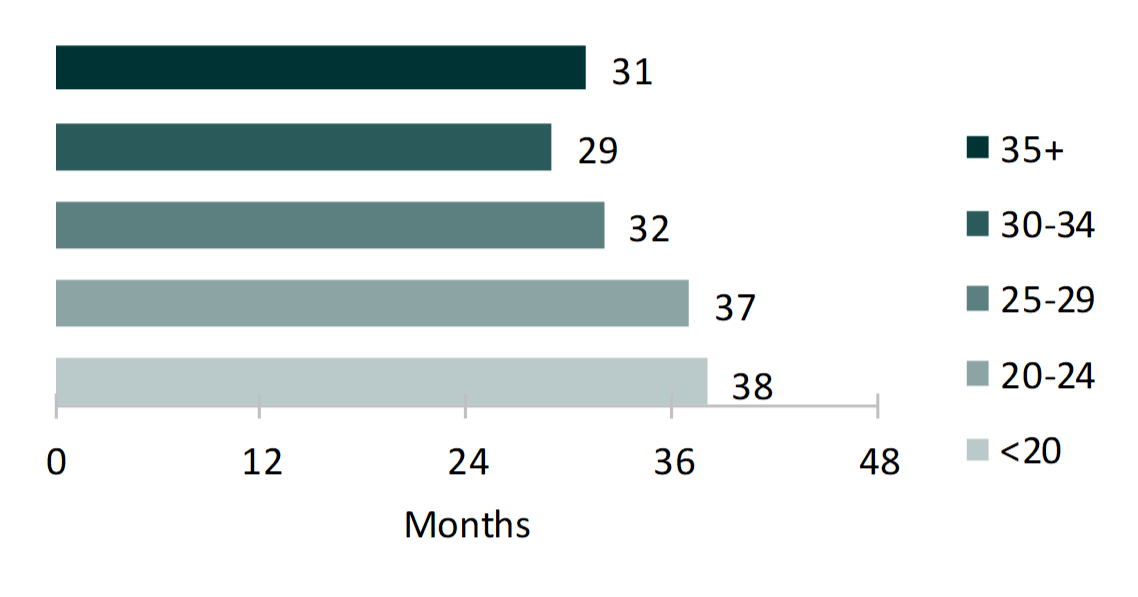
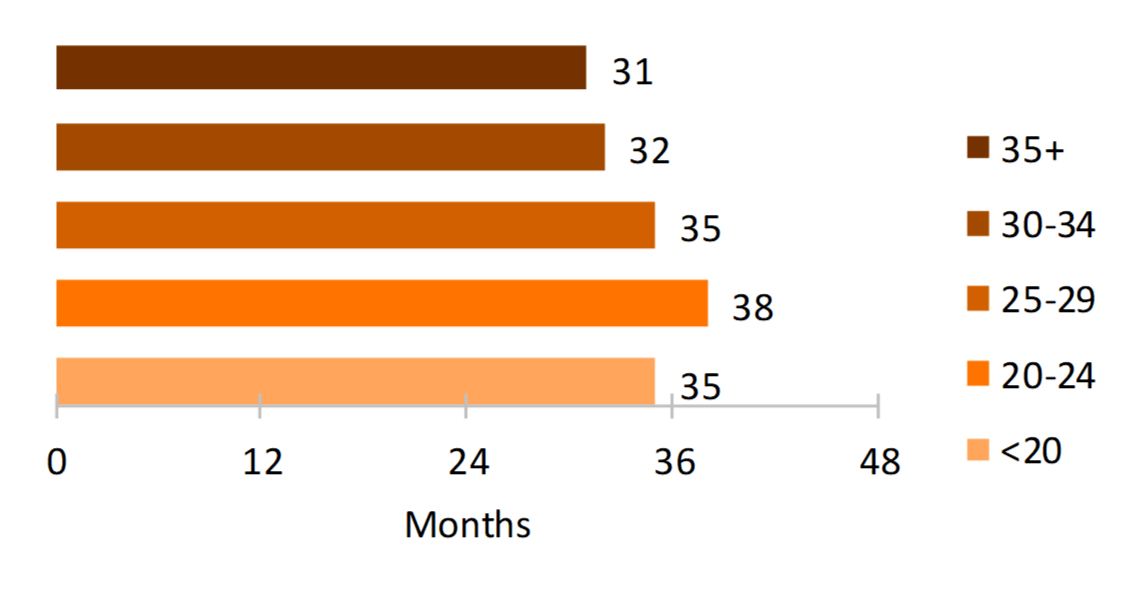
Figure 2. Median Spacing for Third Birth by Age at Prior Birth
Birth Spacing by Race and Ethnicity
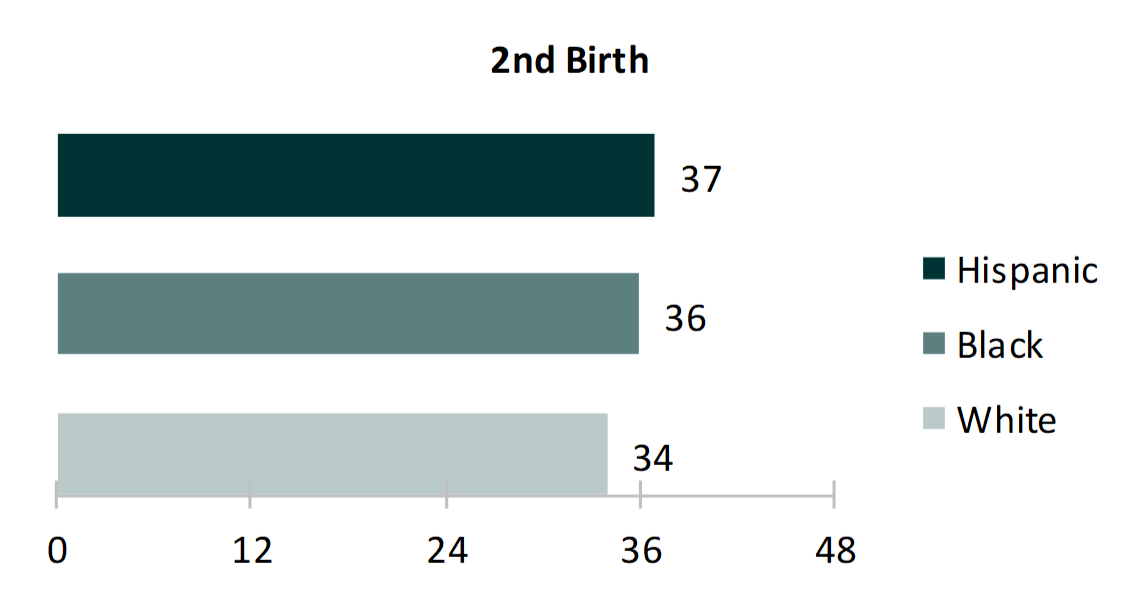
- For second births, White women had the shortest median spacing at 34 months.
- Black and Hispanic women had birth spacing two and three months longer, respectively.
- Black and Hispanic women had birth spacing two and three months longer, respectively.
Figure 3. Median Spacing for Second Birth by Race and Ethnicity
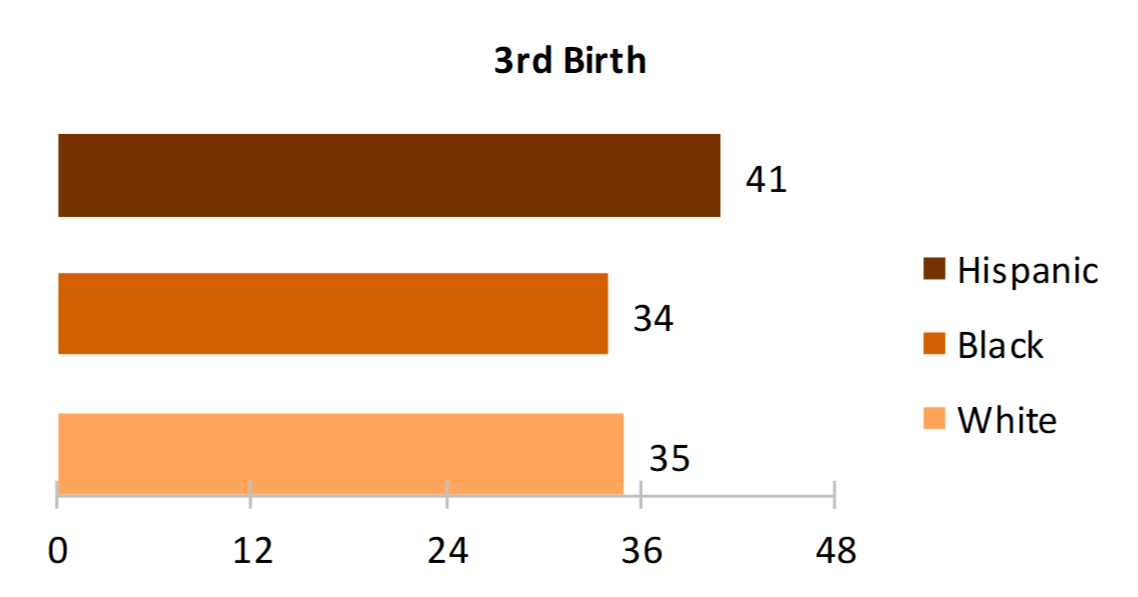
- The median spacing for third births was fairly similar for White and Black women at just under three years.
- Hispanic women had their third births nearly three-and-a-half years after their second birth.
Figure 4. Median Spacing for Third Birth by Race and Ethnicity
Birth Spacing by Completed Maternal Education
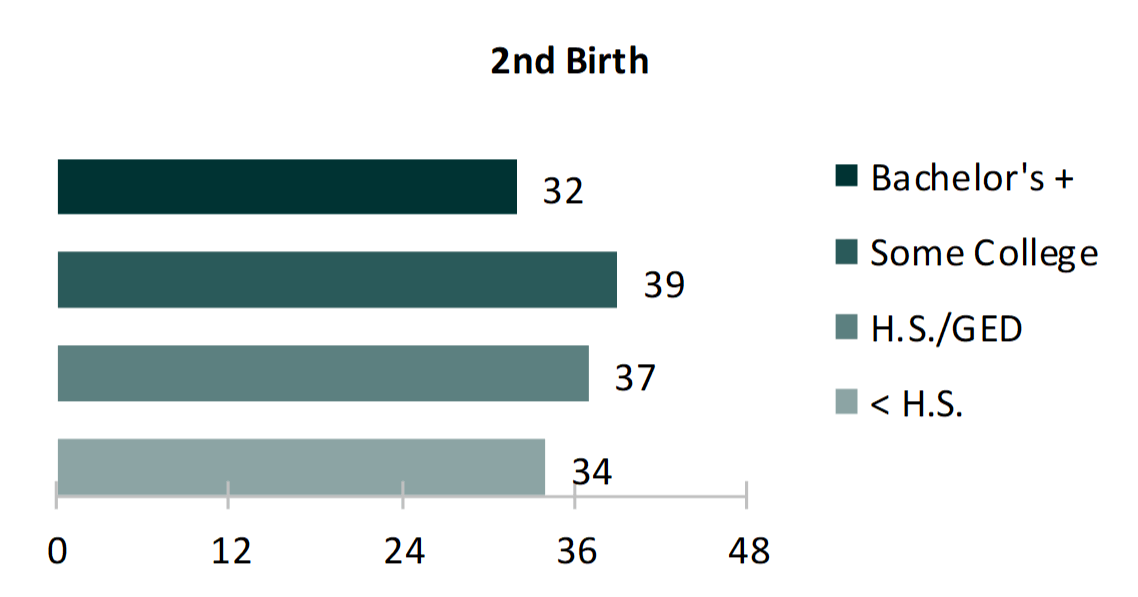
- The median spacing between first and second births was progressively longer moving from those with less than high school (34 months) to those with some college (39 months).
- However, mothers with at least a bachelor's degree had the shortest spacing at 32 months.
- However, mothers with at least a bachelor's degree had the shortest spacing at 32 months.
Figure 5. Median Spacing for Second Birth by Completed Education
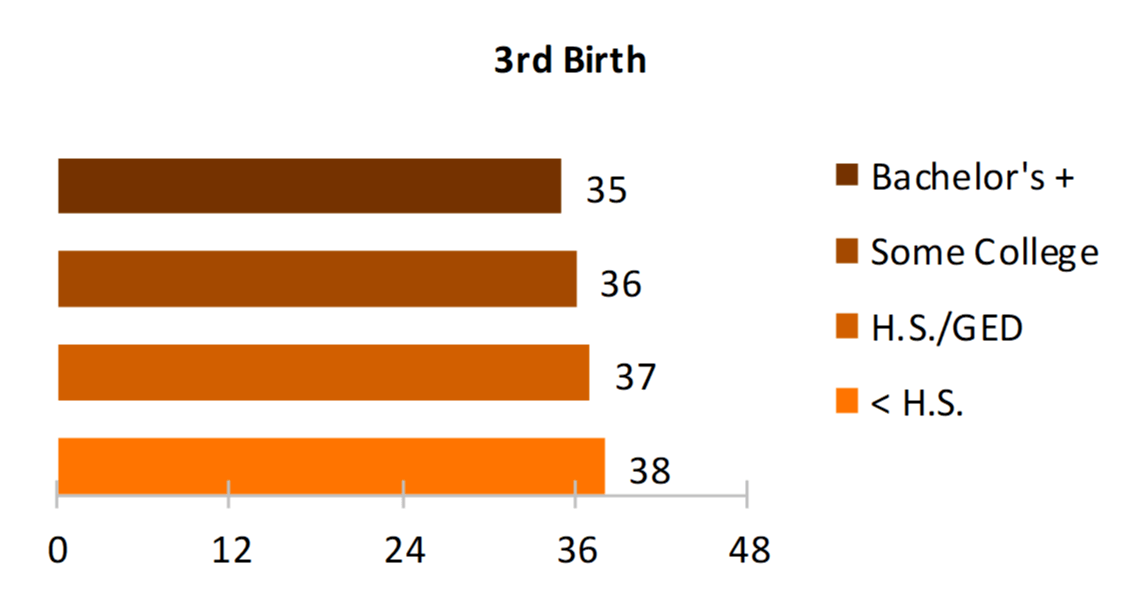
- Among those with third births, the association was reversed—the median number of months between births declined with increasing levels of education.
- College-educated mothers still had the shortest spacing, at 35 months.
- College-educated mothers still had the shortest spacing, at 35 months.
Figure 6. Median Spacing for Third Birth by Completed Education

Mothers with at least a bachelor's degree...
had the shortest spacing

Data Sources
- National Center for Health Statistics (NCHS). (2016). 1988, 1995, 2002, 2006-2010, 2011-2013, 2013-2015 National Survey of Family Growth Public Use Data and Documentation. Hyattsville, MD: CDC National Center for Health Statistics. Retrieved from https://www.cdc.gov/nchs/nsfg/index.htm
References
- Conde-Agudelo, A., Rosas-Bermudez, A., Castano, F., & Norton, M. H. (2012). Effects of birth spacing on maternal, perinatal, infant, and child health: a systematic review of causal mechanisms. Studies in Family Planning, 43(2), 93-114.
Suggested Citation
- Guzzo, K. B. (2017). Variation in birth spacing by maternal characteristics. Family Profiles, FP-17-14. Bowling Green, OH: National Center for Family & Marriage Research. https://doi.org/10.25035/ncfmr/fp-17-14


This project is supported with assistance from Bowling Green State University. From 2007 to 2013, support was also provided by the U.S. Department of Health and Human Services, Office of the Assistant Secretary for Planning and Evaluation. The opinions and conclusions expressed herein are solely those of the author(s) and should not be construed as representing the opinions or policy of any agency of the state or federal government.
Updated: 04/06/2021 01:31PM

