Age Variation in the First Marriage Rate, 1990 & 2017
Family Profile No. 5, 2019
Author: Kasey J. Eickmeyer
Over the past 20 years, the first marriage rate has declined to about 32 marriages per 1,000 unmarried women (FP-18-14). Part of this trend has been a delay in the age at first marriage, which is nearly 28 years for women (FP-19-06). While declines and delays in marriage are evident, this overall trend obscures considerable variation by age group. Further, there is marked variation according to race and ethnicity. Using data from the 1990 U.S. Vital Statistics and the 2017 American Community Survey 1-year estimates, this profile documents the change in the first marriage rate between 1990 and 2017 across age groups and by race and ethnicity.
Marriage Rates
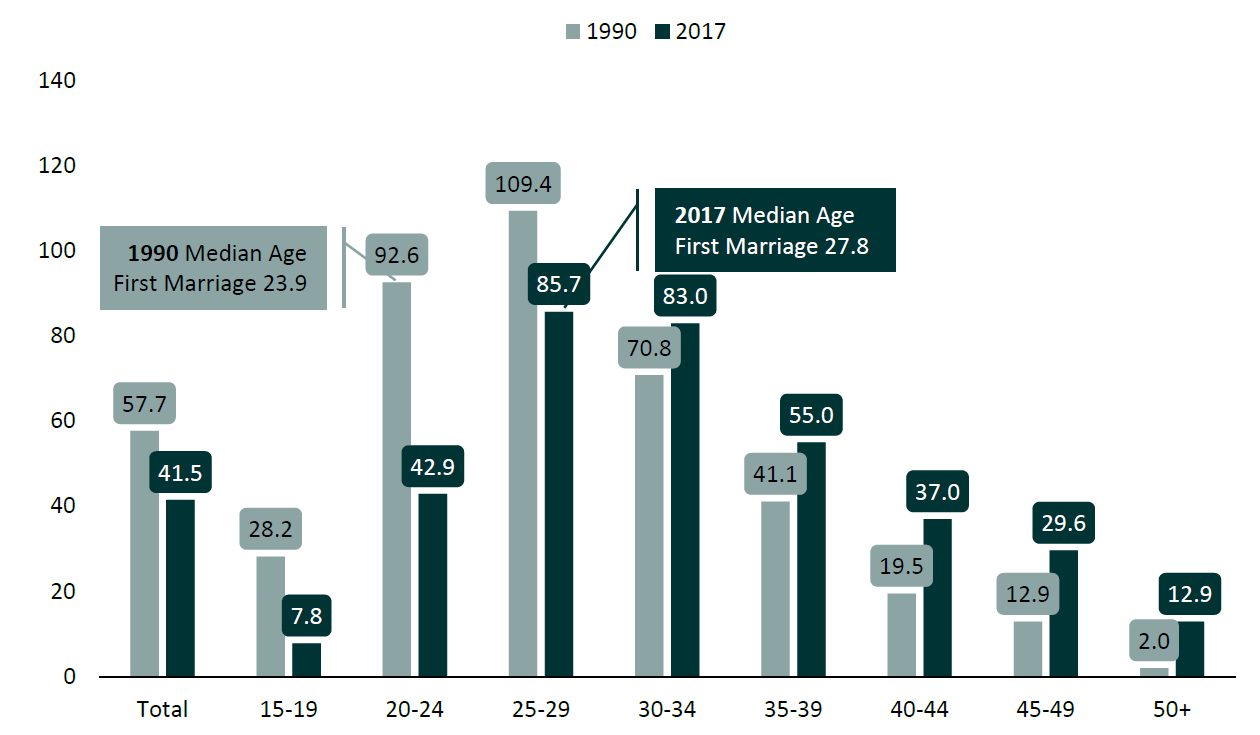
The first marriage rate was higher in 1990 than in 2017. Patterns of age variation in the first marriage rate differed in 1990 and 2017.
- In 1990, the first marriage rate was highest among women aged 25-29 (109.4) and lowest among those aged 50 or older.
- In 2017, the first marriage rate remained highest among women aged 25-29 (85.7), but was closely followed by those aged 30-34 (83.0). Women between the ages of 15-19 had the lowest first marriage rate.
- The decline in the first marriage rate between 1990 and 2017 occurred among women under age 30 and was most pronounced for women aged 15-19 in 2017.
- Women over the age of 30 witnessed an increase in their first marriage rate between 1990 and 2017, with the largest increase among women aged 50+.
Figure 1. Age-Specific Marriage Rates Among U.S. Women, 1990 and 2017.
Source: NCFMR analyses of Centers for Disease Control & Prevention, National Center for Health Statistics Vital Statistics (Clarke, 1995, Table 6), U.S. Census Bureau, American Community Survey 2017 1-yr est.
Age Variation by Race and Ethnicity
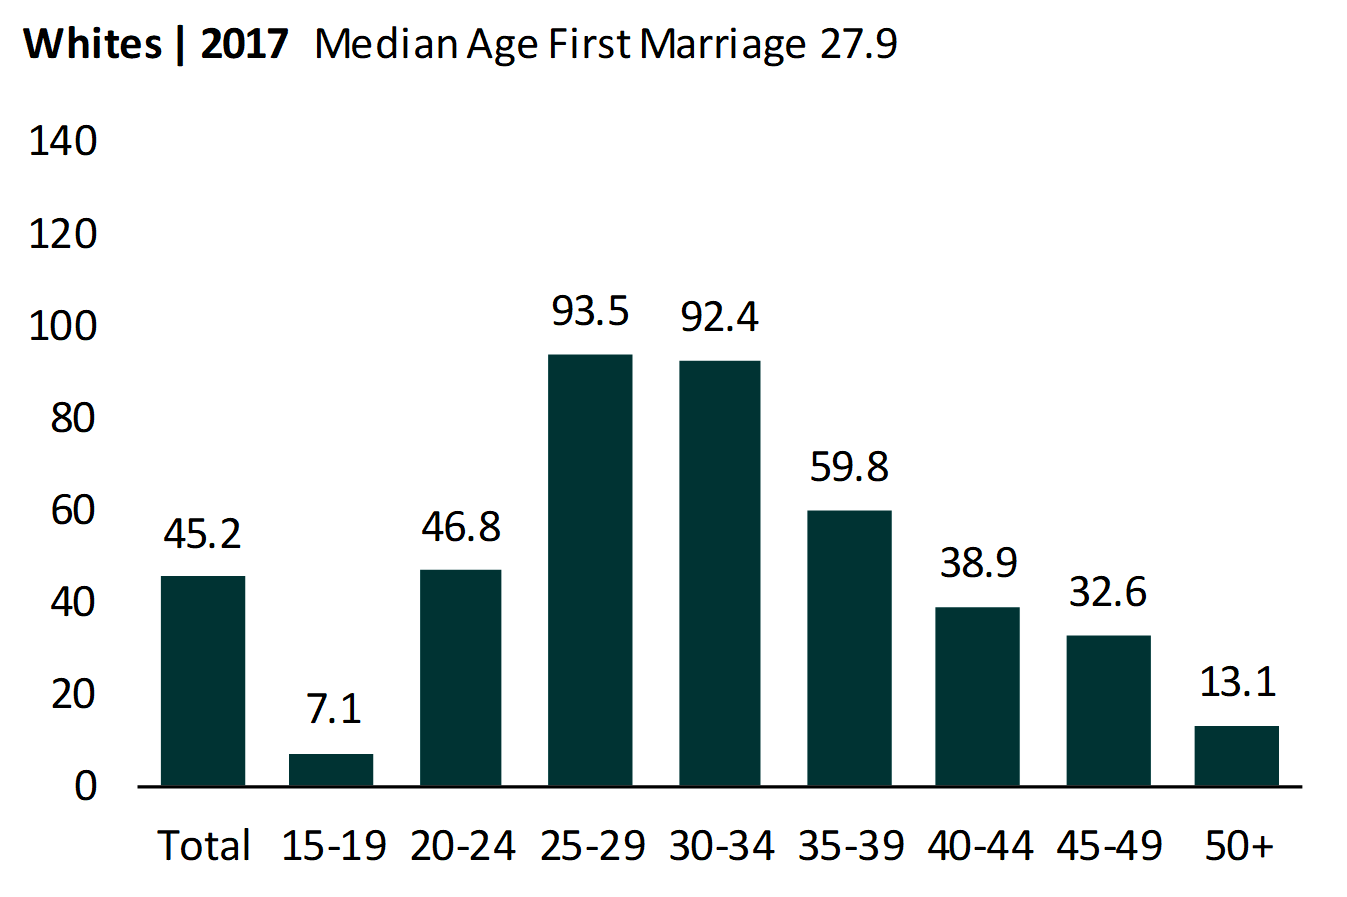
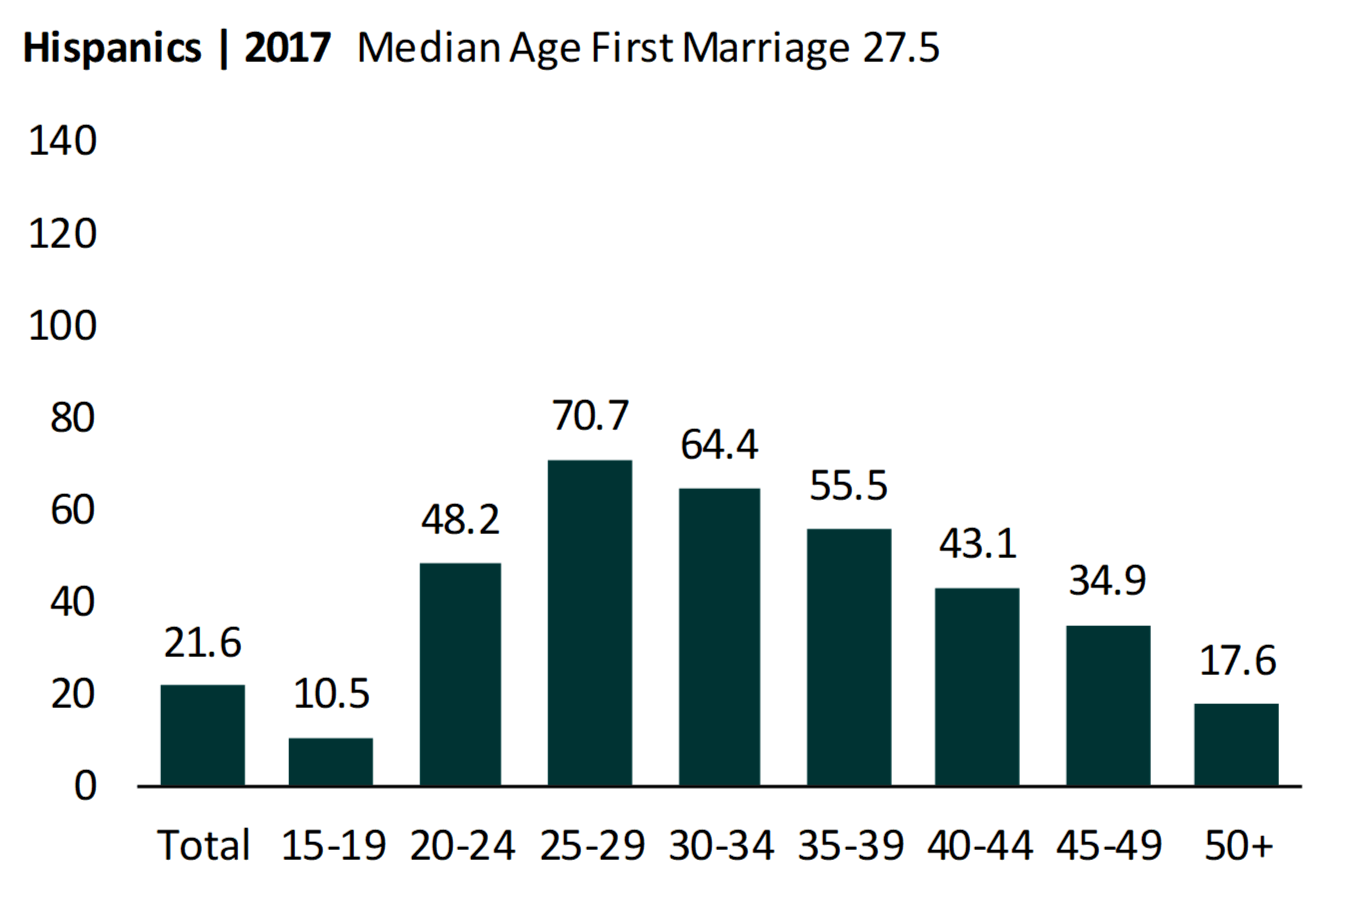
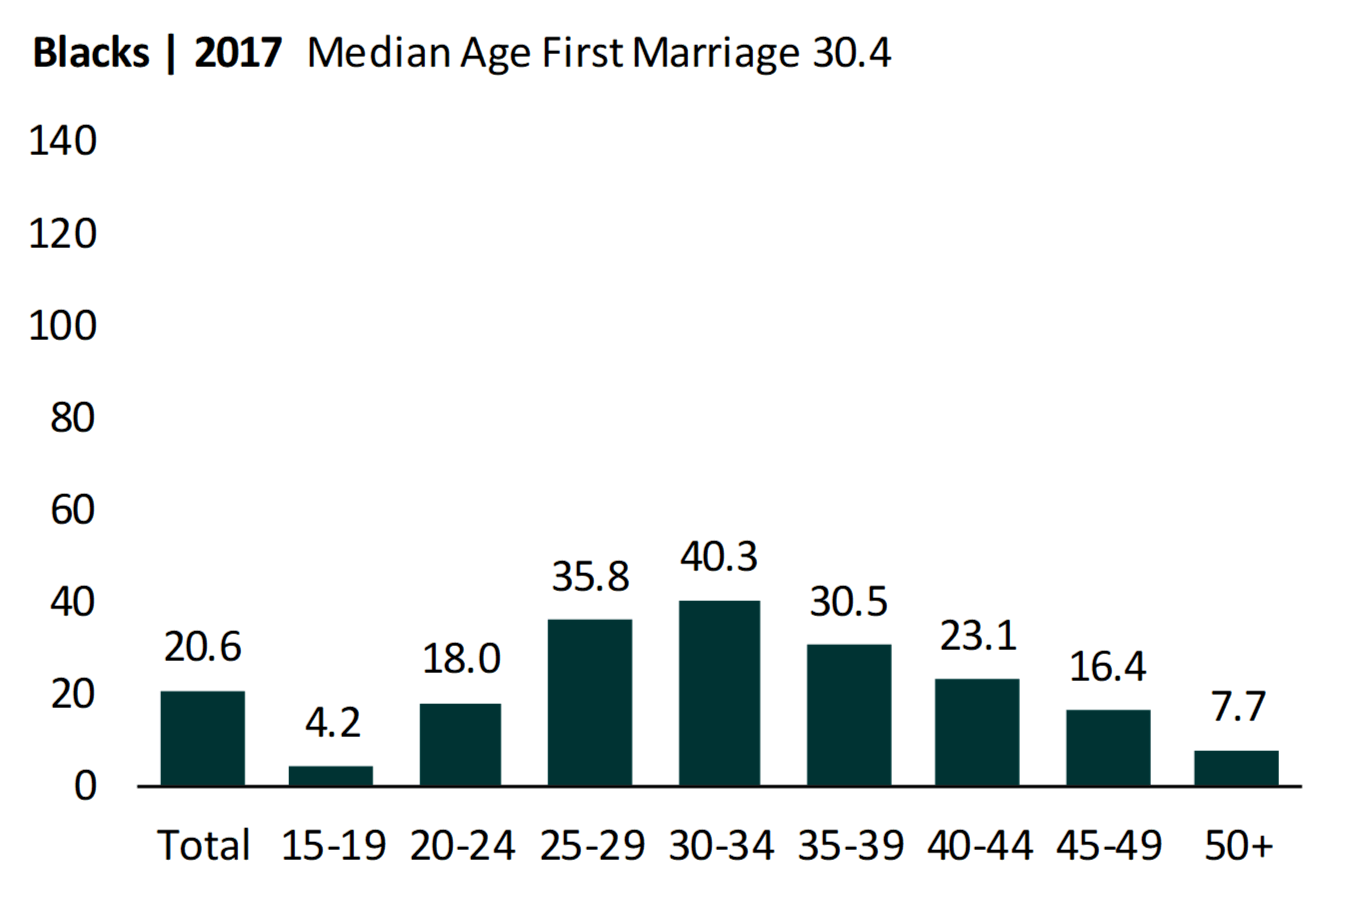
Racial and ethnic variation exists in the first marriage rate in 2017
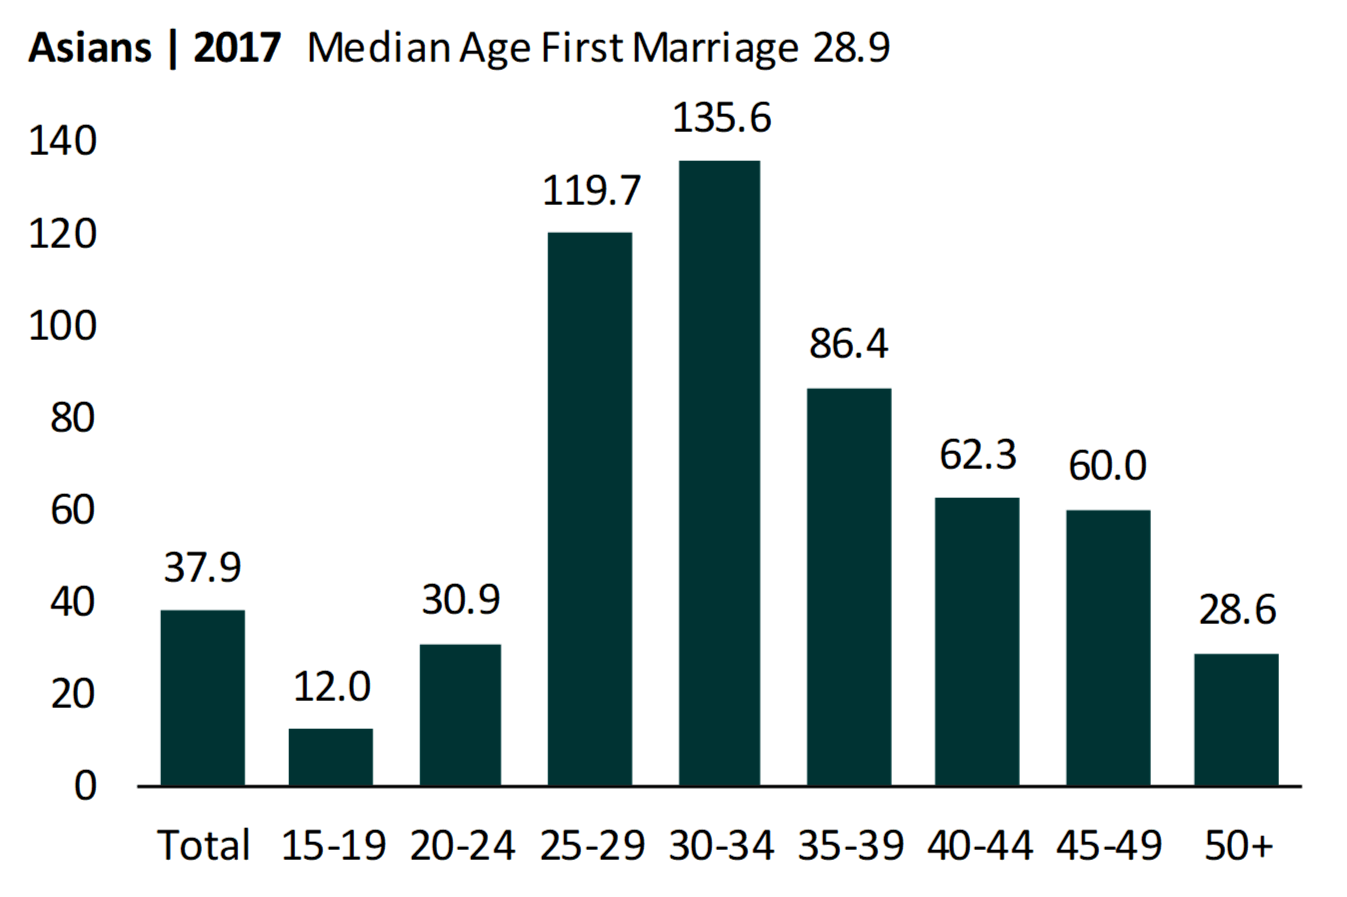
- Age variation among White and Hispanic women followed the overall pattern of the first marriage rate in 2017, with the
highest first marriage rate among women aged 25-29. - Among Black and Asian women, the highest first marriage rate was among women aged 30-34. The marriage rate
among Asian women aged 30-34 was 135.6 per 1,000 never married women. In contrast, among Black women aged 30-
34, their rate was only 40.3 per 1,000 never married women. - Asian women had the highest marriage rates at every age, except those aged 20-24. Black women had the lowest
marriage rates across all age groups. - Black women had the highest median age at first marriage (30.4) followed by Asian women (28.9), White women (27.9),
and Hispanic women (27.5).
Figure 2. Age-Specific First Marriage Rates Among U.S. Women in 2017, by Race/Ethnicity
Source: NCFMR analyses of U.S. Census Bureau, American Community Survey, 1-yr est.
References
- Payne, K. (2018). First marriage rate in the U.S., 2016. Family Profiles, FP-18-14. Bowling Green, OH: National Center for Family & Marriage Research. https://www.bgsu.edu/ncfmr/resources/data/family-profiles/payne-first-marriage-rate-fp-18-14.html
- Payne, K. K. (2019). Median age at first marriage, 2017. Family Profiles, FP-19-06. Bowling Green, OH: National Center for Family & Marriage Research. https://doi.org/10.25035/ncfmr/fp-19-06
Suggested Citation
- Eickmeyer, K. J. (2019). Age variation in the first marriage rate, 1990 & 2017. Family Profiles, FP-19-05. Bowling Green, OH: National Center for Family & Marriage Research. https://doi.org/10.25035/ncfmr/fp-19-05
This project is supported with assistance from Bowling Green State University. From 2007 to 2013, support was also provided by the U.S. Department of Health and Human Services, Office of the Assistant Secretary for Planning and Evaluation. The opinions and conclusions expressed herein are solely those of the author(s) and should not be construed as representing the opinions or policy of any agency of the state or federal government.
Updated: 04/06/2021 02:09PM


