Age Variation in the Divorce Rate, 1990 & 2019
This Family Profile is an update of :
FP-12-05, FP-14-16, FP-17-20, FP-19-13
Family Profile No. 16, 2021
Author: Lisa Carlson
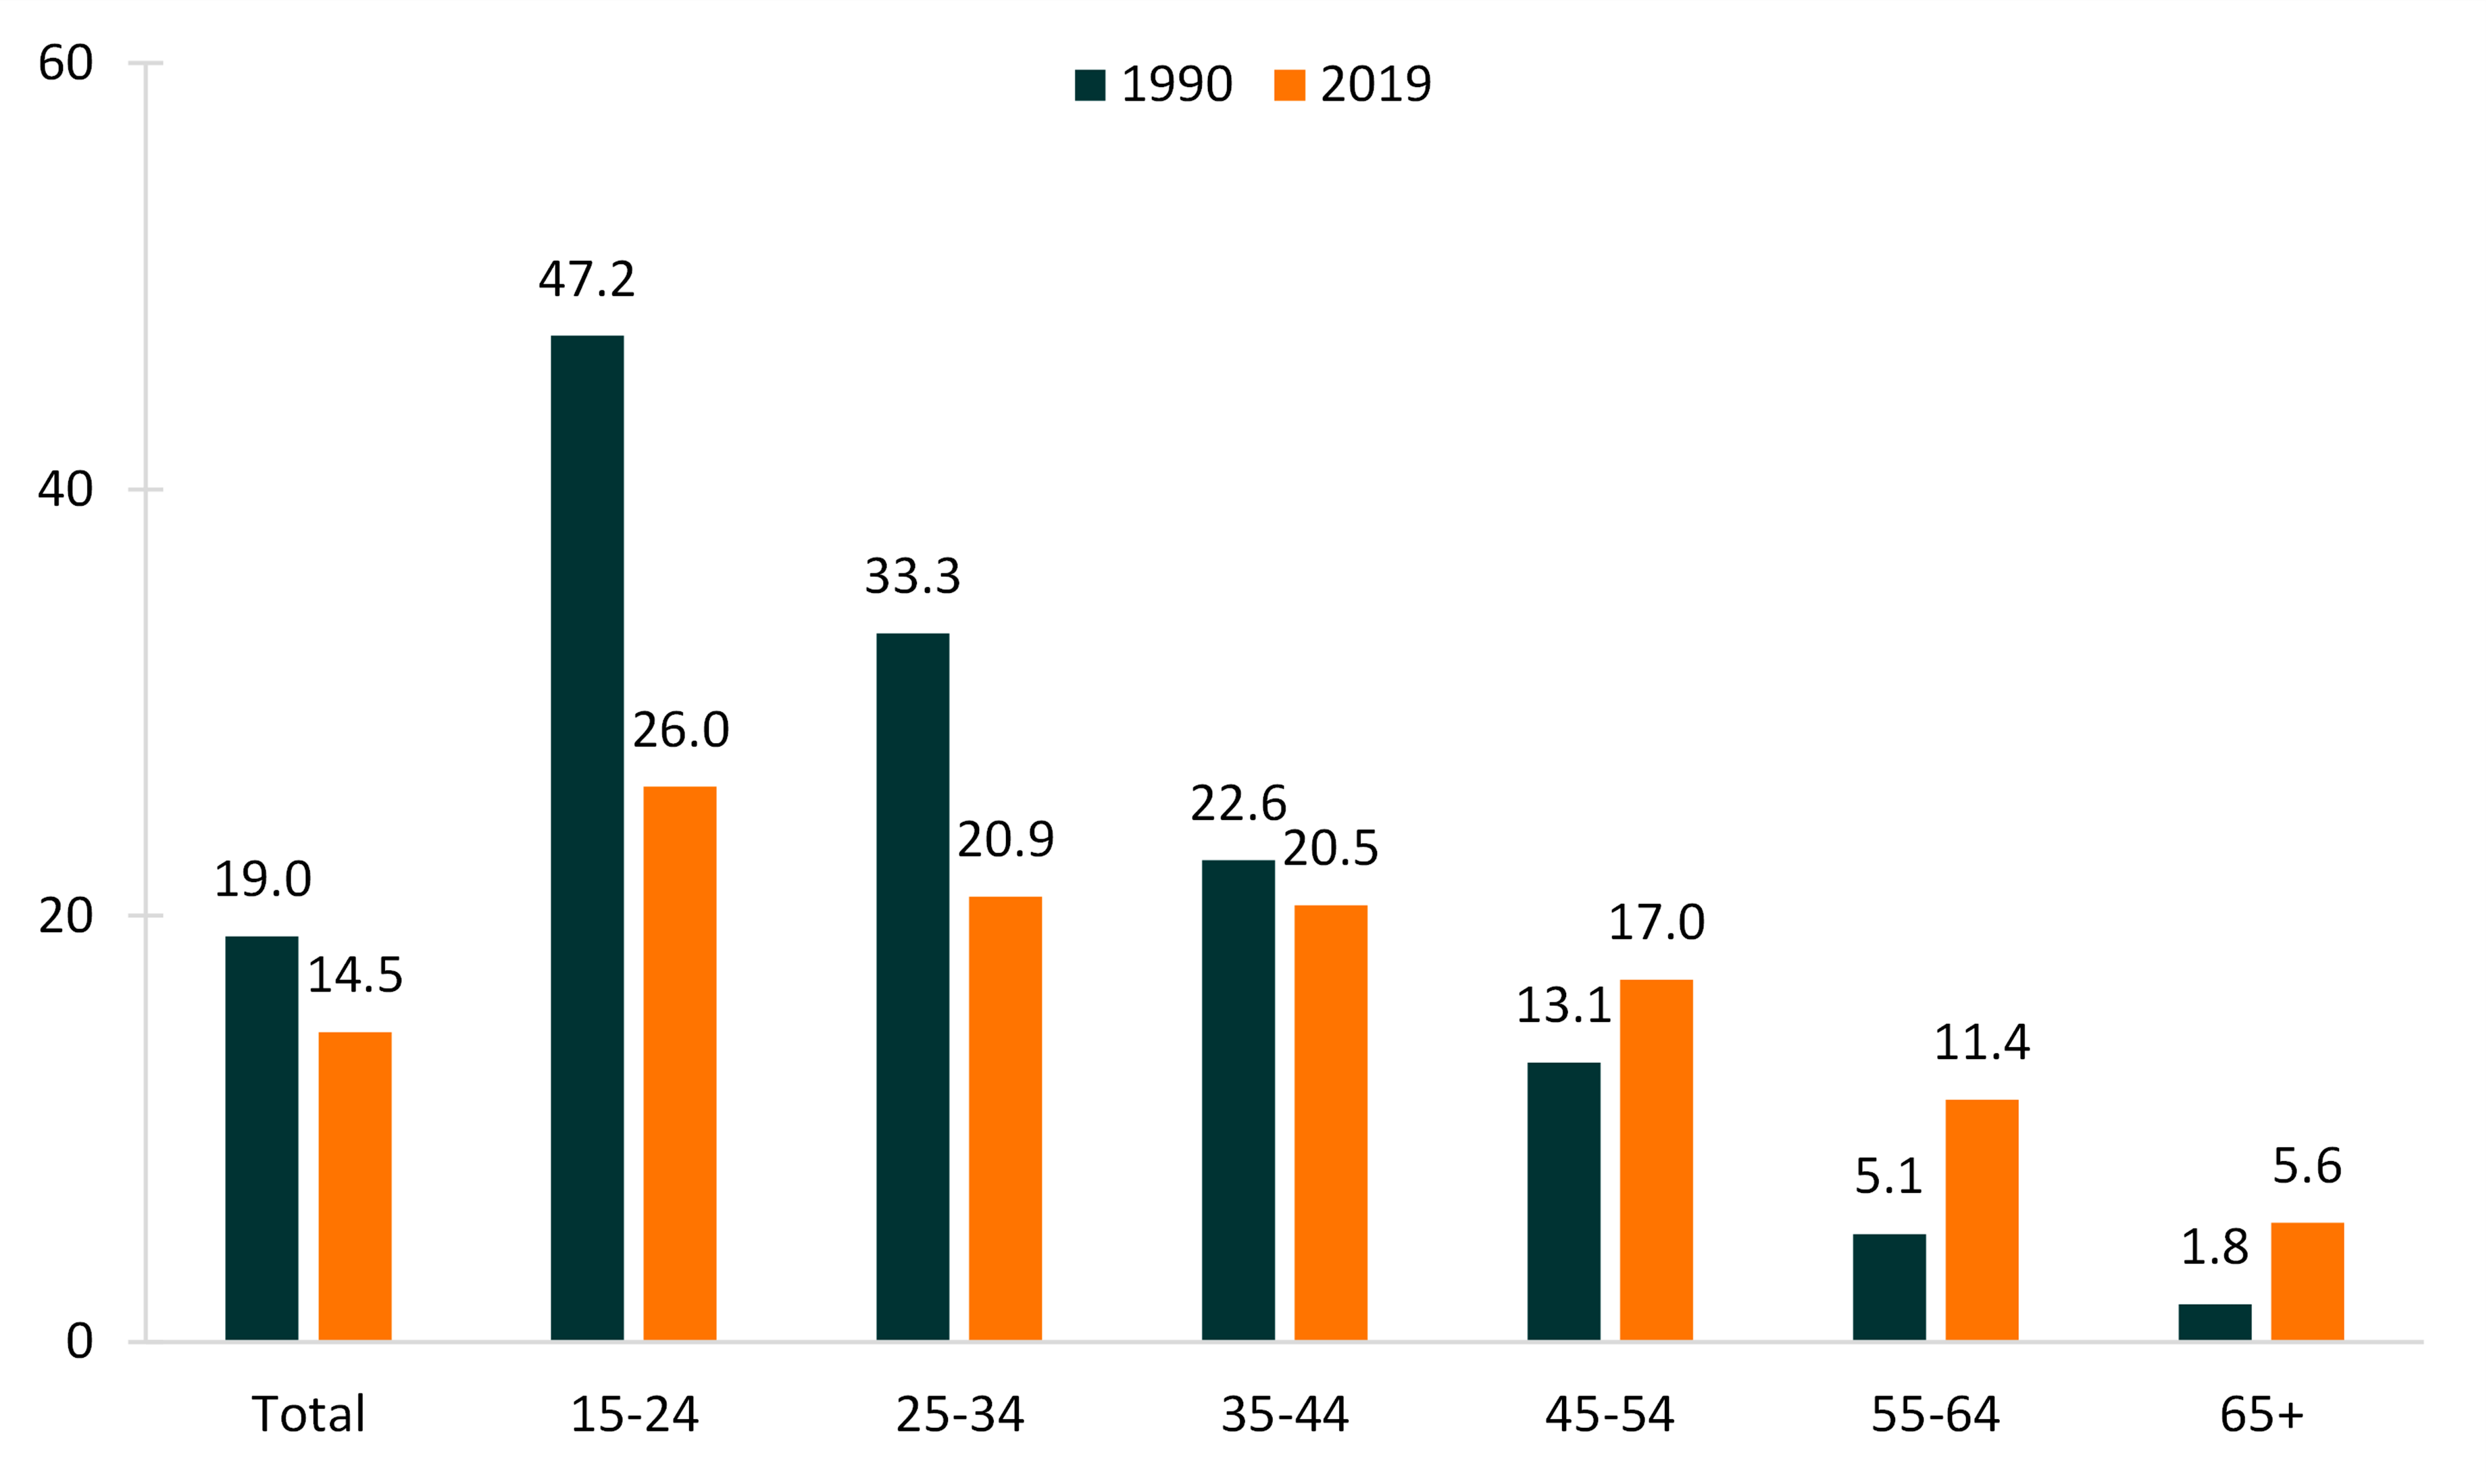
The divorce rate in the U.S. has declined in recent decades. In 1990, 19 people per 1,000 currently married individuals divorced compared to 15 per 1,000 in 2019. The overall trend in the divorce rate masks substantial variation by age. The divorce rate for younger people has been on the decline since the 1990s (Kennedy and Ruggles, 2014) whereas the divorce rate among those 50 and older has more than doubled since 1990 (Brown and Lin, 2012). This family profile updates FP-19-13 and charts the divorce rates by age groups in 1990 and 2019 using U.S Census data and the 2019 American Community Survey.
Divorce Rates by Age Group
- In both 1990 and 2019, the divorce rate declined with age.
- Age variation in the divorce rate was smaller in 2019 than in 1990.
- The difference in the divorce rate between those aged 15 to 24 and those aged 65 and older shrunk substantially, going from 47 per 1,000 compared to 2 per 1,000 in 1990 to 26 per 1,000 compared to 6 per 1,000 in 2019.
- Between 1990 and 2019, the divorce rate decreased for those aged 15 to 44, whereas it increased for those aged 45 and older.
- The greatest decrease in the divorce rate was among those aged 15 to 24 (from 47 per 1,000 to 26 per 1,000).
- The greatest increase in the divorce rate was among those aged 65 and older (from 2 per 1,000 to 6 per 1,000)
Figure 1. Divorce Rates by 10-Year Age Groups, 1990 & 2019

Source: NCFMR analyses using the Centers for Disease Control and Prevention, National Center for Health Statistics, Vital Statistics and U.S. Census Bureau, American Community Survey, 2019.
Divorce Rates by Age Group and Gender
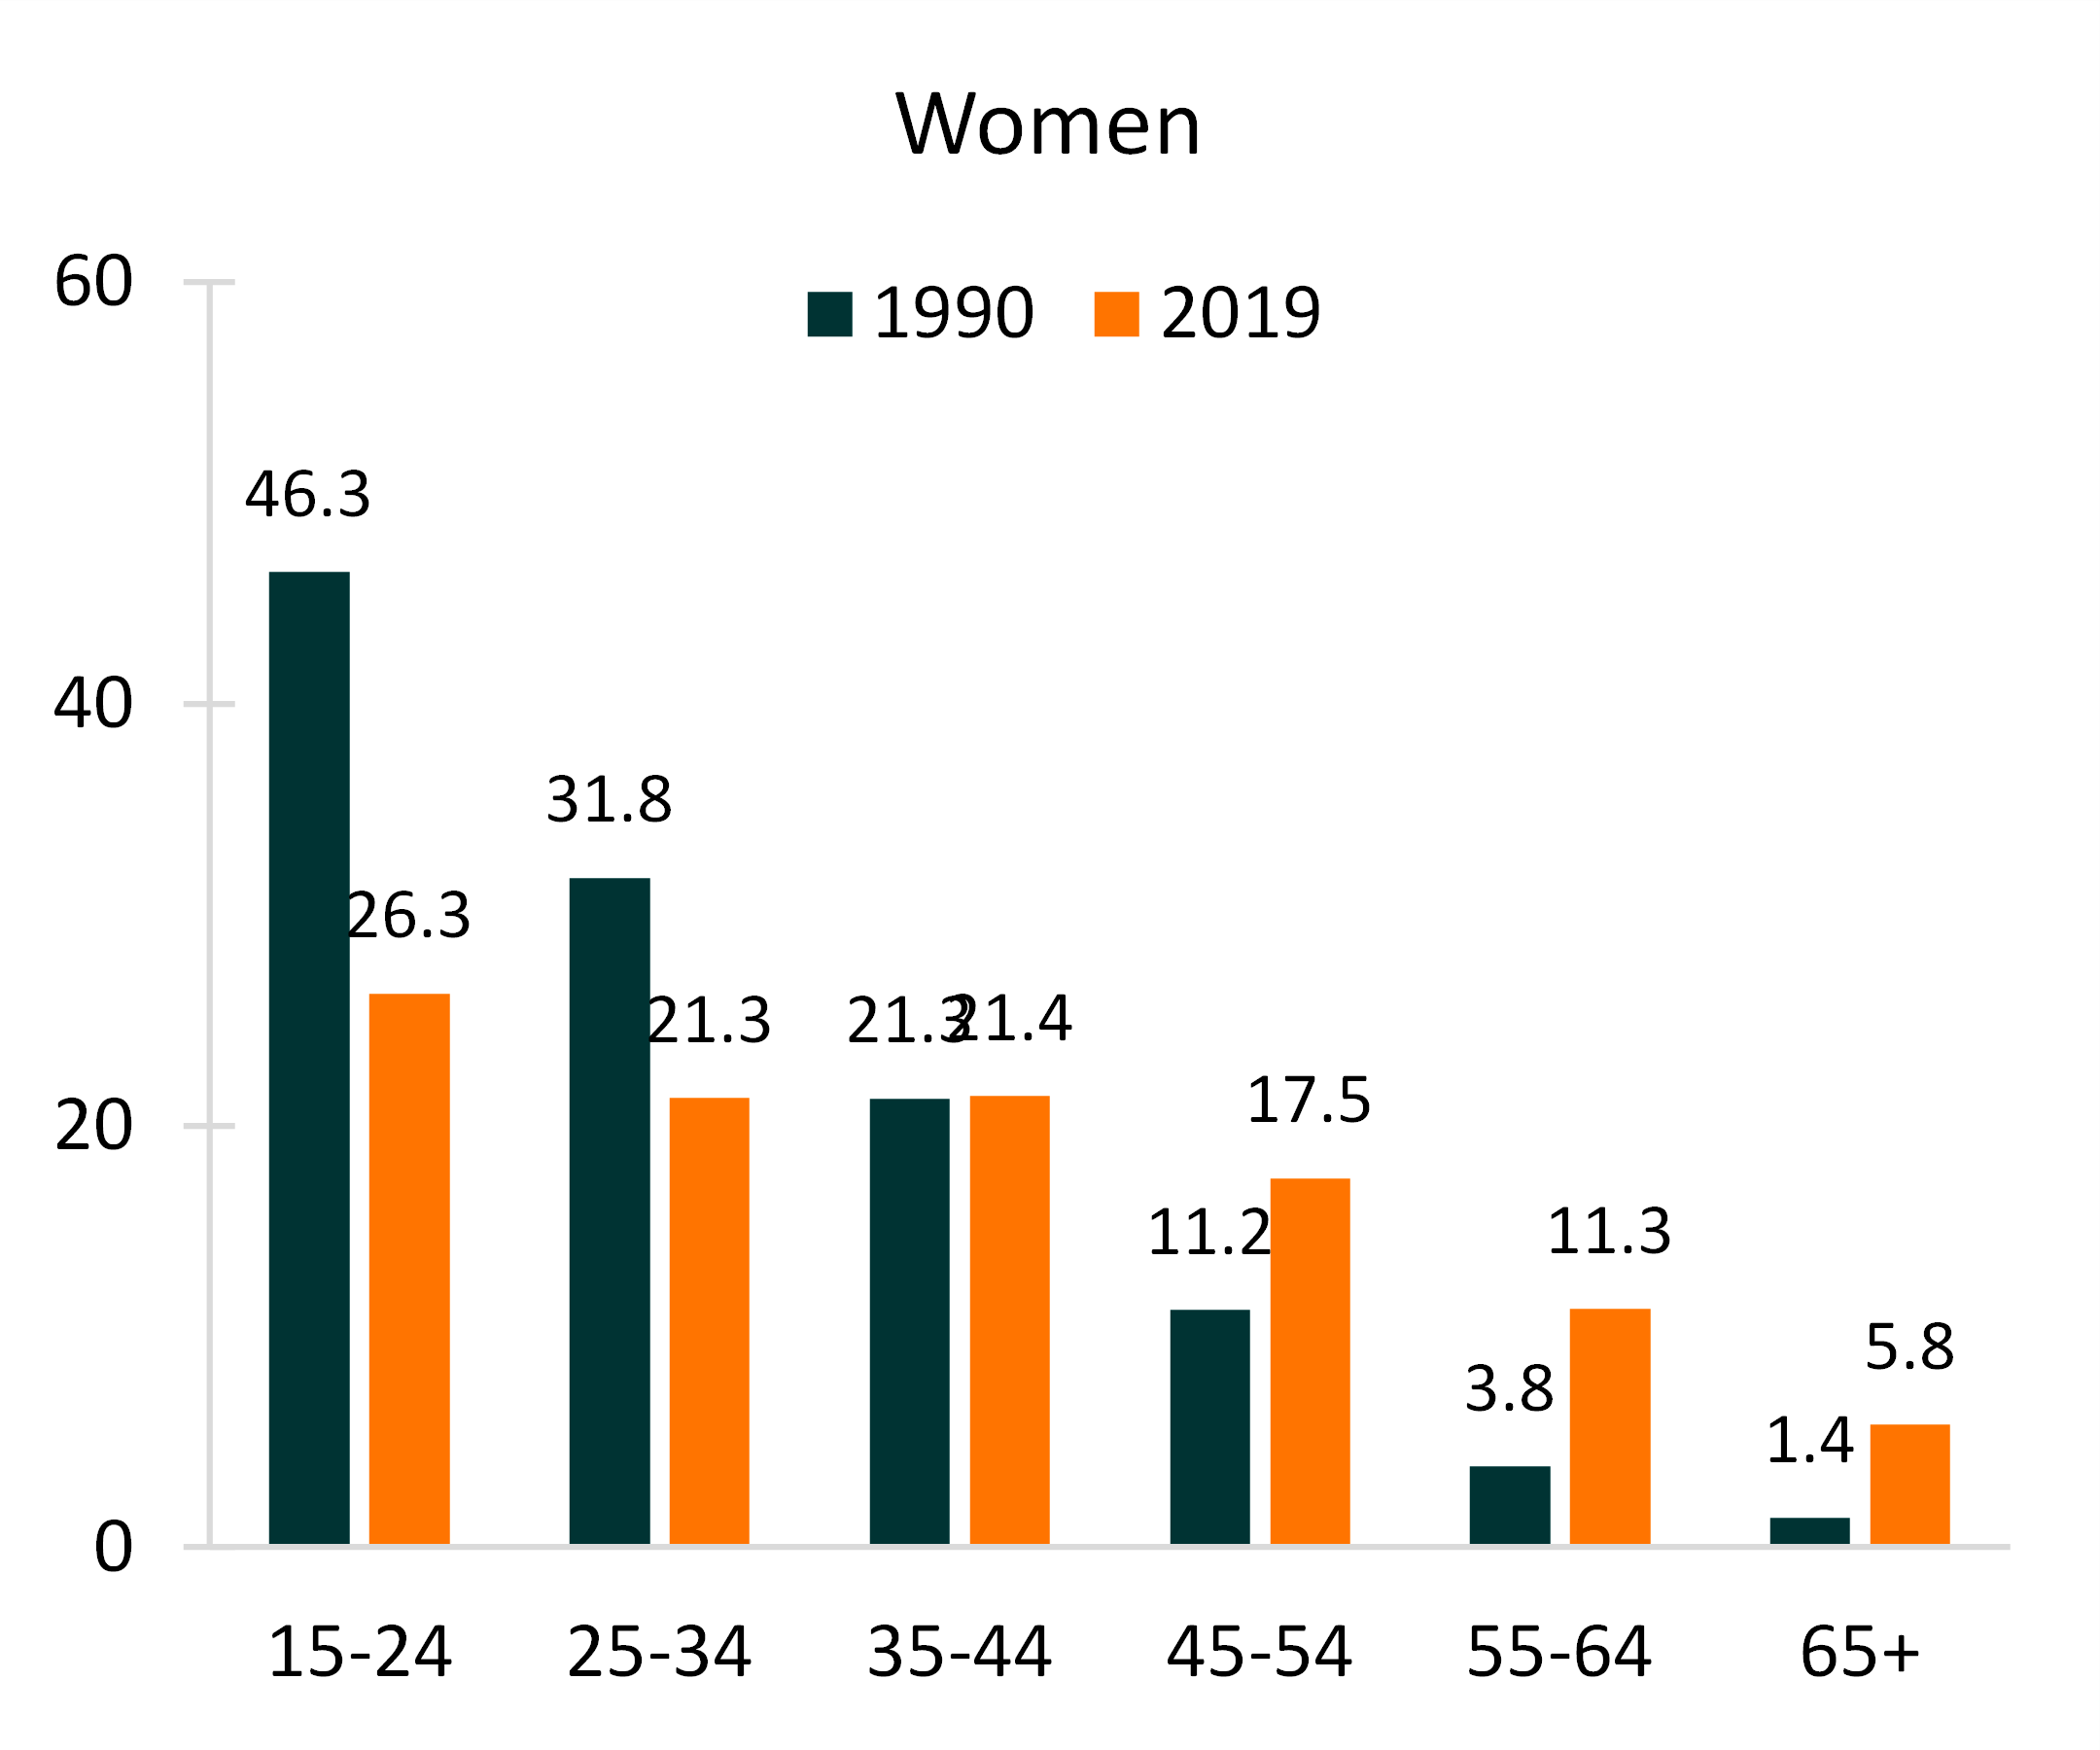
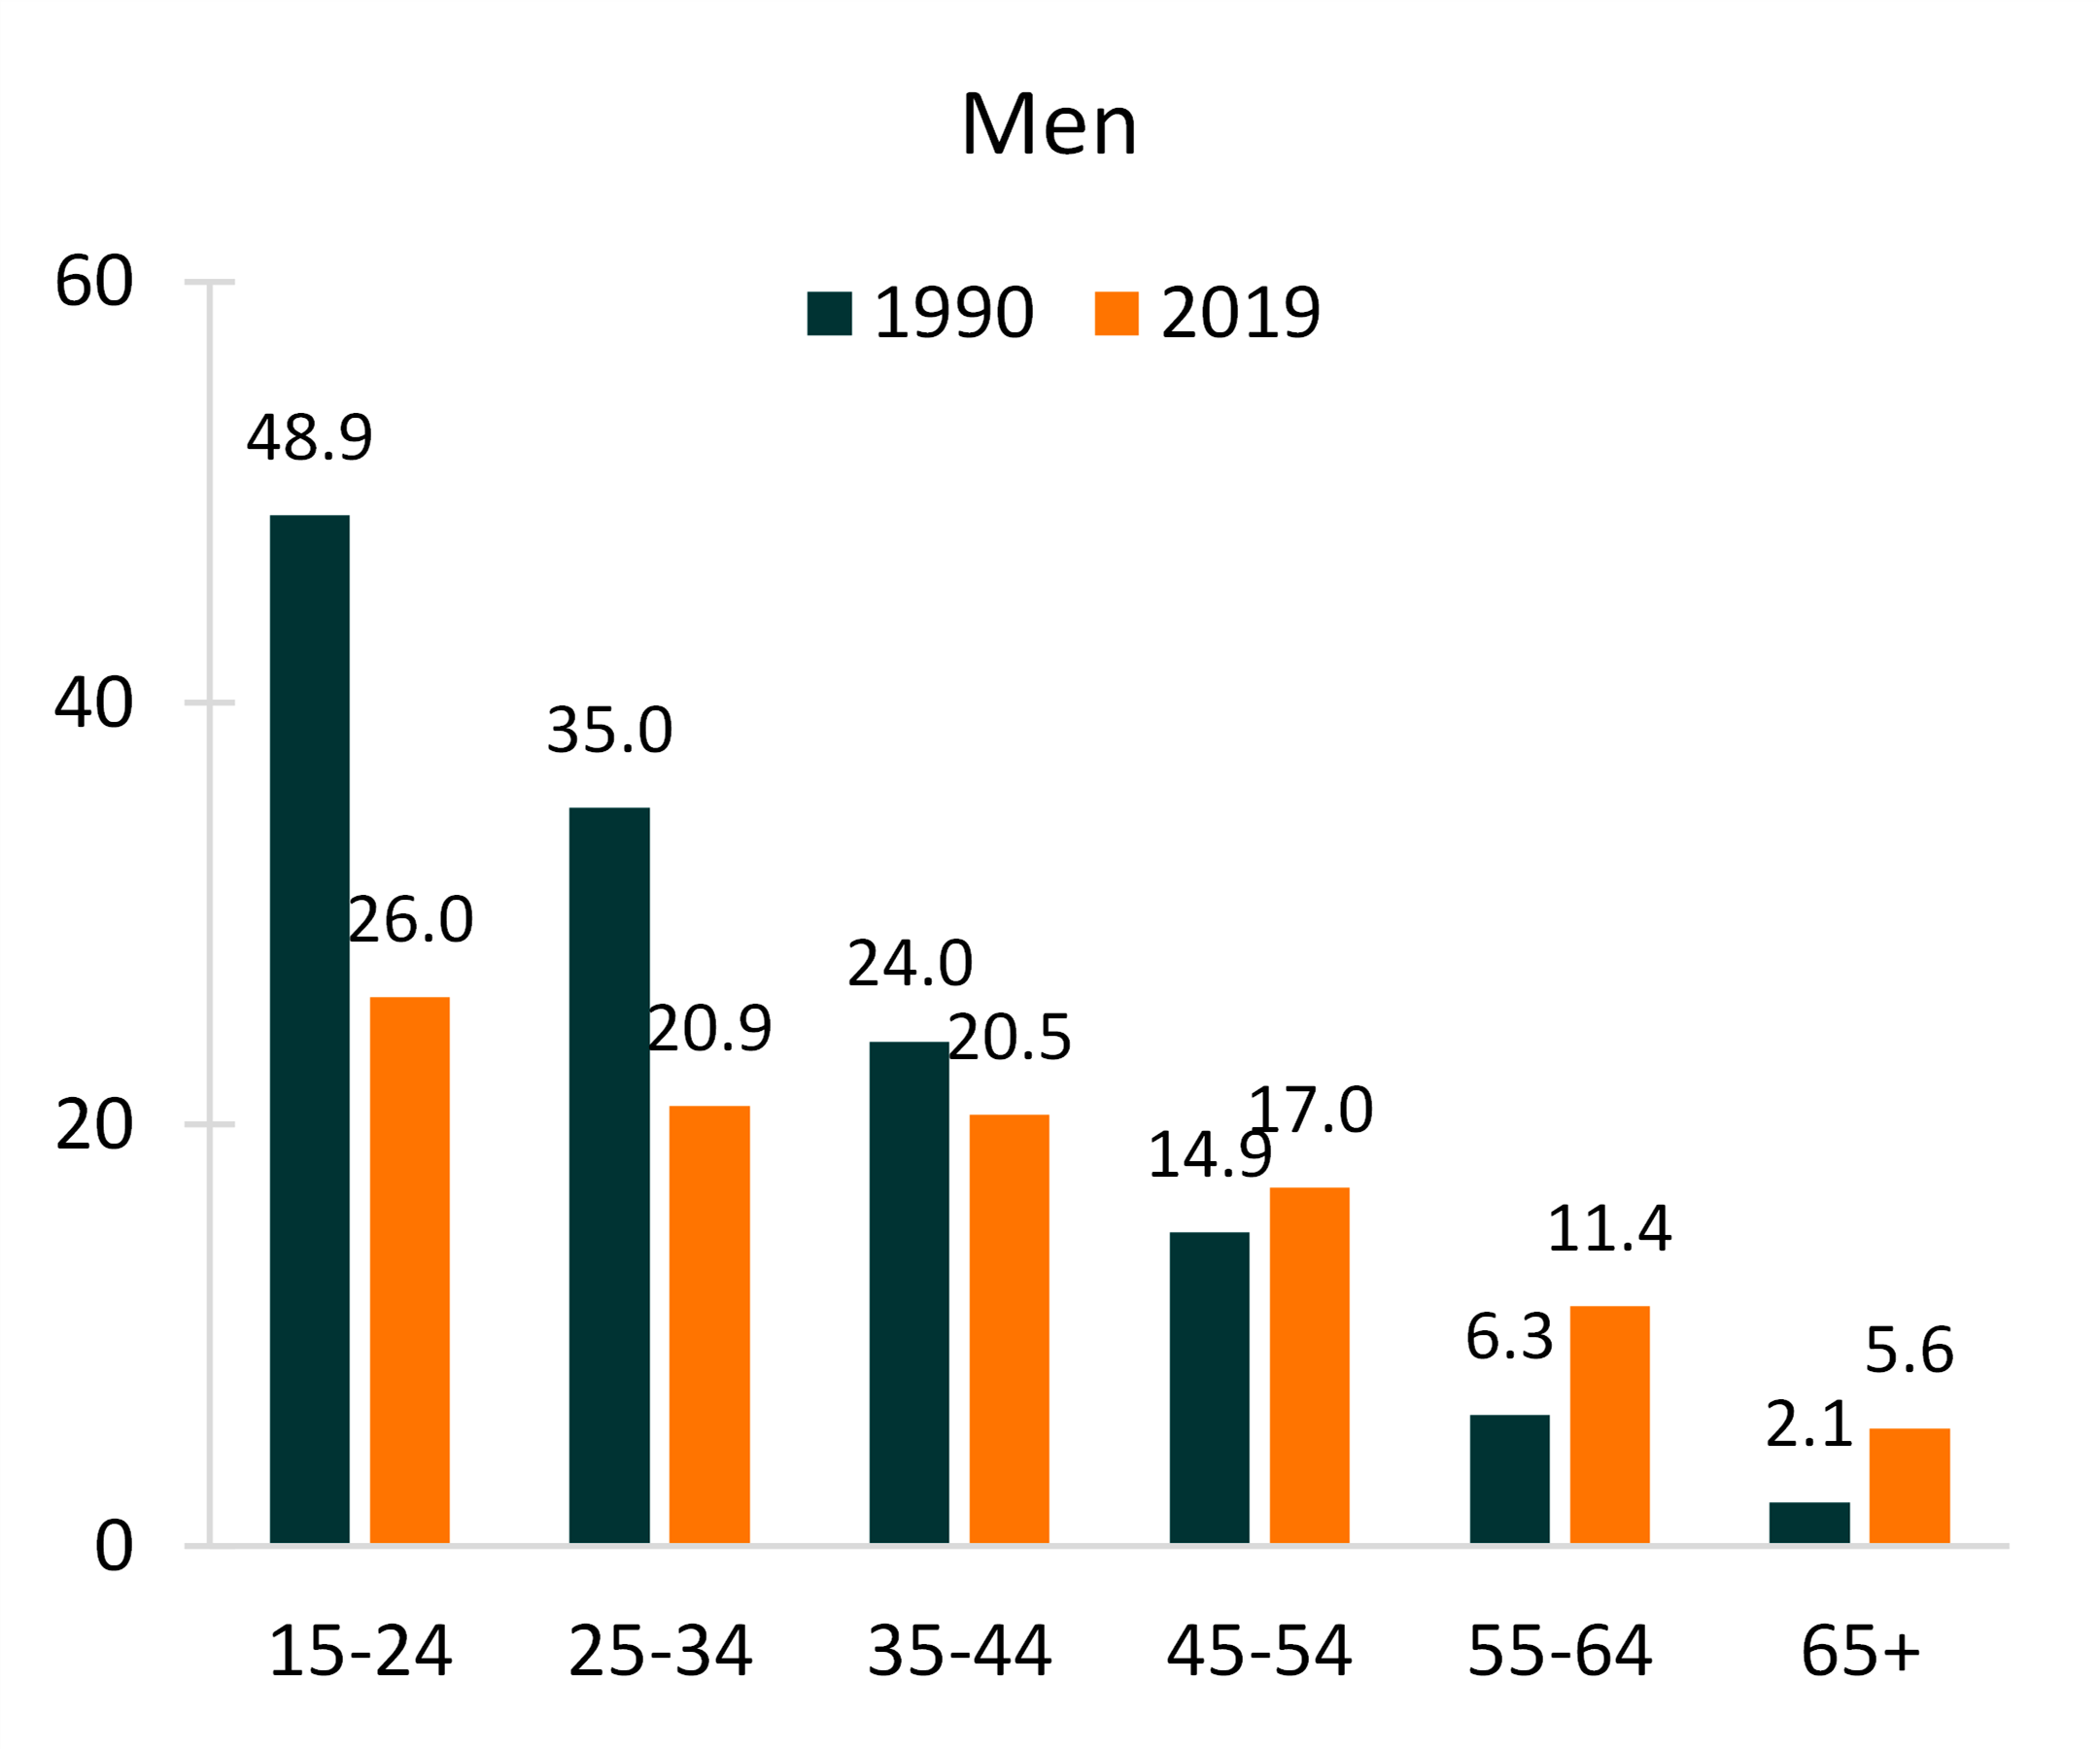
- For both men and women, divorce rates tended to decline with age, a pattern that has remain unchanged over time.
- Between 1990 and 2019, the divorce rates decreased for men aged 15 to 44 and women aged 15-24, staying stable for women 35-44. It increased for both men and women aged 45 and older.
- At older ages, the divorce rates for women exhibited the largest increases (the sharpest increase was for women aged 65 and older, increasing six-fold from 1 per 1,000 in 1990 to 6 per 1,000 in 2019).
- At younger ages, the divorce rates for men exhibited the largest decreases (the largest decrease between 1990 and 2019 was for men aged 15 to 24, from 49 per 1,000 to 26 per 1,000).
Figure 2. Divorce Rates by Age Groups and Gender


Sources: NCFMR analyses using the Centers for Disease Control and Prevention, National Center for Health Statistics, Vital Statistics and U.S. Census Bureau, American Community Survey, 2019.
Data Source
Centers for Disease Control and Prevention, National Center for Health Statistics, Vital Statistics, 1990
U.S. Census Bureau, American Community Survey, 1-year estimates, 2019.
References
Allred, C. (2019). Age variation in the divorce rate, 1990 & 2017. Family Profiles, FP-19-13. Bowling Green, OH: National Center for Family & Marriage Research. https://doi.org/10.25035/ncfmr/fp-19-13
Brown, S. L., & Lin, I.-F. (2012). The gray divorce revolution: Rising divorce among middle-aged and older adults, 1990-2010. The Journals of Gerontology Series B: Psychological Sciences and Social Sciences, 67(6), 731-741. https://doi.org/10.1093/geronb/gbs089
Kennedy, S., & Ruggles, S. (2014). Breaking up is hard to count: The rise of divorce in the United States, 1980-2010. Demography, 51(2), 587- 598. https://doi.org/10.1007/s13524-013-0270-9
Suggested Citation:
Carlson, L. (2021). Age Variation in the Divorce Rate, 1990 & 2019. Family Profiles, FP-21-16. Bowling Green, OH: National Center for Family & Marriage Research. https://doi.org/10.25035/ncfmr/fp-21-16

This project is supported with assistance from Bowling Green State University. From 2007 to 2013, support was also provided by the U.S. Department of Health and Human Services, Office of the Assistant Secretary for Planning and Evaluation. The opinions and conclusions expressed herein are solely those of the author(s) and should not be construed as representing the opinions or policy of any agency of the state or federal government.
Updated: 08/16/2021 12:50PM


