Age at Entry into Motherhood and Mothers’ Sociodemographic Characteristics, 2015-2018
Family Profile No. 05, 2020
Author: Lisa Carlson
In the U.S., women are entering motherhood at older ages, with the age at first birth rising from a mean of 21.4 in 1970 to 26.8 in 2017 (FP-18-25). Women who have first births at younger ages differ on a range of characteristics compared to women who become mothers at later ages, and maternal age is linked to children’s well-being (Gibson-Davis & Rackin, 2014; Brown, Stykes, & Manning, 2016; Rackin & Gibson-Davis, 2018). This profile uses the Current Population Survey’s 2018 June Fertility Supplement to identify mothers who had a first birth between 2015 and 2018. Education level, race/ethnicity, and union status of mothers are compared across three groups classified by age at first birth: younger mothers (less than 24 years old), mid-range age mothers (24 to 29 years old), and older mothers (30 years or older). Additional profiles using the June Fertility Supplement analyze trends in completed family size among women aged 40-44 by education and race/ethnicity (FP-20-04) and by union status (FP-20-03).
Education
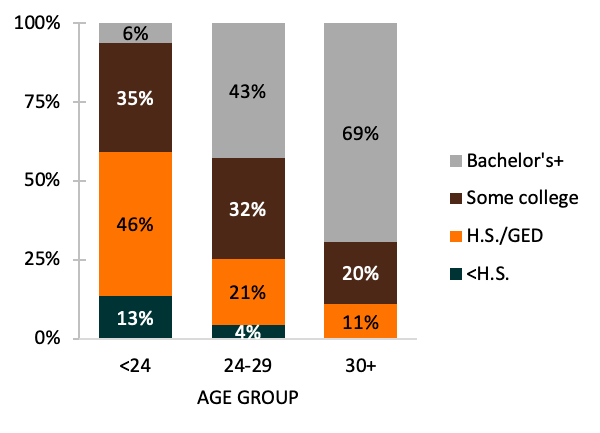
Higher levels of education were associated with an older age at first birth. Education was lowest among mothers with early first births (< 24 years old) and highest among mothers who were older (aged 30+) at the age of their first birth.
- While most mothers who were younger at first birth (<24 years old) had earned at least a high school degree, 13% had not. Less than one-tenth (6%) of young mothers had at least a bachelor’s degree. The most common educational level was high school diploma, at just under half (46%) of younger mothers.
- Among mothers experiencing a first birth at the mid-range (ages 24-29), the most common education category was a bachelor’s degree or more (43%). Nearly a third had some college, and one-fifth had a high school education.
- Education levels were highest among first-time mothers who were 30 and older with the majority of mothers in this group having a bachelor’s degree or more (69%).
Figure 1. Maternal Education by Age at First Birth, 2015-2018

Race/Ethnicity
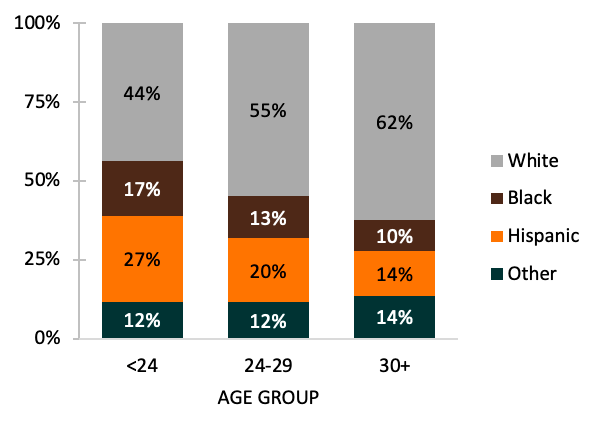
- Greater shares of Hispanic mothers and Black mothers entered motherhood at younger ages than at older ages.
- The median ages at first birth for Black and Hispanic mothers were 26 and 25, respectively, compared to almost 28 for White women and women of other races (not shown).
- The median ages at first birth for Black and Hispanic mothers were 26 and 25, respectively, compared to almost 28 for White women and women of other races (not shown).
- Younger mothers were disproportionately racial-ethnic minorities. About one-quarter (27%) of younger mothers were Hispanics, and 17% were Black.
- Among mothers having their first birth at mid-range ages (24-29), just over half (55%) were White, 20% were Hispanic, and 13% were Black.
- The majority (62%) of older first-time mothers (aged 30 or older) were White. Only one in ten of older mothers was Black, and 14% were Hispanic.
Figure 2. Maternal Race/Ethnicity by Age at First Birth, 2015-2018

Union Status
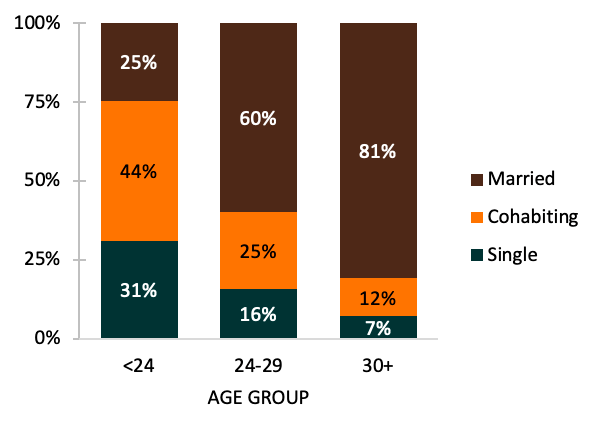
The union status of mothers varied according to their age at entry into motherhood.
- Three-fourths of younger mothers (< age 24 at first birth) were unmarried (either single or cohabiting). The most common union status for younger mothers was cohabitation (44%).
- The majority (60%) of mid-range aged mothers (ages 24-29) were married at first birth and a quarter were cohabiting at first birth.
- A large majority of mothers with first births experienced at ages 30 or older were married (81%). Among older mothers, only 12% were cohabiting, and even fewer (7%) were not living with a partner.
Figure 3. Maternal Union Status by Age at First Birth, 2015-2018

Data Sources
- Flood, S., King, M., Rodgers, R., Ruggles, S., & Warren, J. R. (2019) Integrated Public Use Microdata Series, Current Population Survey: Version 7.0 [dataset]. Minneapolis, MN: IPUMS. https://doi.org/10.18128/D030.V7.0
References
- Brown, S. L., Stykes, J. B., & Manning, W. D. (2018). Trends in children’s family instability, 1995-2010. Journal of Marriage and Family, 78(5), 1173-1183. doi.org/10.1111/jomf.12311
- Gibson-Davis, C. & Rackin, H. (2014). Marriage or carriage? Trends in union context and birth type by education. Journal of Marriage and Family, 76(3), 506-519. doi.org/10.1111/jomf.12109
- Guzzo, K. B., & Payne, K. K. (2018). Average age at first birth, 1970-2017. Family Profiles, FP-18-25. Bowling Green, OH: National Center for Family & Marriage Research. https://doi.org/10.25035/ncfmr/fp-18-25
- Hemez, P. (2018). Young adulthood: Cohabitation, birth, and marriage experiences. Family Profiles, FP-18-22. Bowling Green, OH: National Center for Family & Marriage Research. https://doi.org/10.25035/ncfmr/fp-18-22
- Hemez, P. (2019). Family formation experiences: Women’s median ages at first marriage and first birth, 1979 & 2016. Family Profiles, FP-19-16. Bowling Green, OH: National Center for Family & Marriage Research. https://doi.org/10.25035/ncfmr/fp-19-16
- Rackin, H. M. & Gibson-Davis, C. M. (2016). Social class divergence in family transitions: The importance of cohabitation. Journal of Marriage and Family, 80(5), 1271-1286. doi.org/10.1111/jomf.12522
Suggested Citation
- Carlson, L. (2020). Age at entry into motherhood and mothers’ sociodemographic characteristics, 2015-2018. Family Profiles, FP-17-22. Bowling Green, OH: National Center for Family & Marriage Research. https://doi.org/10.25035/ncfmr/fp-20-05
Updated: 11/07/2025 03:09PM


