Trends in Non-Marriage Among Men, 2005-2019
Family Profile No. 01, 2022
Author: Adrianne R. Brown and Karen B. Guzzo
Marital behavior has changed dramatically in the U.S. (FP-21-24), with variation across sociodemographic characteristics such as education and race-ethnicity (FP-21-12). Using data from the American Community Survey (ACS), this profile examines the share of never-married men aged 35-39 by race-ethnicity and educational attainment. We focus on those aged 35-39 because this age bracket is above the median age of first marriage (the age in which at least 50% of men were married) in 2019 (FP-21-12) and captures most first marital experiences. White, Black, and Asian refers to those who are non-Hispanic and report a single race in the ACS, and Hispanic refers to those who report their ethnicity as Hispanic, regardless of race. Those with a two-year degree are included in the “some college” category.
- Overall, the share of men aged 35-39 who had never married was 32% in 2019, up from 21% in 2005 (not shown). The educational disparities among never married men have widened over this time span.
White Men
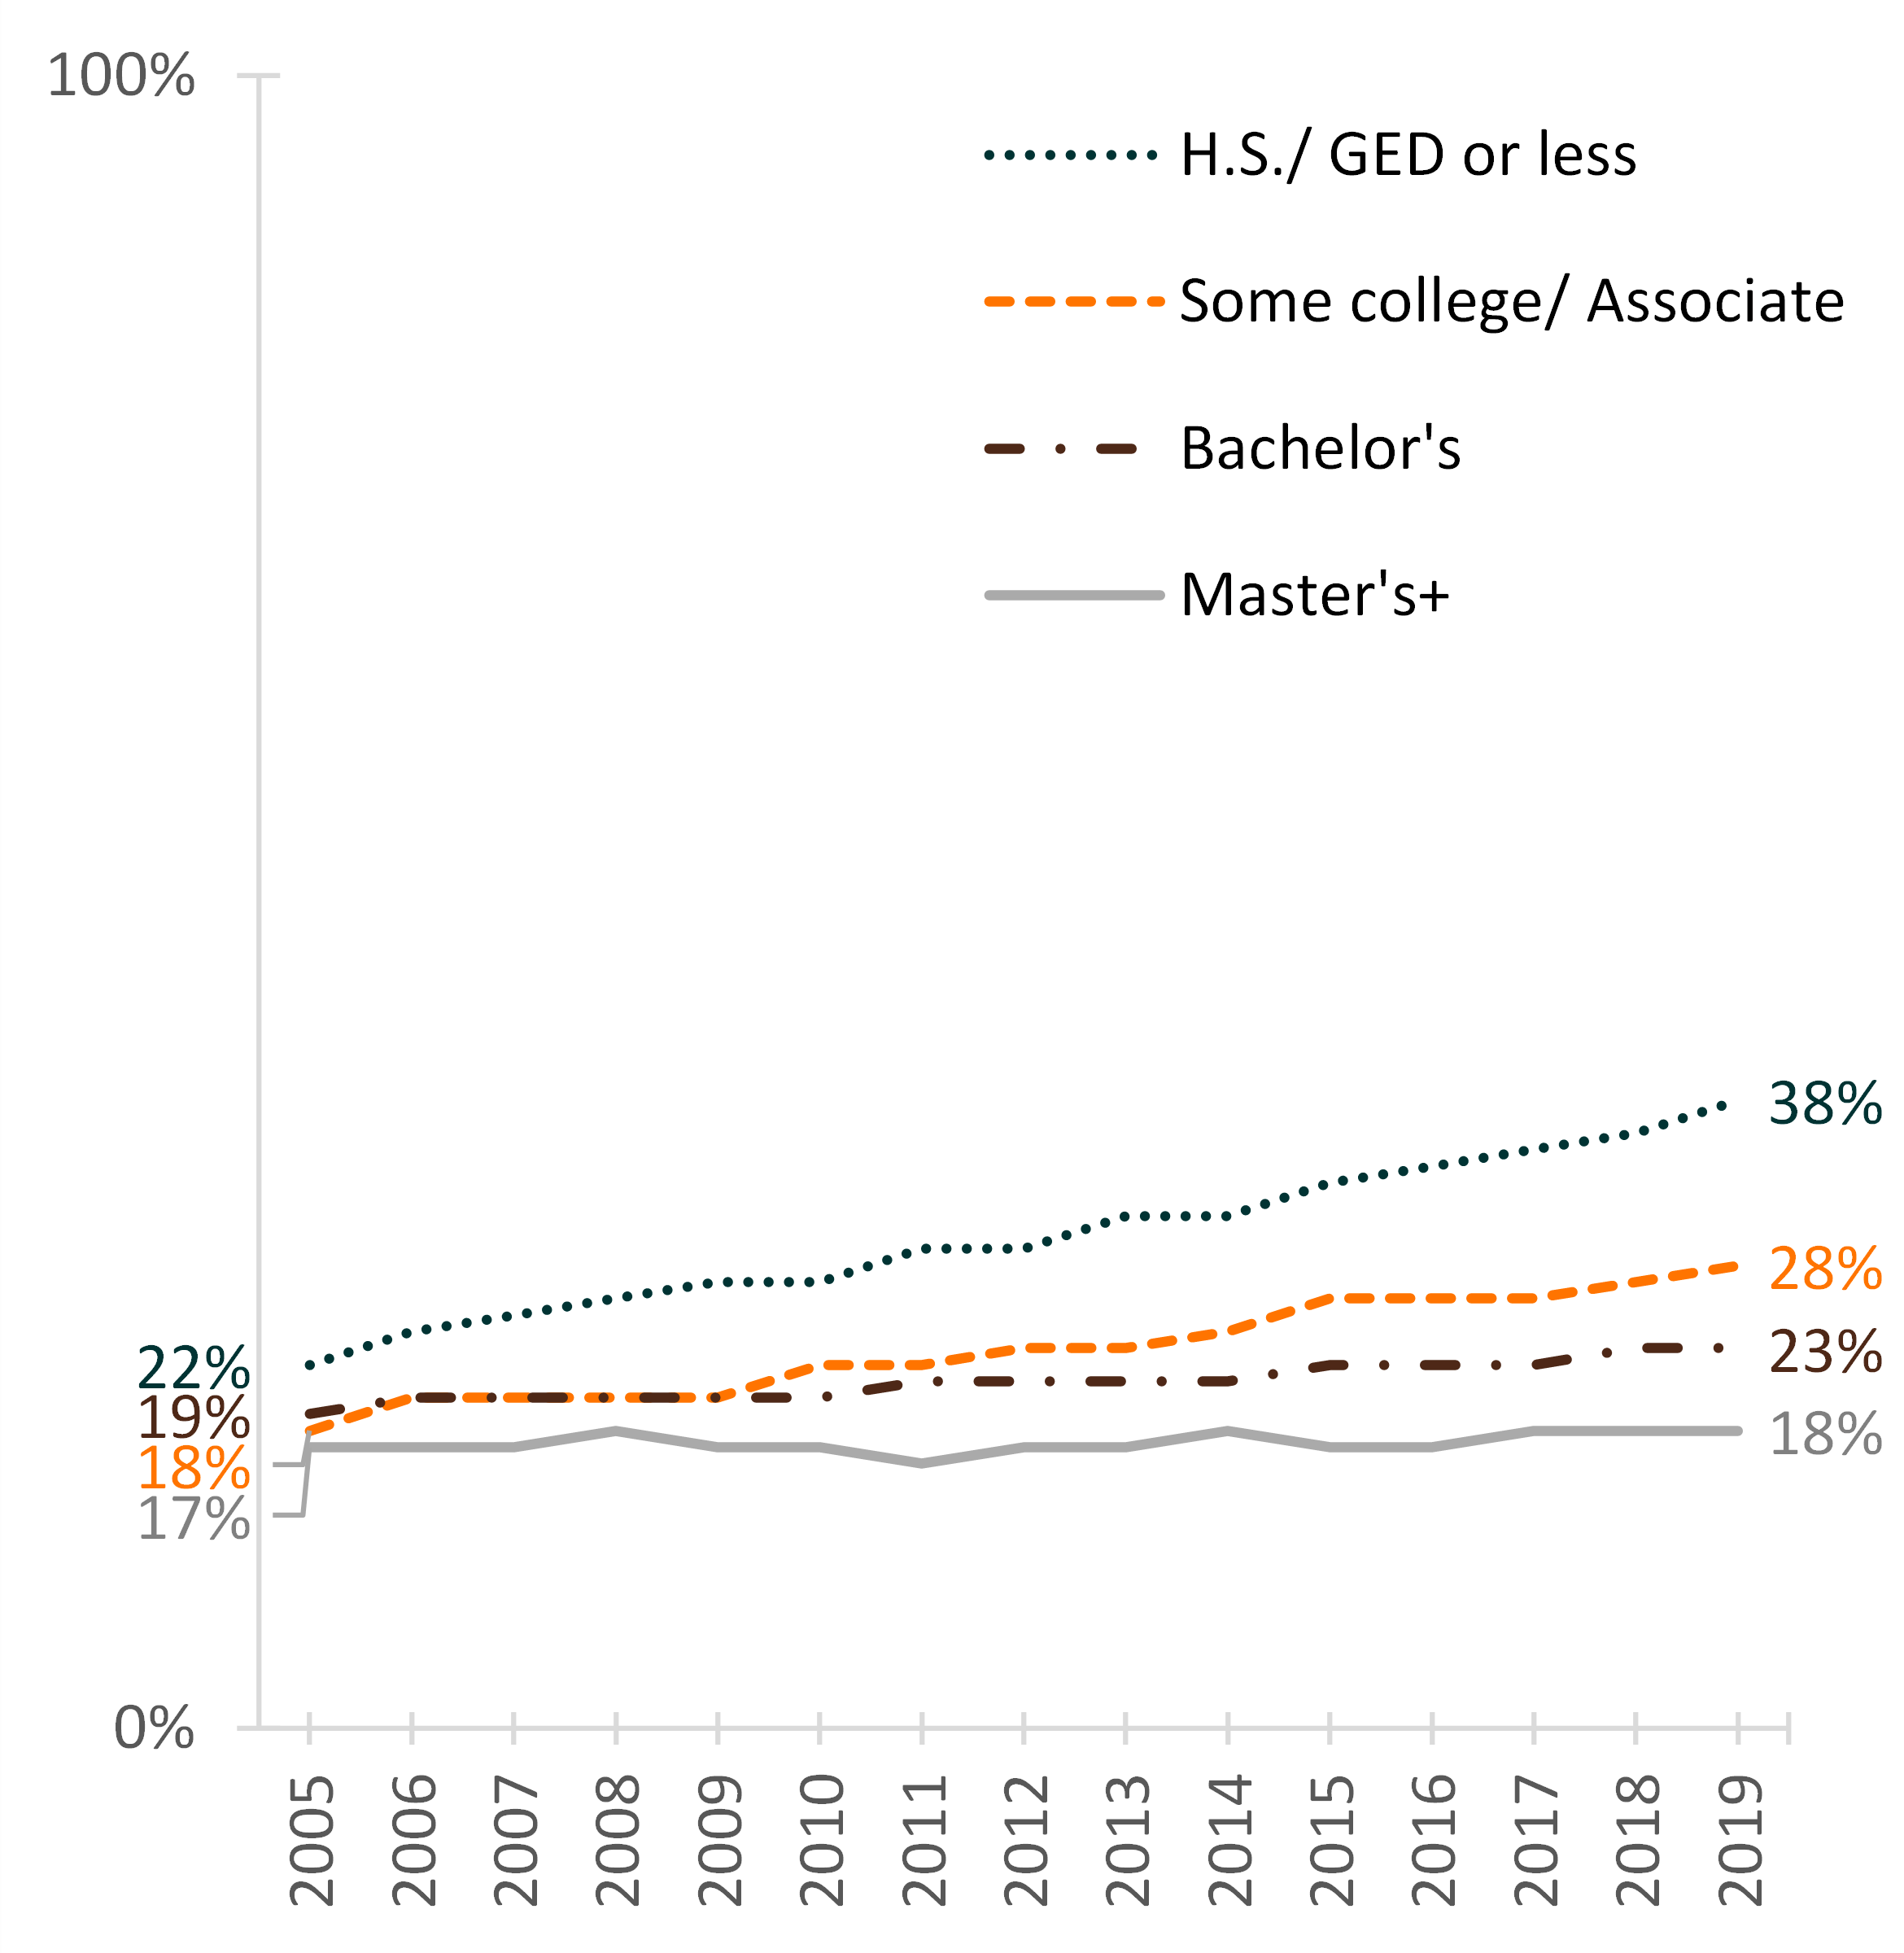
- In 2005, the education gradient in marriage was quite narrow. About one in five (22%) of White men aged 35-39 in the lowest education category—H.S. diploma or less—had never married, compared to 17% in the highest education category—post-graduate degree.
- Between 2005 and 2019, the greatest change occurred among those with modest educational attainment. The share of never-married White men aged 35-39 with a H.S. diploma or less increased substantially to nearly two-fifths.
- In contrast, there was little change among those with the highest education levels. In 2019, 18% of men with a post-graduate degree remained unmarried.
Black Men
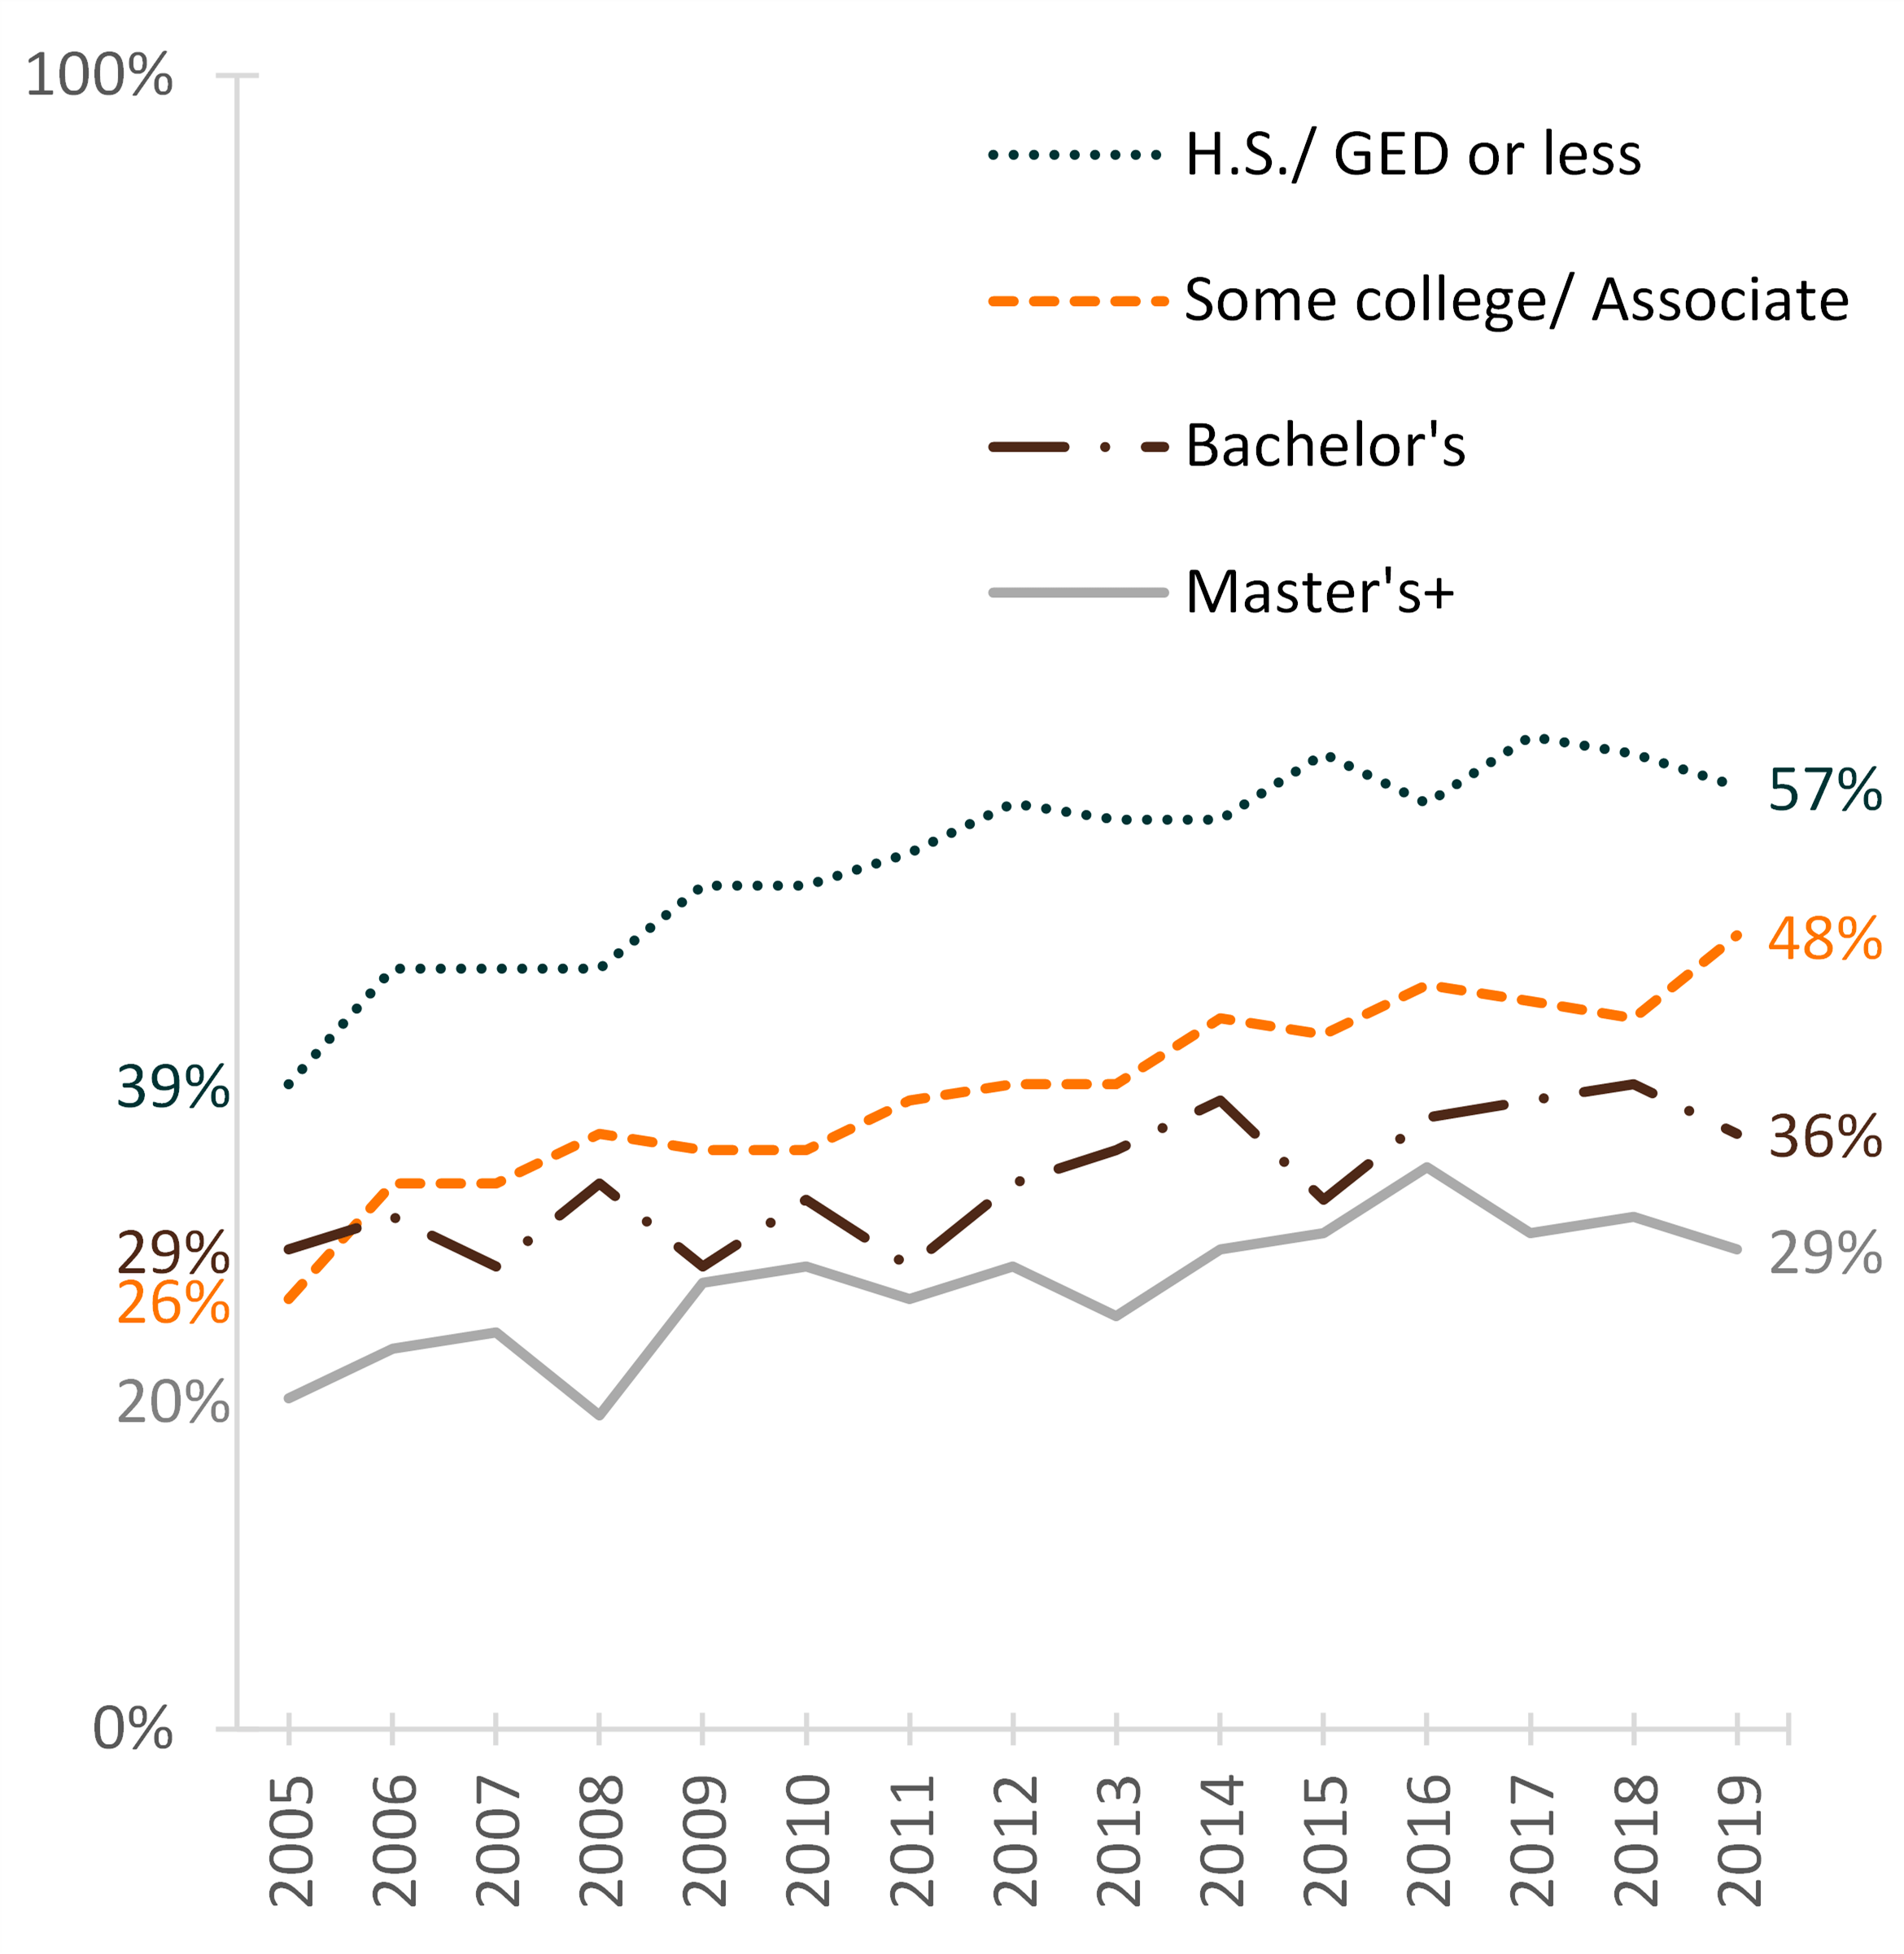
- In 2005, nearly two-fifths of Black men aged 35-39 with a H.S. diploma or less had never married, compared to just one-fifth of those with a post-graduate degree.
- Between 2005 and 2019, the share of Black men who never married rose to 57% among those with a H.S. diploma or less, but the largest absolute increase was among those with some college, rising from 26% to 48%.
- Conversely, those with a bachelor’s degree but no post-graduate degree had the smallest change—36% had never been married in 2019, up from 29% in 2005.
Figure 1. Share of Never-Married White Men Aged 35-39 by Education, 2005-2019

Figure 2. Share of Never-Married Black Men Aged 35-39 by Education, 2005-2019

Source: NCFMR analyses of the American Community Survey 1-year estimates, 2005-2019
Hispanic Men
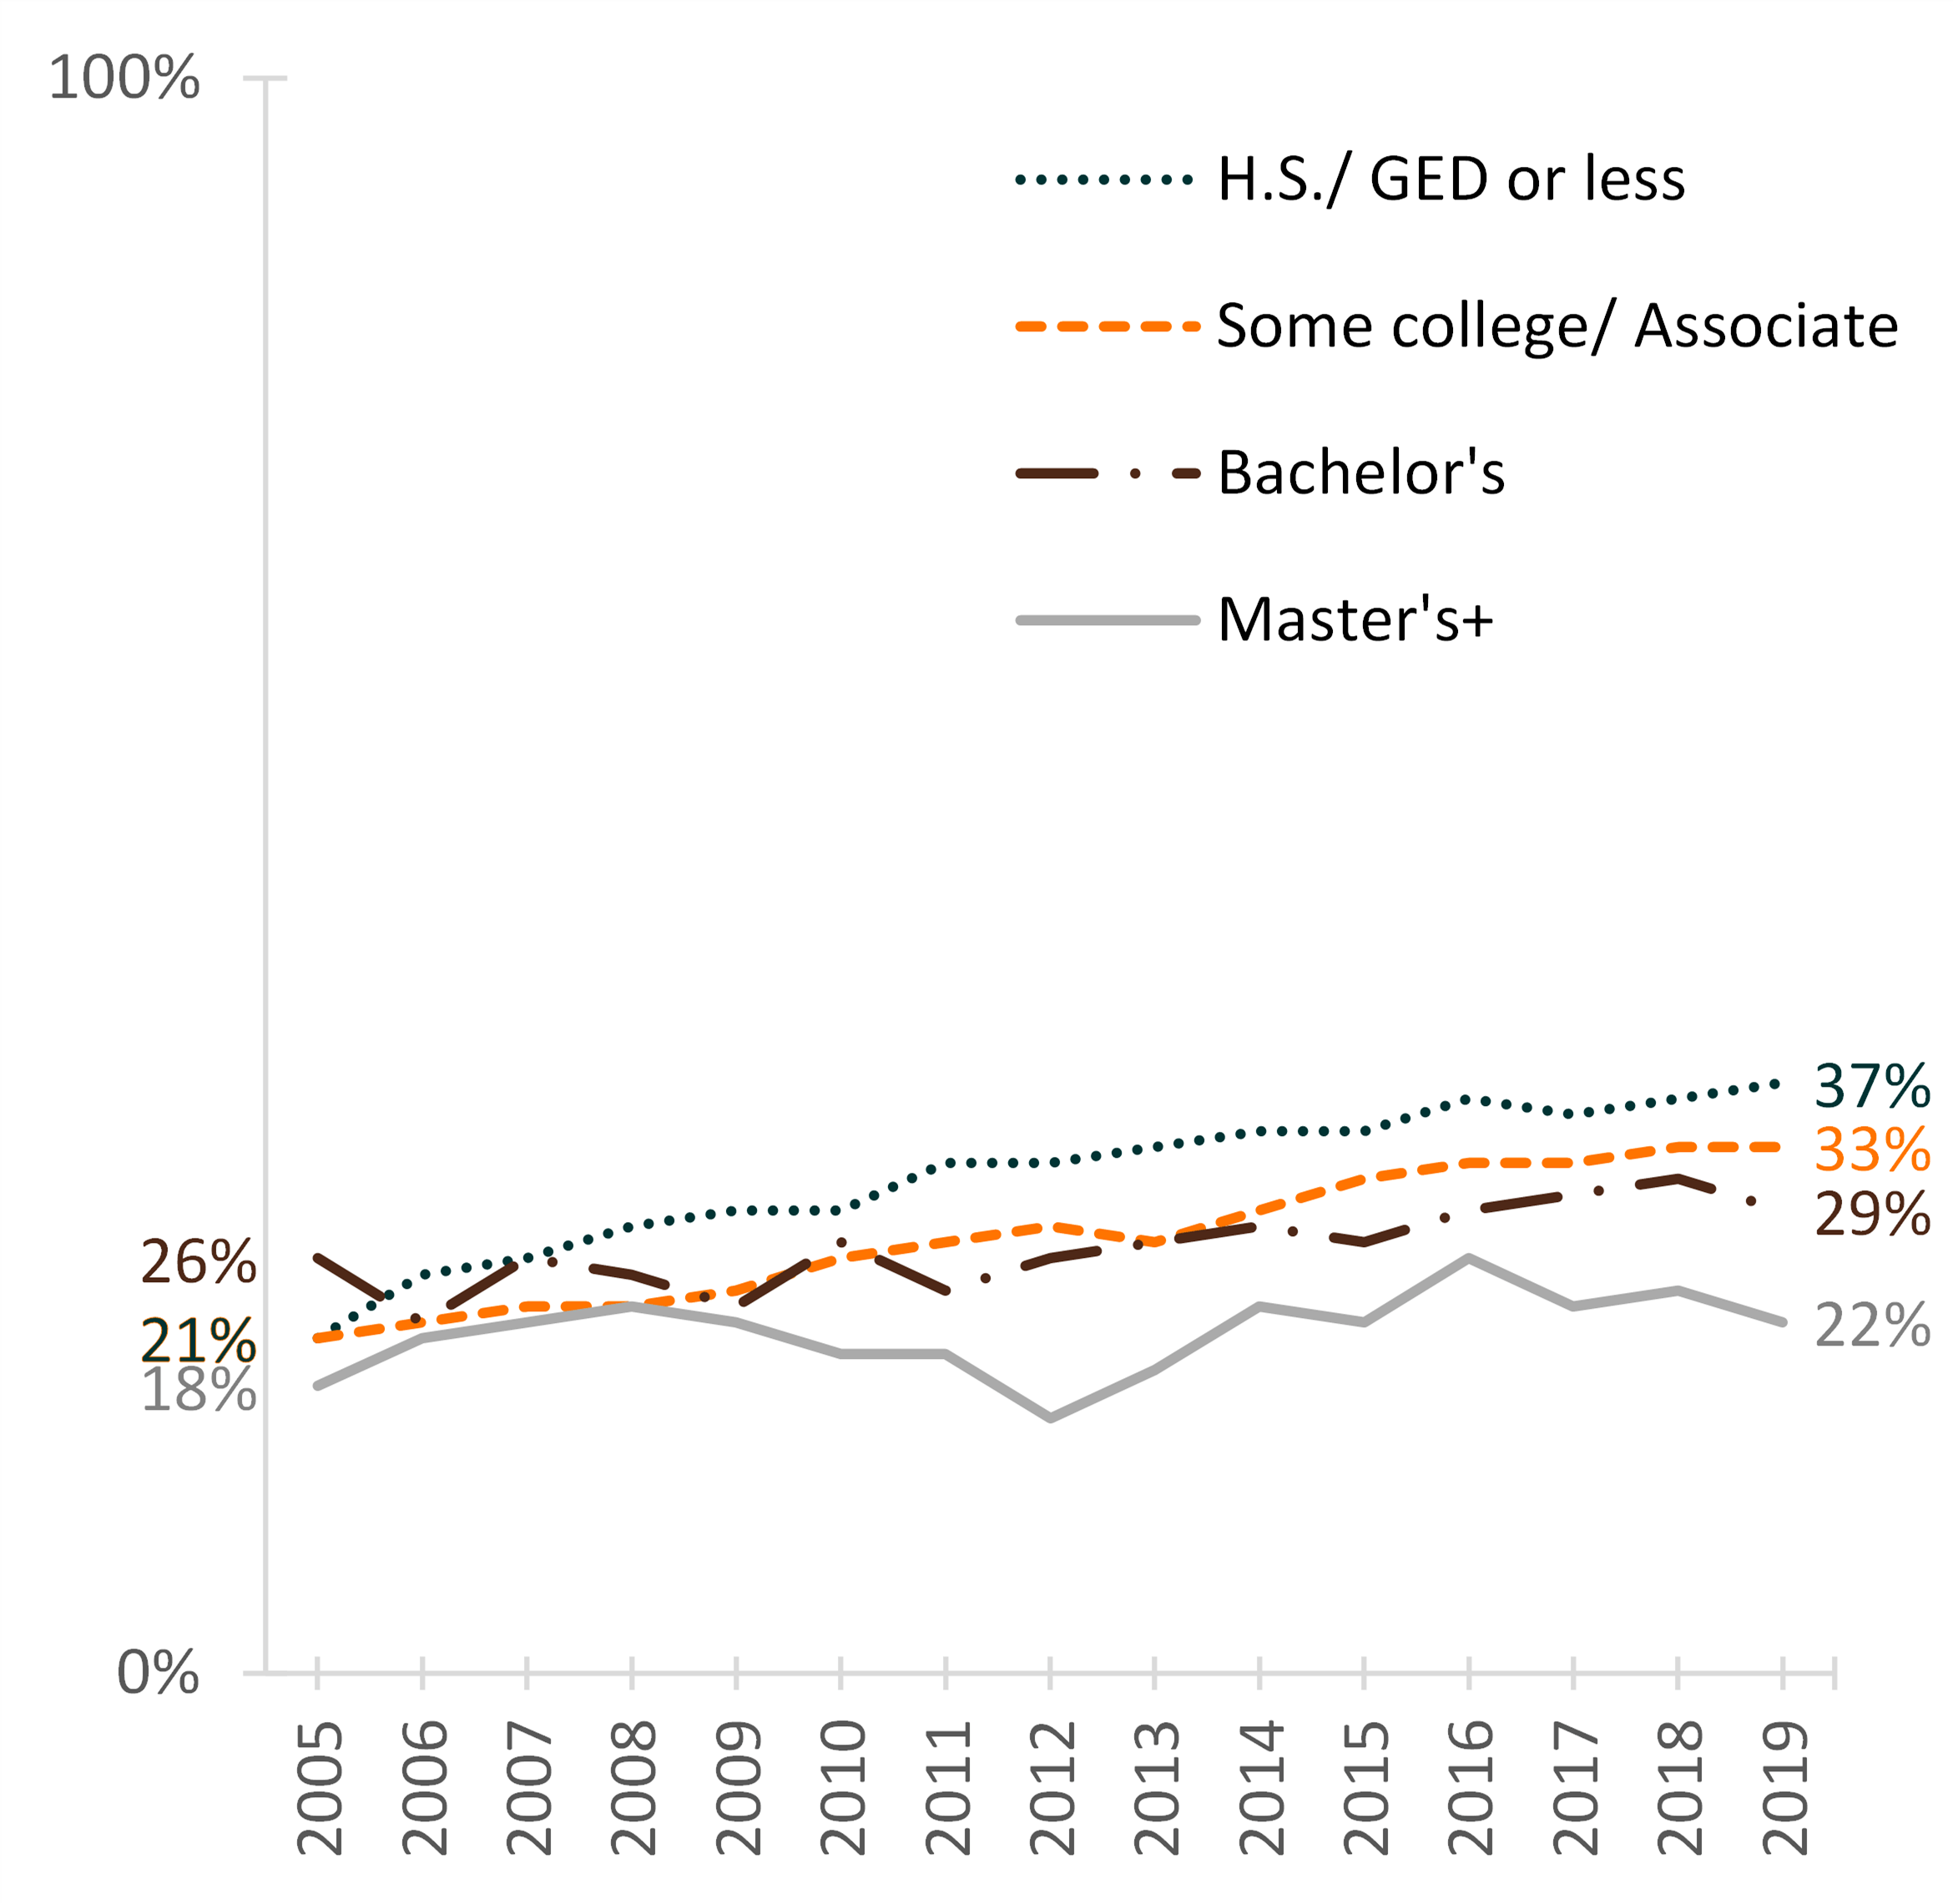
- In 2005, among Hispanic men aged 35-39, there were few differentials in marriage by education level. The largest share never married was 26% among those with a bachelor’s degree, whereas the smallest share was 18% among those with a post-graduate degree.
- Between 2005 and 2019, the share of unmarried Hispanic men increased among all educational attainment groups. The largest increase was among those with a H.S. diploma or less.
- The smallest change occurred among those with a post-graduate degree; in 2019, 22% had never married.
Asian Men
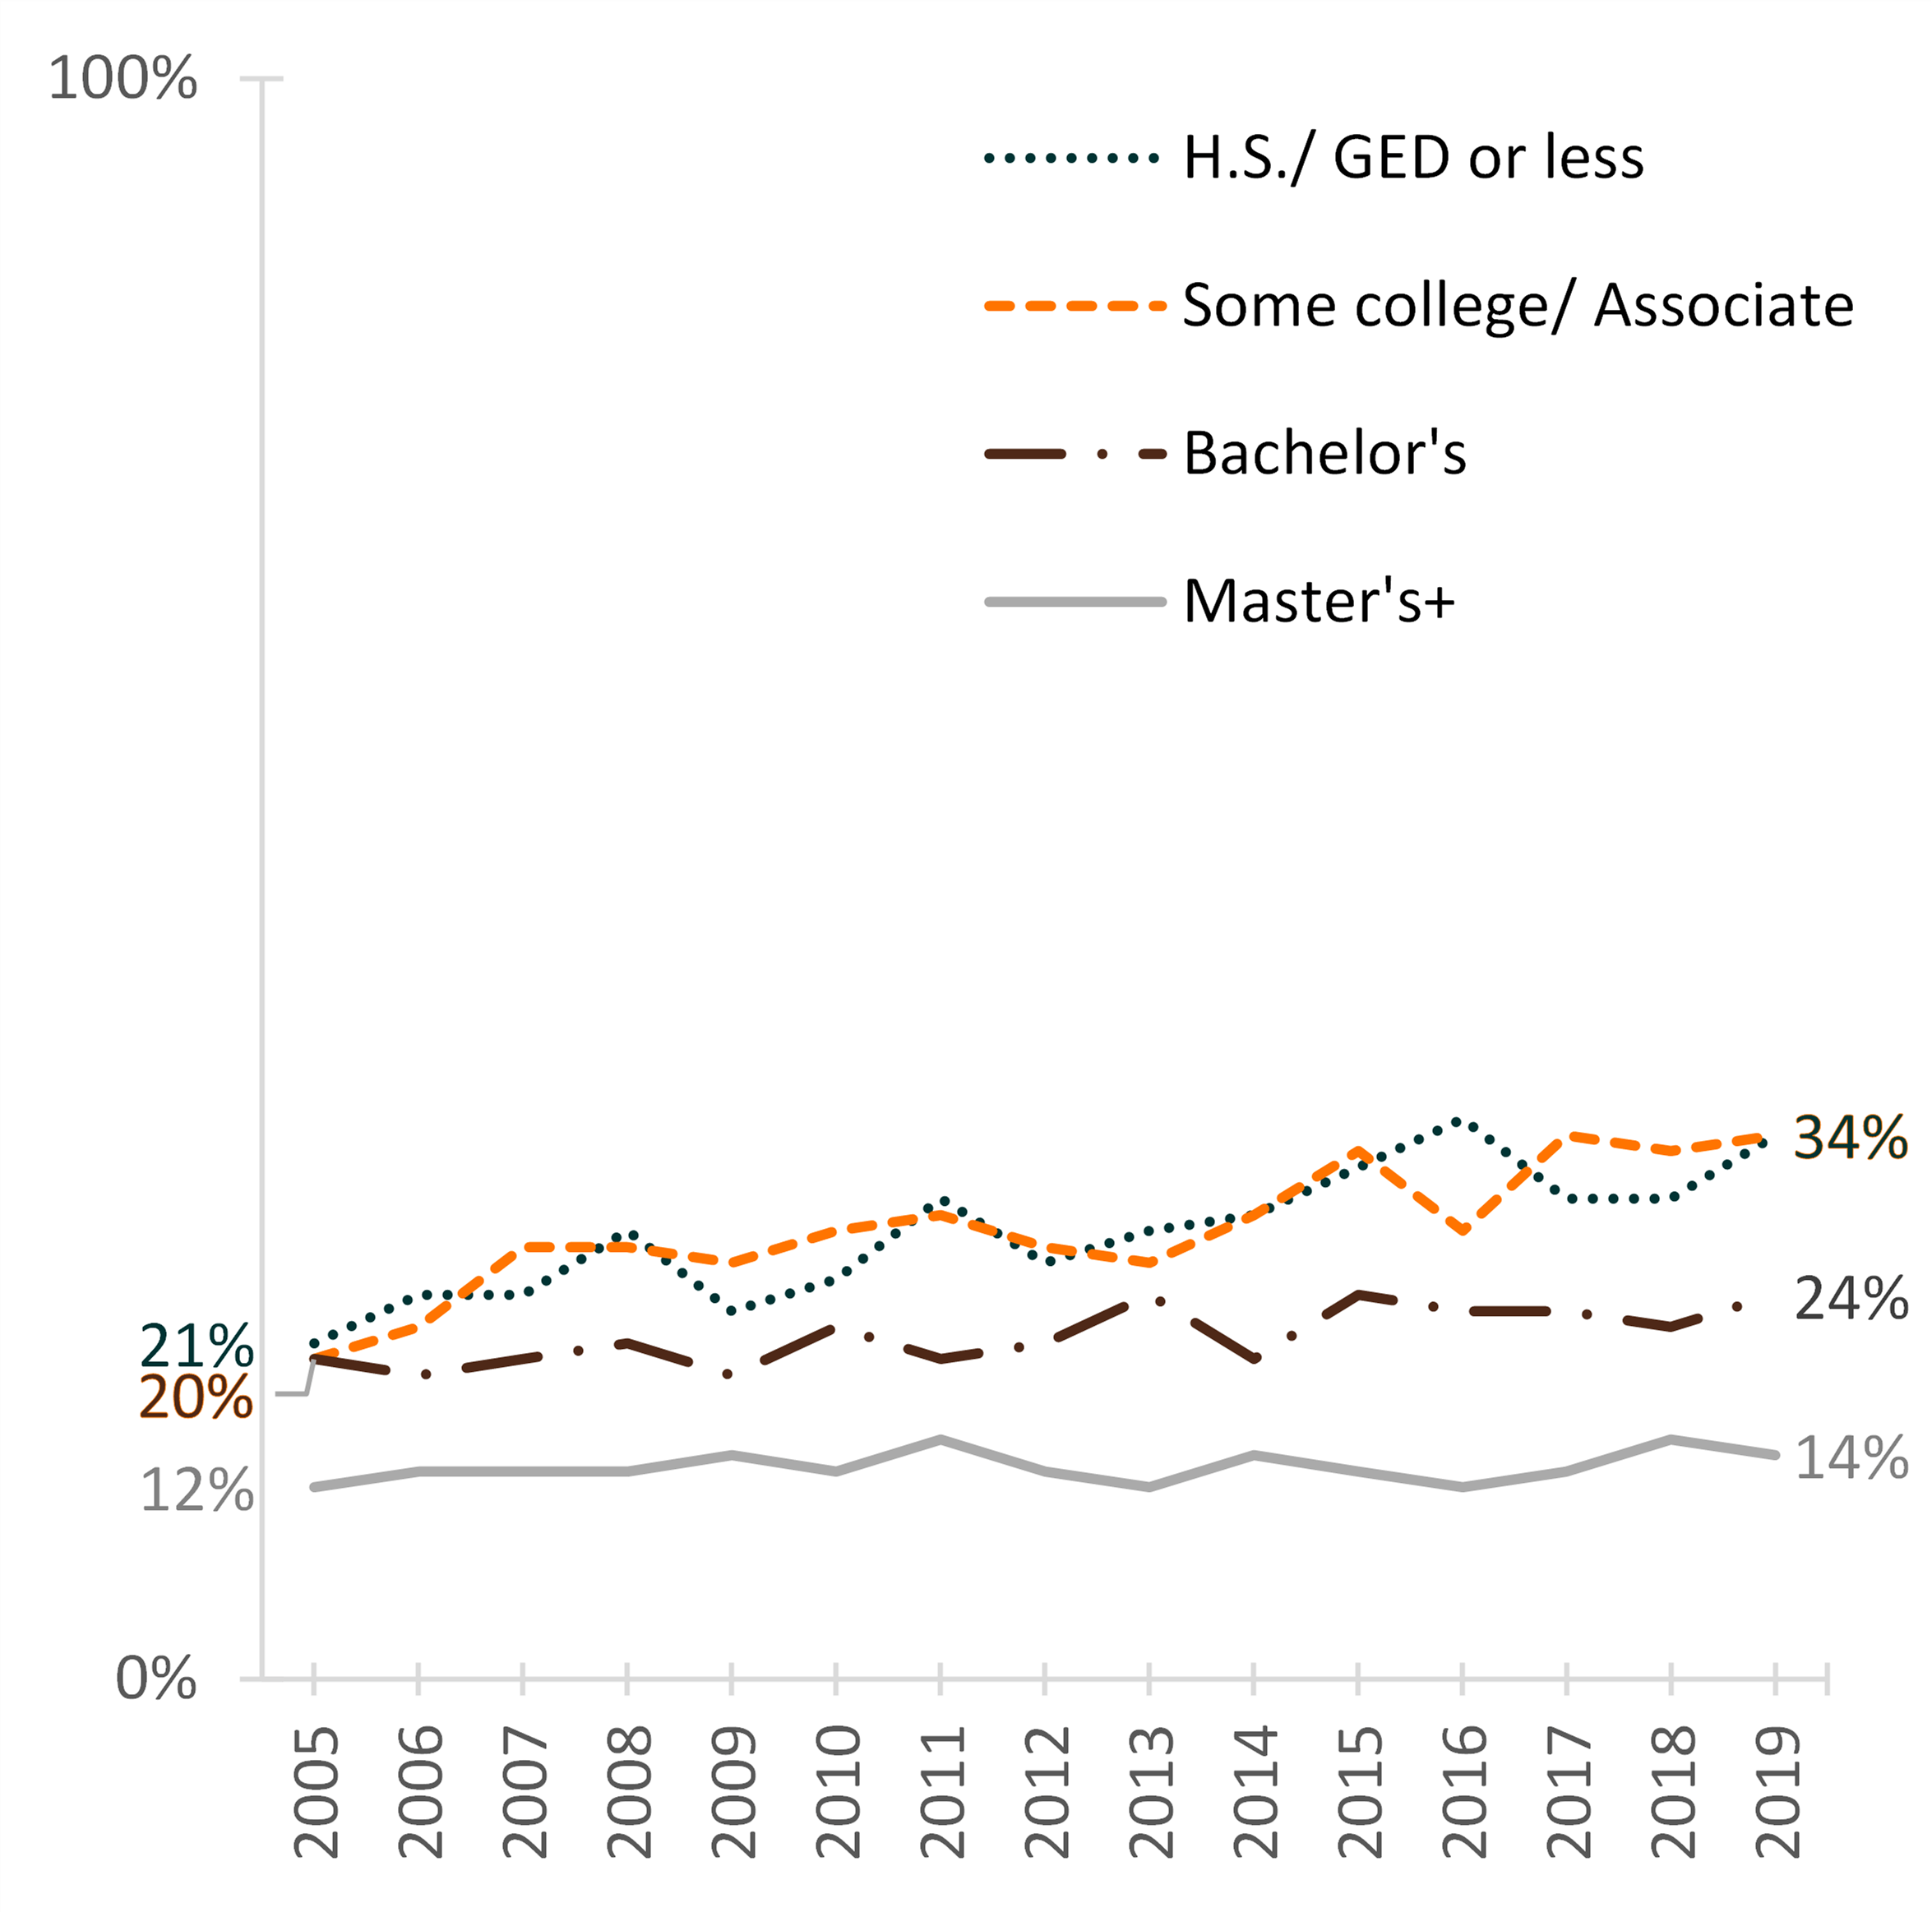
- In 2005, the share of never-married Asian men aged 35-39 was about 20% among those without a post-graduate degree. Only 12% of men with a post-graduate degree had not married in 2019.
- Between 2005 and 2019, the share never married increased the most among those with some college—from 20% in 2005 to 34% in 2019.
- The smallest increase was found among those with a post-graduate degree. Their share only increased to 14% in 2019.
Figure 3. Share of Never-Married Hispanic Men Aged 35-39 by Education, 2005-2019

Figure 4. Share of Never-Married Asian Men Aged 35-39 by Education, 2005-2019

Source: NCFMR analyses of the American Community Survey 1-year estimates, 2005-2019
Data Source
- Ruggles, S. Flood, S., Foster, S., Goeken, R., Pacas, J., Schouweiler, M., & Sobek, M. (2021). IPUMS USA: Version 11.0 [dataset]. Minneapolis, MN: IPUMS. https://doi.org/10.18128/D010.V11.0
References
- Payne, K. K. (2019). Median age at first marriage, 2019. Family Profiles, FP-21-12. Bowling Green, OH: National Center for Family & Marriage Research. https://doi.org/10.25035/ncfmr/fp-21-12
- Payne, K. K. (2021). Marital experiences in the U.S., 1996 & 2018. Family Profiles, FP-21-24. Bowling Green, OH: National Center for Family & Marriage Research. https://doi.org/10.25035/ncfmr/fp-21-24
Suggested Citation
- Brown, A. R. & Guzzo, Karen B. (2022). Trends in Non-Marriage Among Men, 2005-2019. Family Profiles, FP-22-01. Bowling Green, OH: National Center for Family & Marriage Research. https://doi.org/10.25035/ncfmr/fp-22-01

This project is supported with assistance from Bowling Green State University. From 2007 to 2013, support was also provided by the U.S. Department of Health and Human Services, Office of the Assistant Secretary for Planning and Evaluation. The opinions and conclusions expressed herein are solely those of the author(s) and should not be construed as representing the opinions or policy of any agency of the state or federal government.
Updated: 01/19/2022 11:44AM


