High School Seniors’ Expectations to Marry, 2020
This Family Profile is an update of :
FP-19-11
Family Profile No. 04, 2022
Author: Adrianne R. Brown
The marriage rate in the United States decreased from 76.5 marriages per 1,000 unmarried women in 1970 to 30.5 in 2019 (FP-20-24). Despite growing shares of men and women never marrying (FP-22-01; FP-22-02), most young people are not definitively rejecting marriage in the future. Using data from the Monitoring the Future study, this profile examines trends in high school seniors’ expectations to marry by parental educational attainment, gender, and race/ethnicity. This profile updates previous profiles on high school seniors’ expectations to marry using the most recent data available (FP-19-11; FP-16-14) and is a companion profile to High School Seniors' Attitudes Towards Cohabitation as a Testing Ground for Marriage (FP-22-03).
Expectations to Marry Over Time
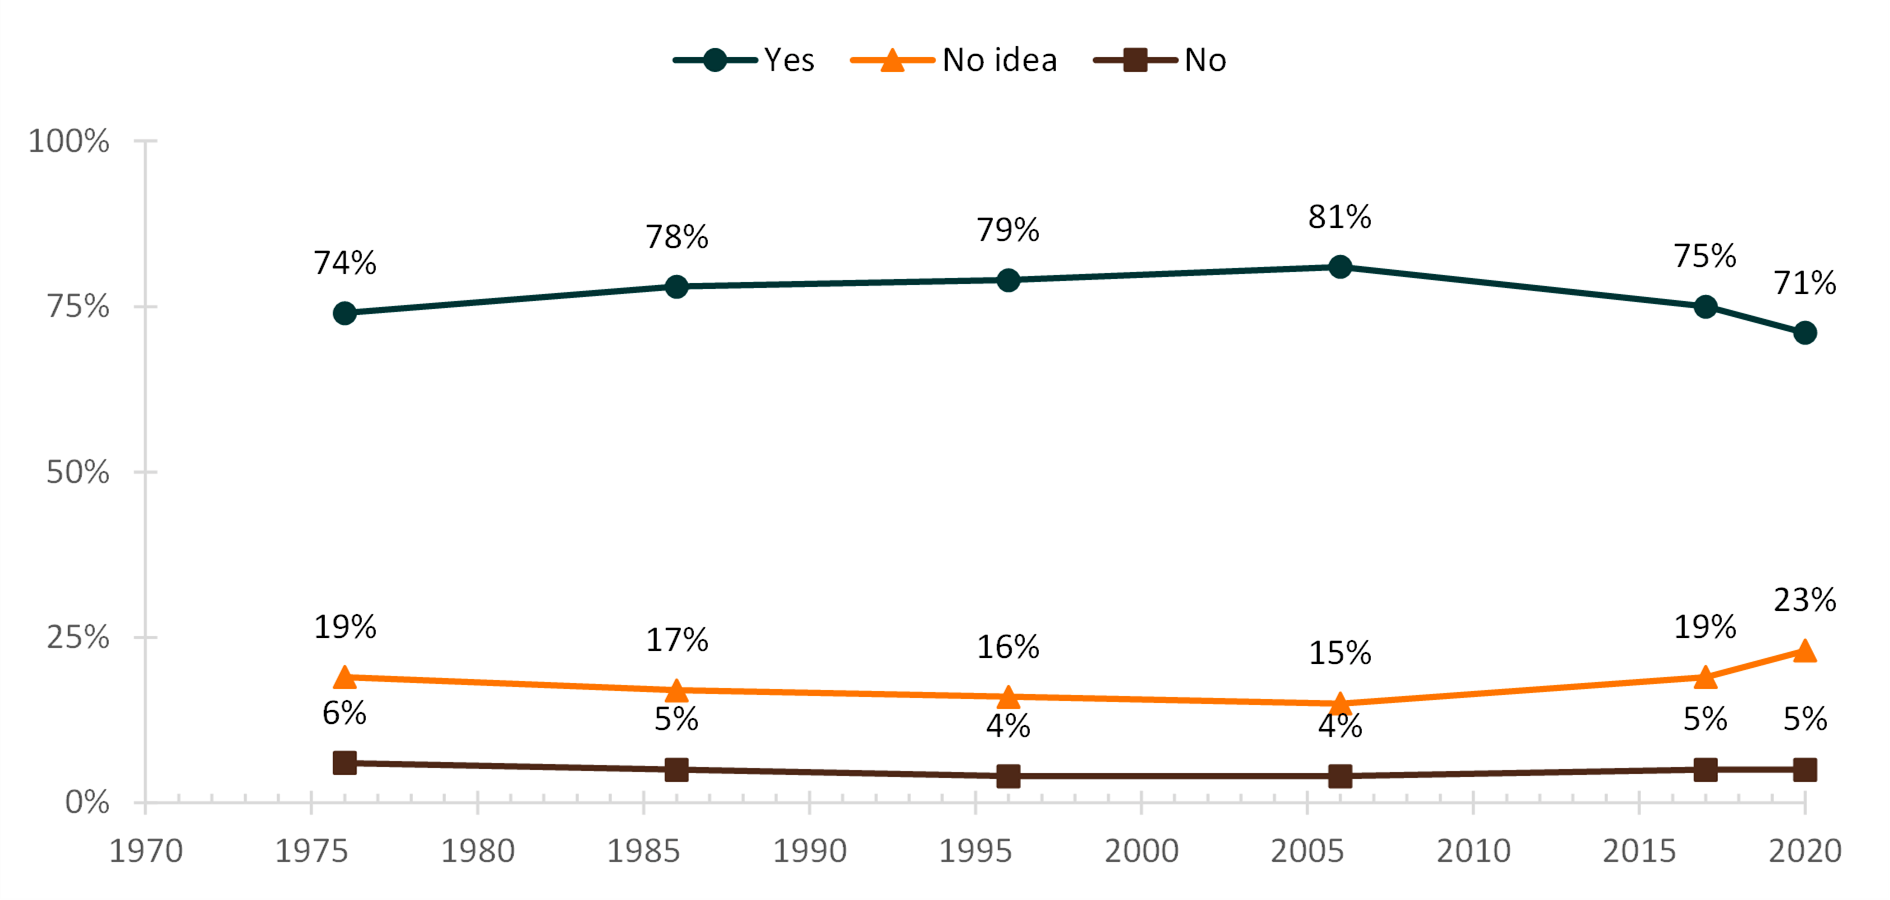
- In 2020, seven out of ten (71%) high school seniors reported they expect to marry in the future. This proportion is down from a high of eight out of ten (81%) high school seniors in 2006.
- The share of high school seniors who do not expect to marry has remained low (between 4% and 6%) throughout the period.
- The share of those who have “no idea” has increased from a low of 15% in 2006 to a high of 23% in 2020.
Figure 1. High School Seniors’ Expectations to Marry, 1976-2020

Expectations to Marry by Parental Educational Attainment
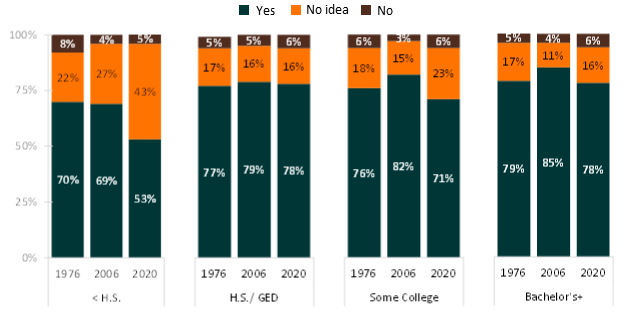
- At each time point, a smaller share of high school seniors whose parents had less than a high school diploma reported they expected to marry in the future and a larger share reported they had “no idea” about their expectation to marry compared to those whose parents had more education.
- In 2020, a little over half (53%) of high school seniors whose parents had less than a high school diploma expected to marry compared to approximately three-quarters of those whose parents had completed high school, some college, or obtained a bachelor’s degree (78%, 71%, and 78%, respectively).
- The share of high school seniors who reported they had “no idea” about their marriage expectations increased to 43% for those whose parents had less than a high school degree.
Figure 2. High School Seniors’ Expectation to Marry by Parental Educational Attainment, 1976, 2006, and 2020

Expectations to Marry by Gender
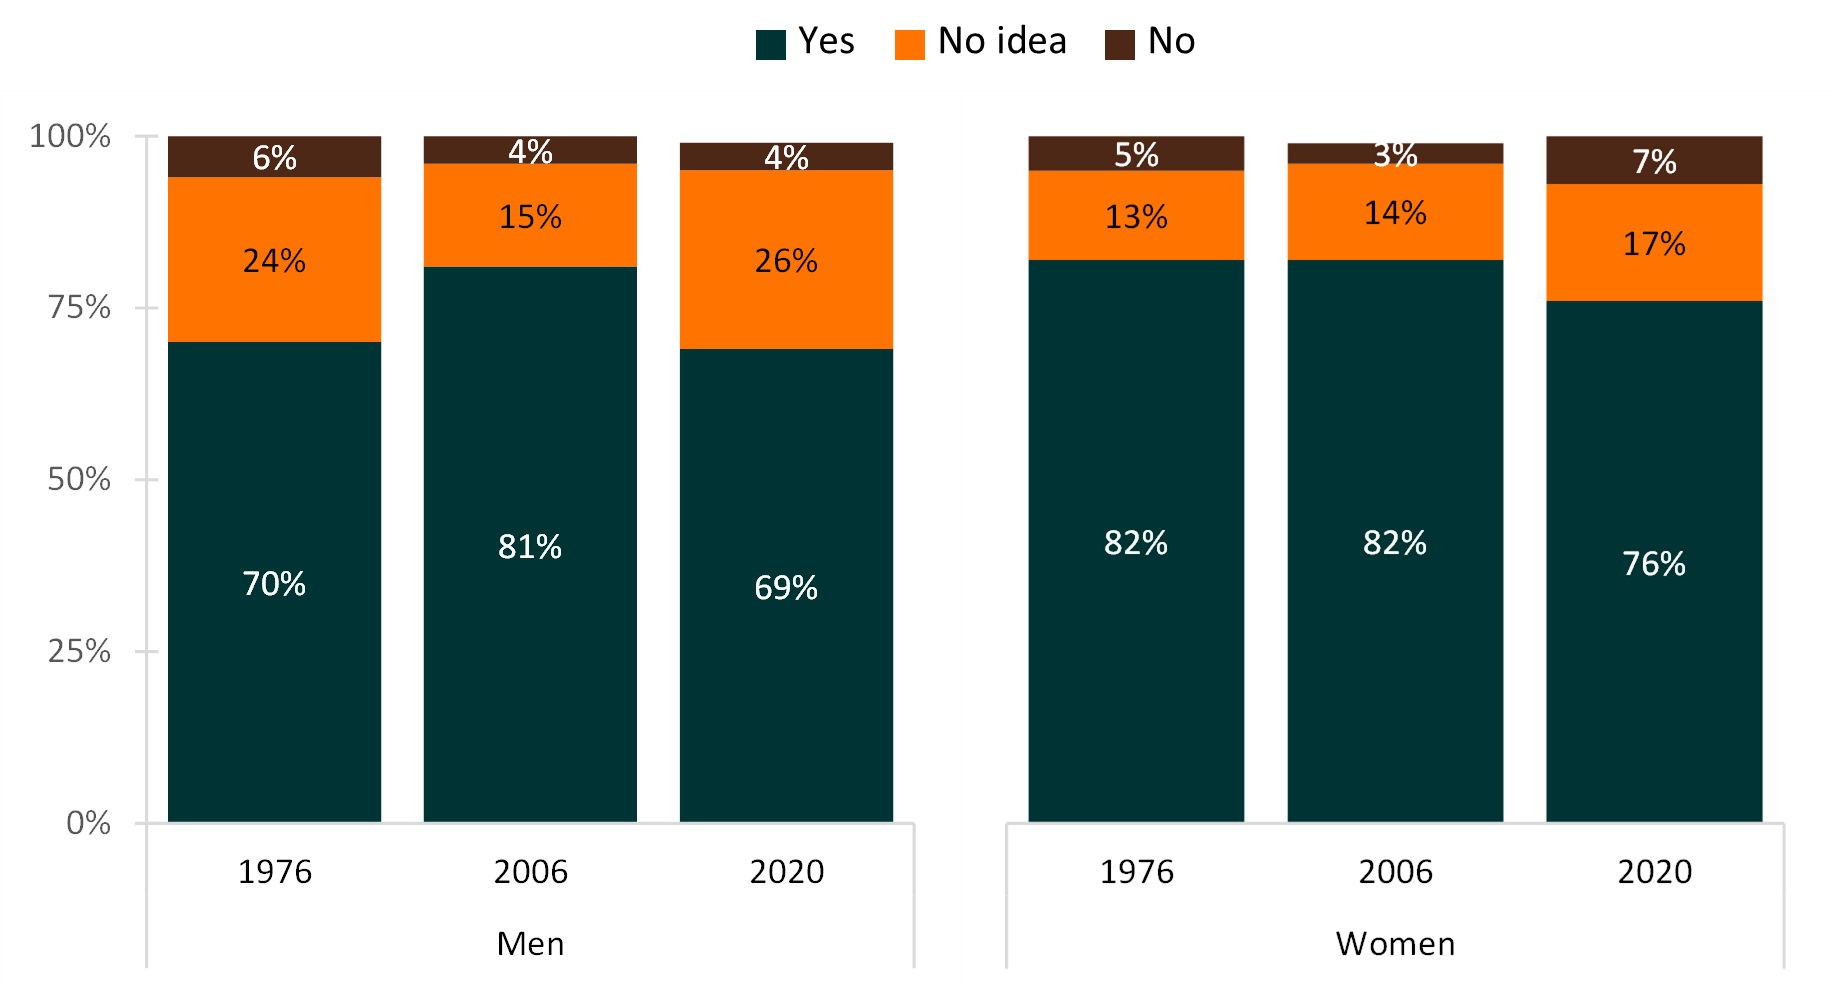
- Between 1976 and 2006, the share of men who expected to marry increased from 70% to 81% while the share of women who expected to marry remained constant at 82%.
- Between 2006 and 2020, the share of both men and women who expected to marry decreased, while the shares who had “no idea” increased.
- In 2020, 69% of men and 76% of women reported that they expected to marry in the future. A slightly larger share of women in 2020 did not expect to marry in the future than men (7% among women, 4% among men).
Figure 3. High School Seniors’ Expectation to Marry by Gender, 1976, 2006, and 2020

Expectations to Marry by Race & Ethnicity
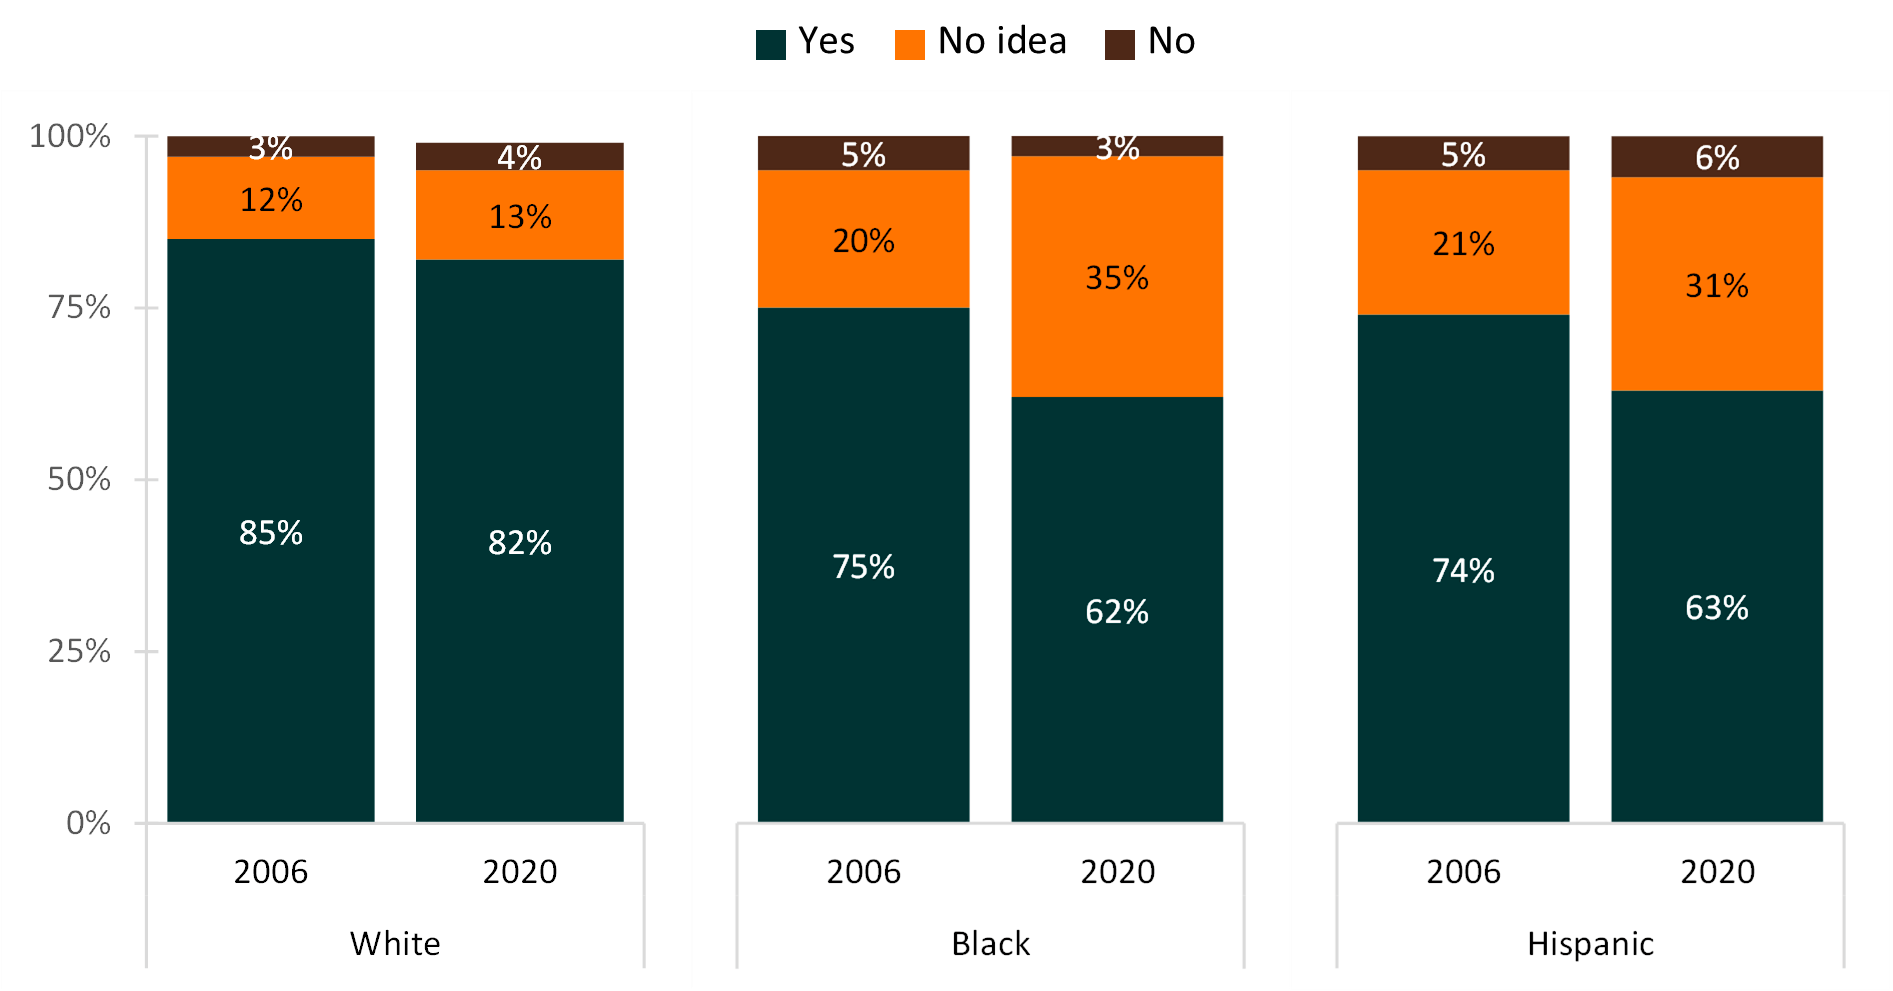
- Between 2006 and 2020, the share of high school seniors who expected to marry declined for White, Black, and Hispanic students, while the share of those who had “no idea” increased. The magnitude of these changes varied across groups.
- The change in marital expectations was minimal for White students. The share who expected to marry experienced a small decline from 85% to 82%, while the share of those who had “no idea” changed little (12% to 13%).
- Black and Hispanic students experienced the greatest decline in their expectations to marry, with three quarters (75% among Black and 74% among Hispanic students) expecting to do so in 2006 compared to about three fifths (62% among Black and 63% among Hispanic students) in 2020.
- In turn, Black and Hispanic students experienced increases in the share of those who had “no idea” about marriage plans. In 2020, 35% of Black seniors and 31% of Hispanic seniors reported “no idea” about their marriage expectations.
Figure 4. High School Seniors’ Expectation to Marry by Race/ Ethnicity, 2006 and 2020*

* Prior to 2005, the Monitoring the Future data only indicated whether the respondent identified as White or Non-White, therefore 1976 is not included in this figure/analysis.
Data Source:
Miech, R. A., Johnston, L. D., Bachman, J. G., O’Malley, P. M., Schulenberg, J. E., and Patrick, M. E. (2021) Monitoring the Future: A continuing study of American youth (12th-Grade Survey), 2020 (ICPSR 38156.v1) [Data set]. National Addiction & HIV Data Archive Program. https://doi.org/10.3886/ICPSR38156.v1
References:
Brown, A. R. & Guzzo, Karen B. (2022). Trends in non-marriage among men, 2005-2019. Family Profiles, FP-22-01. Bowling Green, OH: National Center for Family & Marriage Research. https://doi.org/10.25035/ncfmr/fp-22-01
Brown, A. R. & Manning, W. D. (2022). Non-marriage among college-educated adults, 2005-2019. Family Profiles, FP-22-02. Bowling Green, OH: National Center for Family & Marriage Research. https://doi.org/10.25035/ncfmr/fp-22-02
Reynolds, L. (2020). Marriage rate in the U.S.: Geographic variation, 2019. Family Profiles, FP-20-24. Bowling Green, OH: National Center for Family & Marriage Research. https://doi.org/10.25035/ncfmr/fp-20-24
Suggested Citation:
Brown, A. R. (2022). High school seniors’ expectations to marry, 2020. Family Profiles, FP-22-04. Bowling Green, OH: National Center for Family & Marriage Research. https://doi.org/10.25035/ncfmr/fp-22-04

This project is supported with assistance from Bowling Green State University. From 2007 to 2013, support was also provided by the U.S. Department of Health and Human Services, Office of the Assistant Secretary for Planning and Evaluation. The opinions and conclusions expressed herein are solely those of the author(s) and should not be construed as representing the opinions or policy of any agency of the state or federal government.
Updated: 02/23/2022 09:46AM


