Multiple Gray Divorces: Demographic Trends & Comparisons
Family Profile No. 22, 2024
Authors: Trey Williams & Francesca Marino
The divorce rate for adults aged 50 and older (“gray divorce”) doubled from 1990 to 2010 (Brown & Lin, 2012), and reached a plateau in the past decade (Cohen, 2019). Still, nearly 40% of divorcing persons are aged 50 and older (Brown & Lin, 2022). Gray divorce slightly dropped following the onset of the pandemic (Brown et al, 2024). Some older adults experience gray divorce more than once during later life, a phenomenon we refer to as “multiple gray divorces.” Some people repartner post-gray divorce (Brown et al., 2019) and individuals in a remarriage have an elevated risk of divorce (Brown & Lin, 2012). Those who divorce only once in later life are likely to differ from those who experience multiple gray divorces. In this family profile, we estimate the share of older adults aged 50 and older who experienced one or multiple gray divorces using nationally representative data from the 1998 - 2018 Health and Retirement Study. We also examine variation by race-ethnicity and educational attainment among older men and women who have had one versus multiple gray divorces.
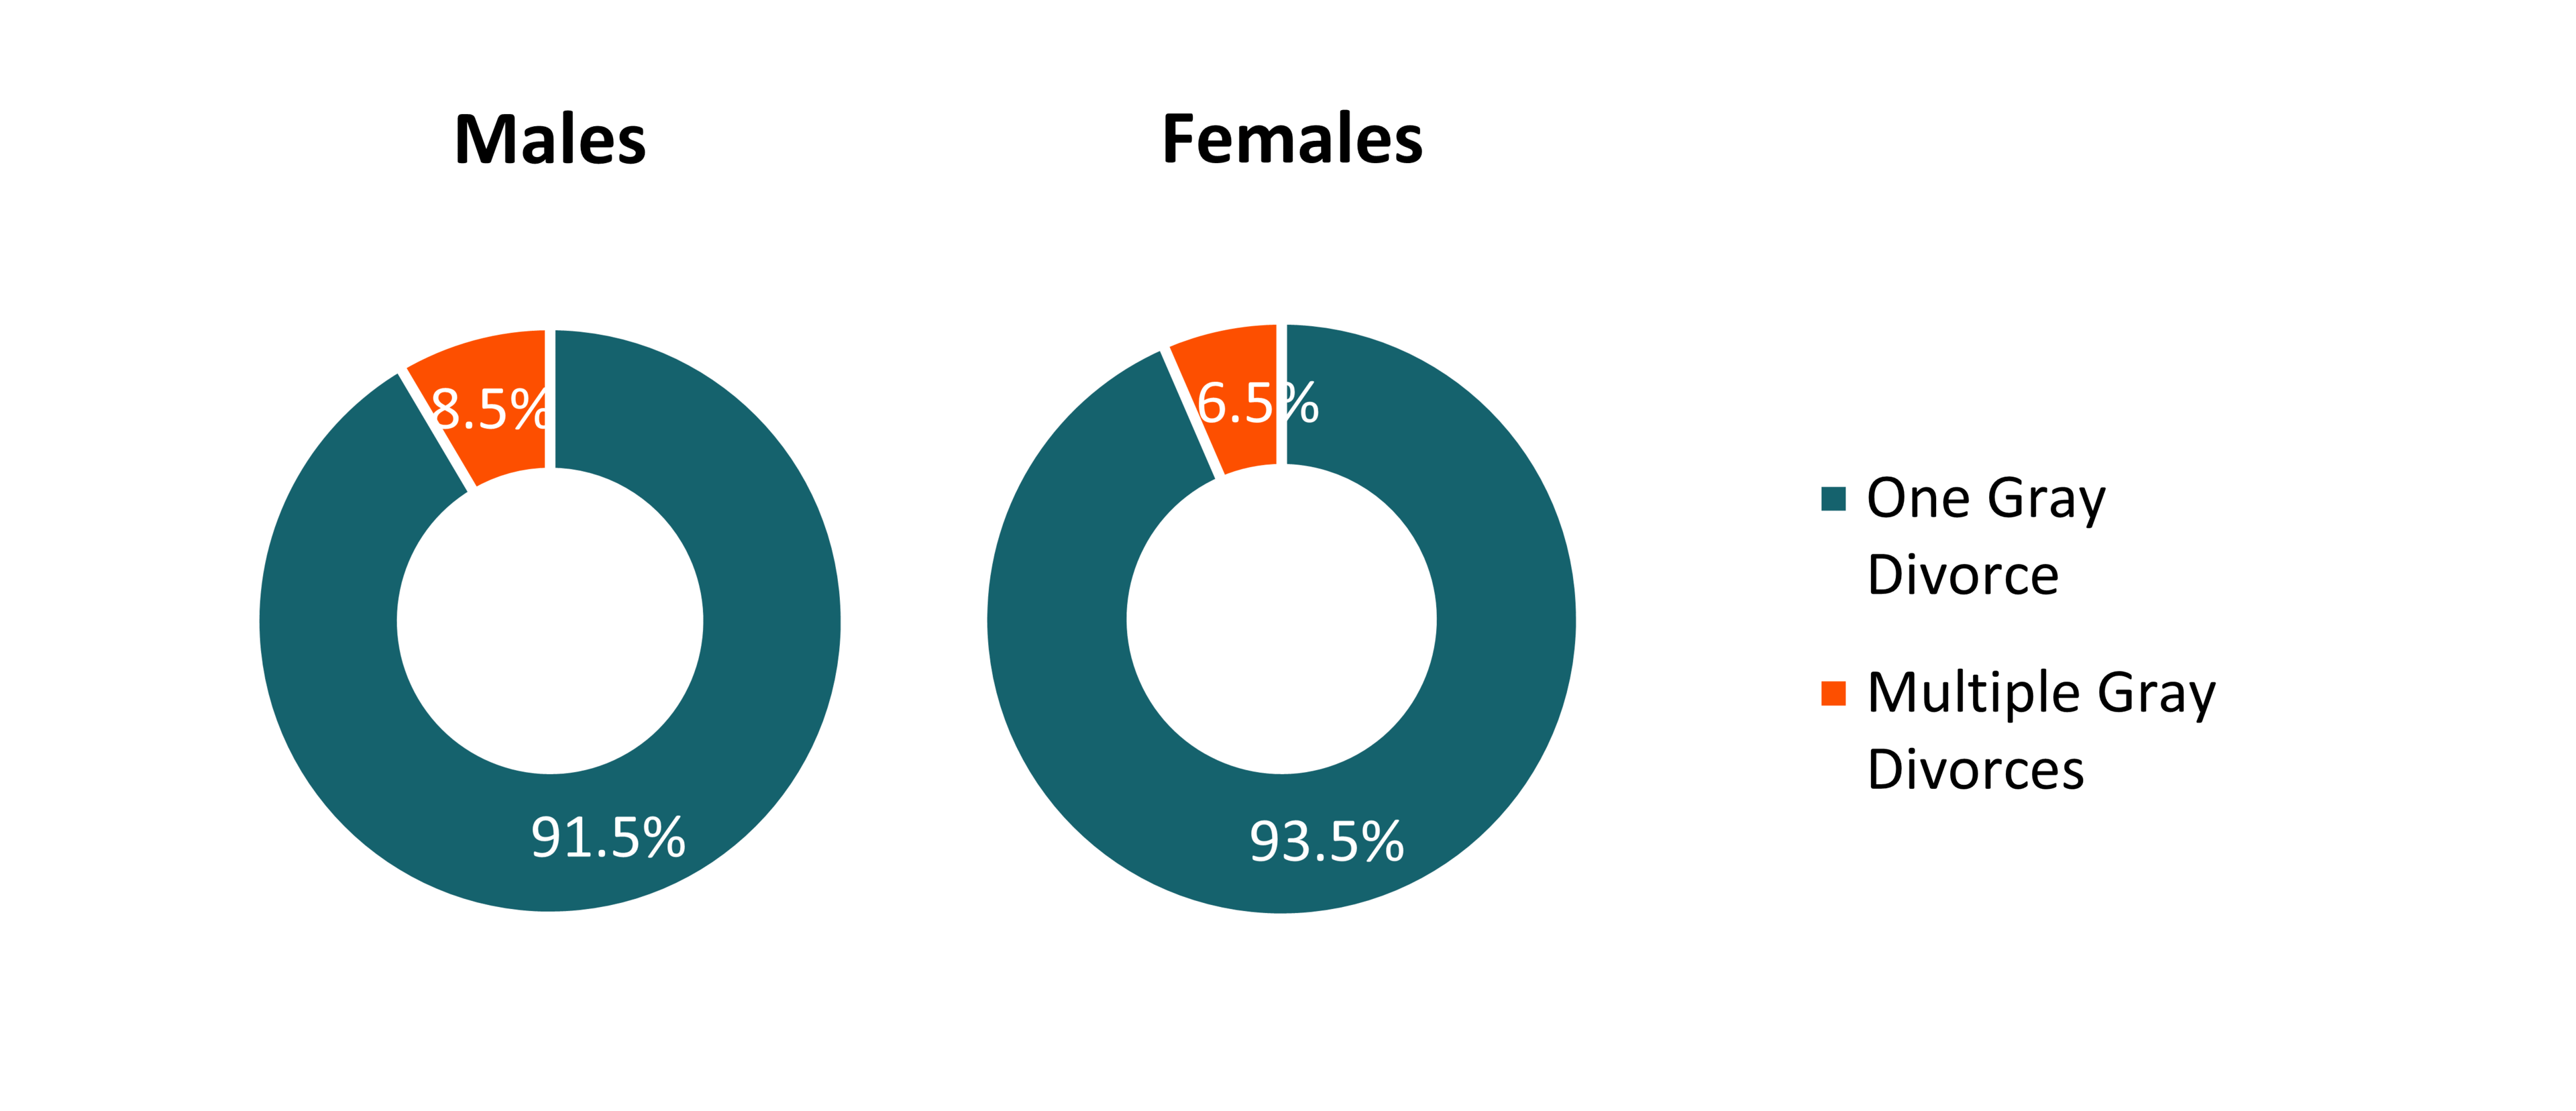
Shares of Older Men and Women with One or Multiple Gray Divorces, 1998 – 2018
- Overall, a higher share of men than women have had two or more gray divorces.
- Among men who have had a gray divorce, 8.5% had two or more, whereas 91.5% had only one.
- Among women who have divorced in later life, 6.5% had multiple gray divorces, whereas 93.5% had just one gray divorce.
Figure 1. Percentages of Older Men and Women with One or Multiple Gray Divorces, 1998 – 2018

Shares of Older Men and Women with One or Multiple Gray Divorces across Race and Ethnicity, 1998 – 2018
- Regardless of race-ethnicity, men who had had at least one gray divorce more often experienced multiple gray divorces than did women.
- Among men who had experienced gray divorce, Hispanics had the highest share with multiple gray divorces at 12.7%, followed by non-Hispanic Whites at 8.8% and non-Hispanic Blacks at 4.9%.
- Among women who had experienced gray divorce, non-Hispanic Whites exhibited the highest proportion with multiple gray divorces at 6.9%, followed by Hispanics at 3.4% and non-Hispanic Blacks at 3.0%.
Figure 2. Shares of Older Men and Women with One or Multiple Gray Divorces Across Race-Ethnicity, 1998-2018

Shares of Older Men and Women with One or Multiple Gray Divorces Across Educational Attainment, 1998 – 2018
- Among individuals who had experienced gray divorce, those with less than a high school education had the highest percentage of multiple gray divorces regardless of gender (10.1% among men and 8.5% among women).
- Among men who had a gray divorce, the share experiencing multiple gray divorces decreased as educational attainment increased, with the highest among those with less than a high school education (10.1%) and the lowest among those with a bachelor’s degree (7.6%).
- Among women who had experienced gray divorce, the share of multiple gray divorces did not decrease with educational attainment. The percentage was highest among those with less than a high school education (8.5%) and remained relatively consistent among those with a high school education (6.5%), some college (5.3%), and a bachelor’s degree (6.6%).
Figure 3. Shares of Older Men and Women with One or Multiple Gray Divorces Across Educational Attainment, 1998 -2018

Data Source:
Health and Retirement Study, (HRS Cross-Wave Marital History Aggregated Data (V1)) public use dataset. Produced and distributed by the University of Michigan with funding from the National Institute on Aging (grant number NIA U01AG009740). Ann Arbor, MI, (2022).
References:
Brown, S. L., & Lin, I.-F. (2012). The gray divorce revolution: Rising divorce among middle-aged and older adults, 1990–2010. The Journals of Gerontology Series B: Psychological Sciences and Social Sciences, 67(6), 731-741.
Brown, S. L., & Lin, I.-F. (2022). The graying of divorce: A half century of change. The Journals of Gerontology: Series B: Psychological Sciences and Social Sciences, 77(9), 1710-1720.
Brown, S. L., Lin, I.-F., Hammersmith, A. M., & Wright, M. R. (2019). Repartnering following gray divorce: The roles of resources and constraints for women and men. Demography, 56(2), 503-523.
Brown, S. L., Lin, I.-F., & Julian, C. A. (2024). Gray Divorce During the COVID-19 Pandemic. The Journals of Gerontology. Series B: Psychological Sciences and Social Sciences, 79(2), 95-110.
Brown, S.L., Lin, I.-F., Marino, F.A., & Mellencamp, K.A. (Forthcoming). Marital Separation, Reconciliation, and Repartnering in Later Life. Journal of Marriage & Family.
Cohen, P. N. (2019). The coming divorce decline. Socius, 5, 2378023119873497
Suggested Citation:
Williams, T., & Marino, F. (2024). Multiple gray divorces: Demographic trends & comparisons. Family Profile, FP-24-22. National Center for Family & Marriage Research. https://doi.org/10.25035/ncfmr/fp-24-22
This project is supported with assistance from Bowling Green State University. From 2007 to 2013, support was also provided by the U.S. Department of Health and Human Services, Office of the Assistant Secretary for Planning and Evaluation. The opinions and conclusions expressed herein are solely those of the author(s) and should not be construed as representing the opinions or policy of any agency of the state or federal government.
Updated: 10/25/2024 02:19PM

