Long-Term Marriages among Older U.S. Adults, 2022
Family Profile No. 1, 2024
Author: Jaden Loo
Changing patterns of marital formation and dissolution have enduring consequences for the marital experiences of old adults. The rising age at first marriage, high rates of divorce, and falling levels of remarriage and widowhood have the potential to shape the prevalence of long-term marriages. According to the 2022 American Community Survey (ACS) data, just 7.7% of all current marriages have reached the 50-year milestone. Because most of the married population has not lived long enough to be in marriages of 50 or more years, this profile is restricted to adults who were aged 70 and older in 2022. Among those aged 70 and older, more than half were currently married (54.2%) and 67.9% of those marriages were first marriages. One quarter (25.4%) were in marriages of 50 or more years . Using the 2022 ACS, this Family Profile updates the existing Family Profile which relied on 2014 ACS estimates. Here, we explore variation in the shares of older adults who have reached their “golden anniversary” by marital history, race/ethnicity, education, and state of residence.
Long-Term Marriages
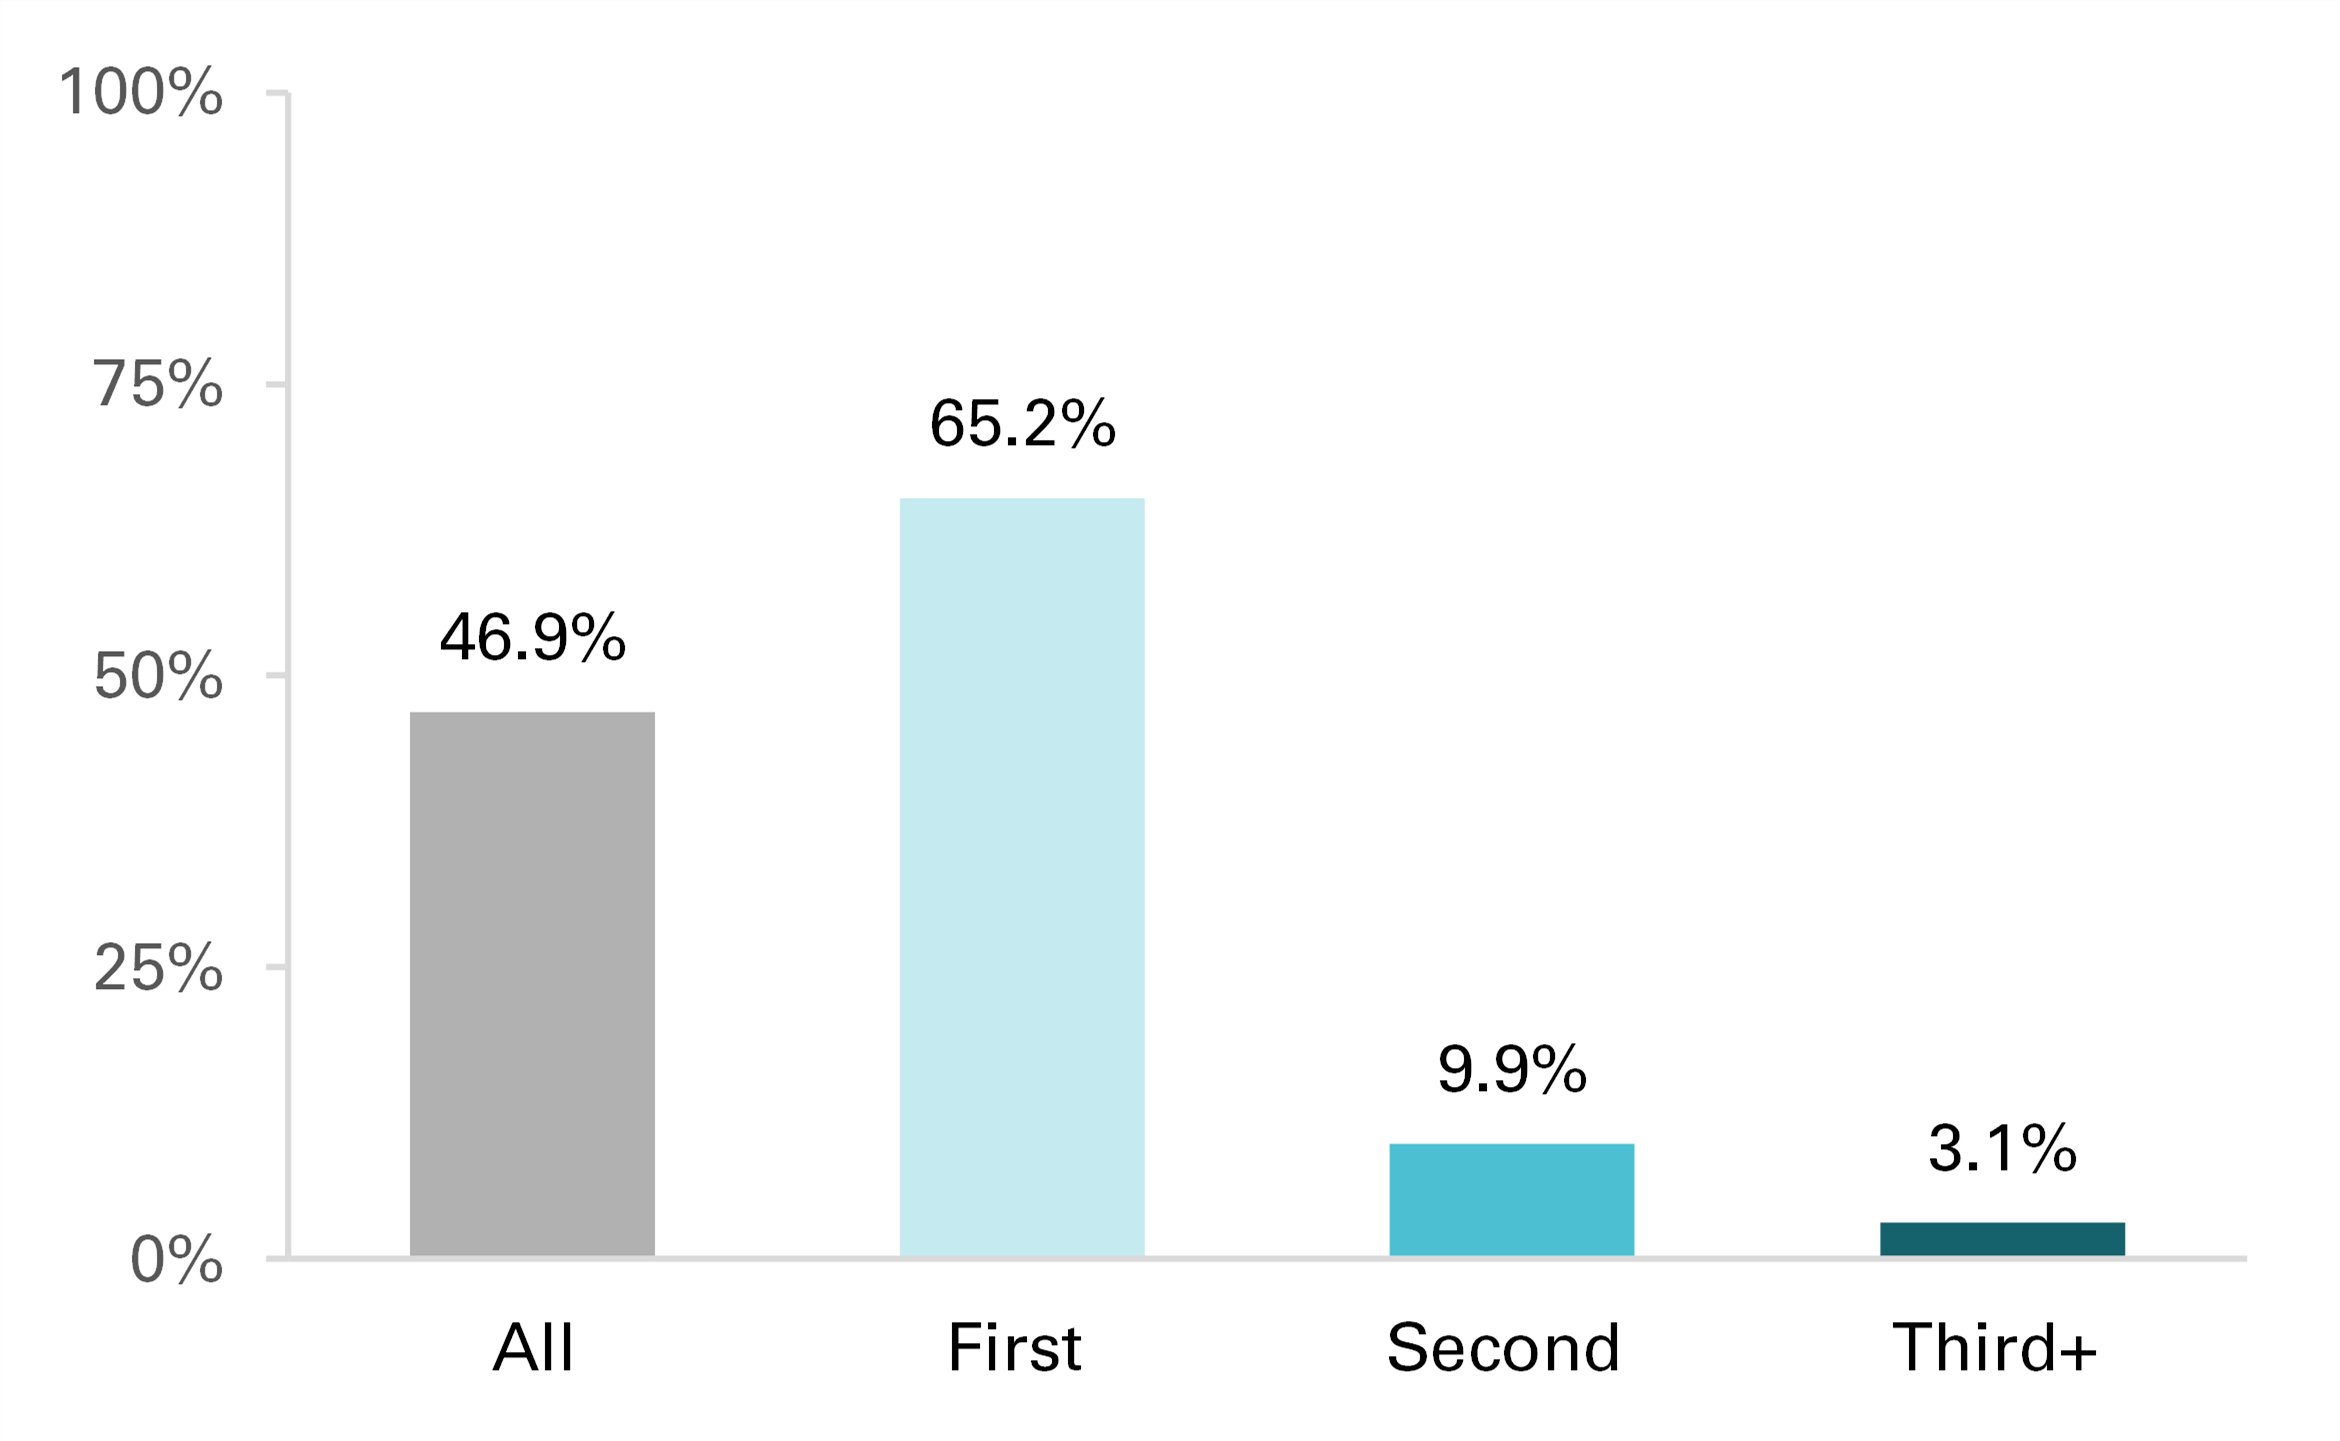
- Among all older adults who were currently married, just under half (46.9%) were in marriages of 50 years or more. This is a slight decline from 2014 when slightly more than half (52%) of all currently married older adults were married for 50 years or more (Wu & Brown 2014).
- The prevalence of long-term marriages differs according to marriage history. Among those in a first marriage, 65.2% had been married at least 50 years. Second or third (or higher) marriages were far less often of 50+ years in duration, at only 9.9% and 3.1%, respectively.
Figure 1. Percentage of Currently Married Older U.S. Adults in Marriages of 50+ Years, by Marriage Order, 2022
Long-Term Marriages by Race/Ethnicity
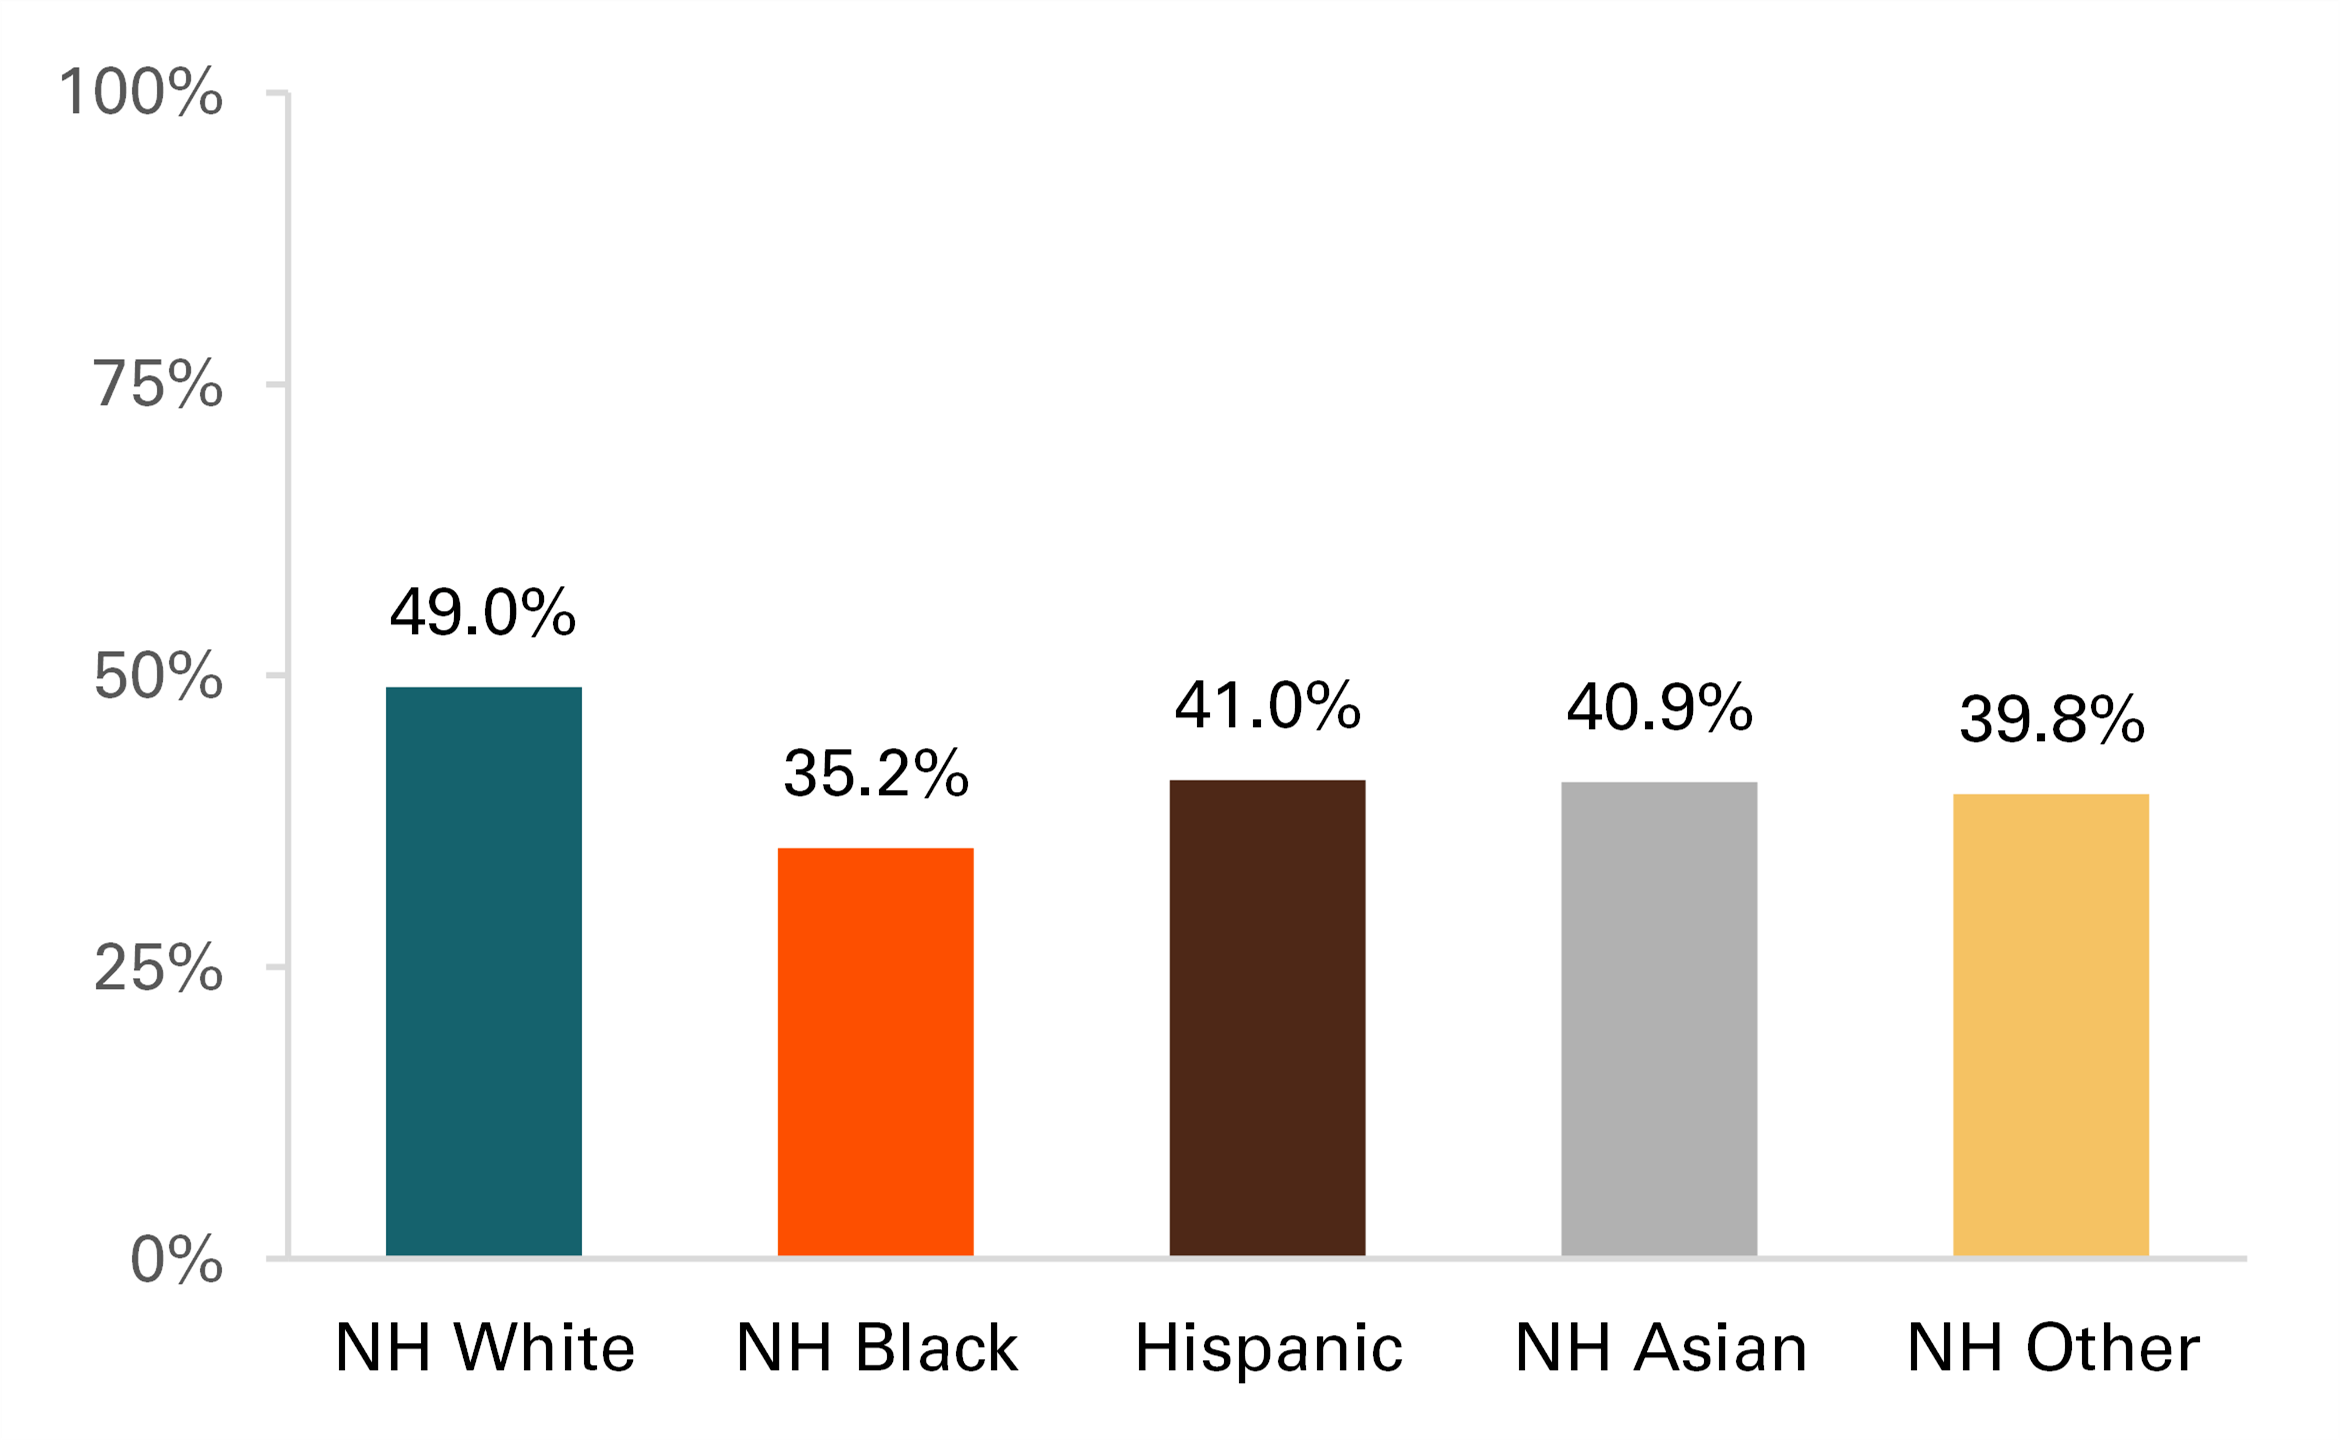
Less than half of currently married U.S. older adults in every racial/ethnic group considered in this profile were in marriages of 50 years or more.
- Nearly half (49%) of non-Hispanic White U.S. older adults were in marriages of 50 years or more, which was the highest share observed across racial/ethnic groups.
- Non-Hispanic Black adults had the lowest proportion of currently married older adults in marriages of 50 years or more (35.2%).
- About two-fifths of currently married older Hispanic, non-Hispanic Asian, and non-Hispanic adults of other races were in a marriage of 50 years or more in duration.
Figure 2. Percentage of Currently Married Older U.S Adults in Marriages of 50+ Years, by Race/Ethnicity, 2022
Long-Term Marriages by Educational Attainment
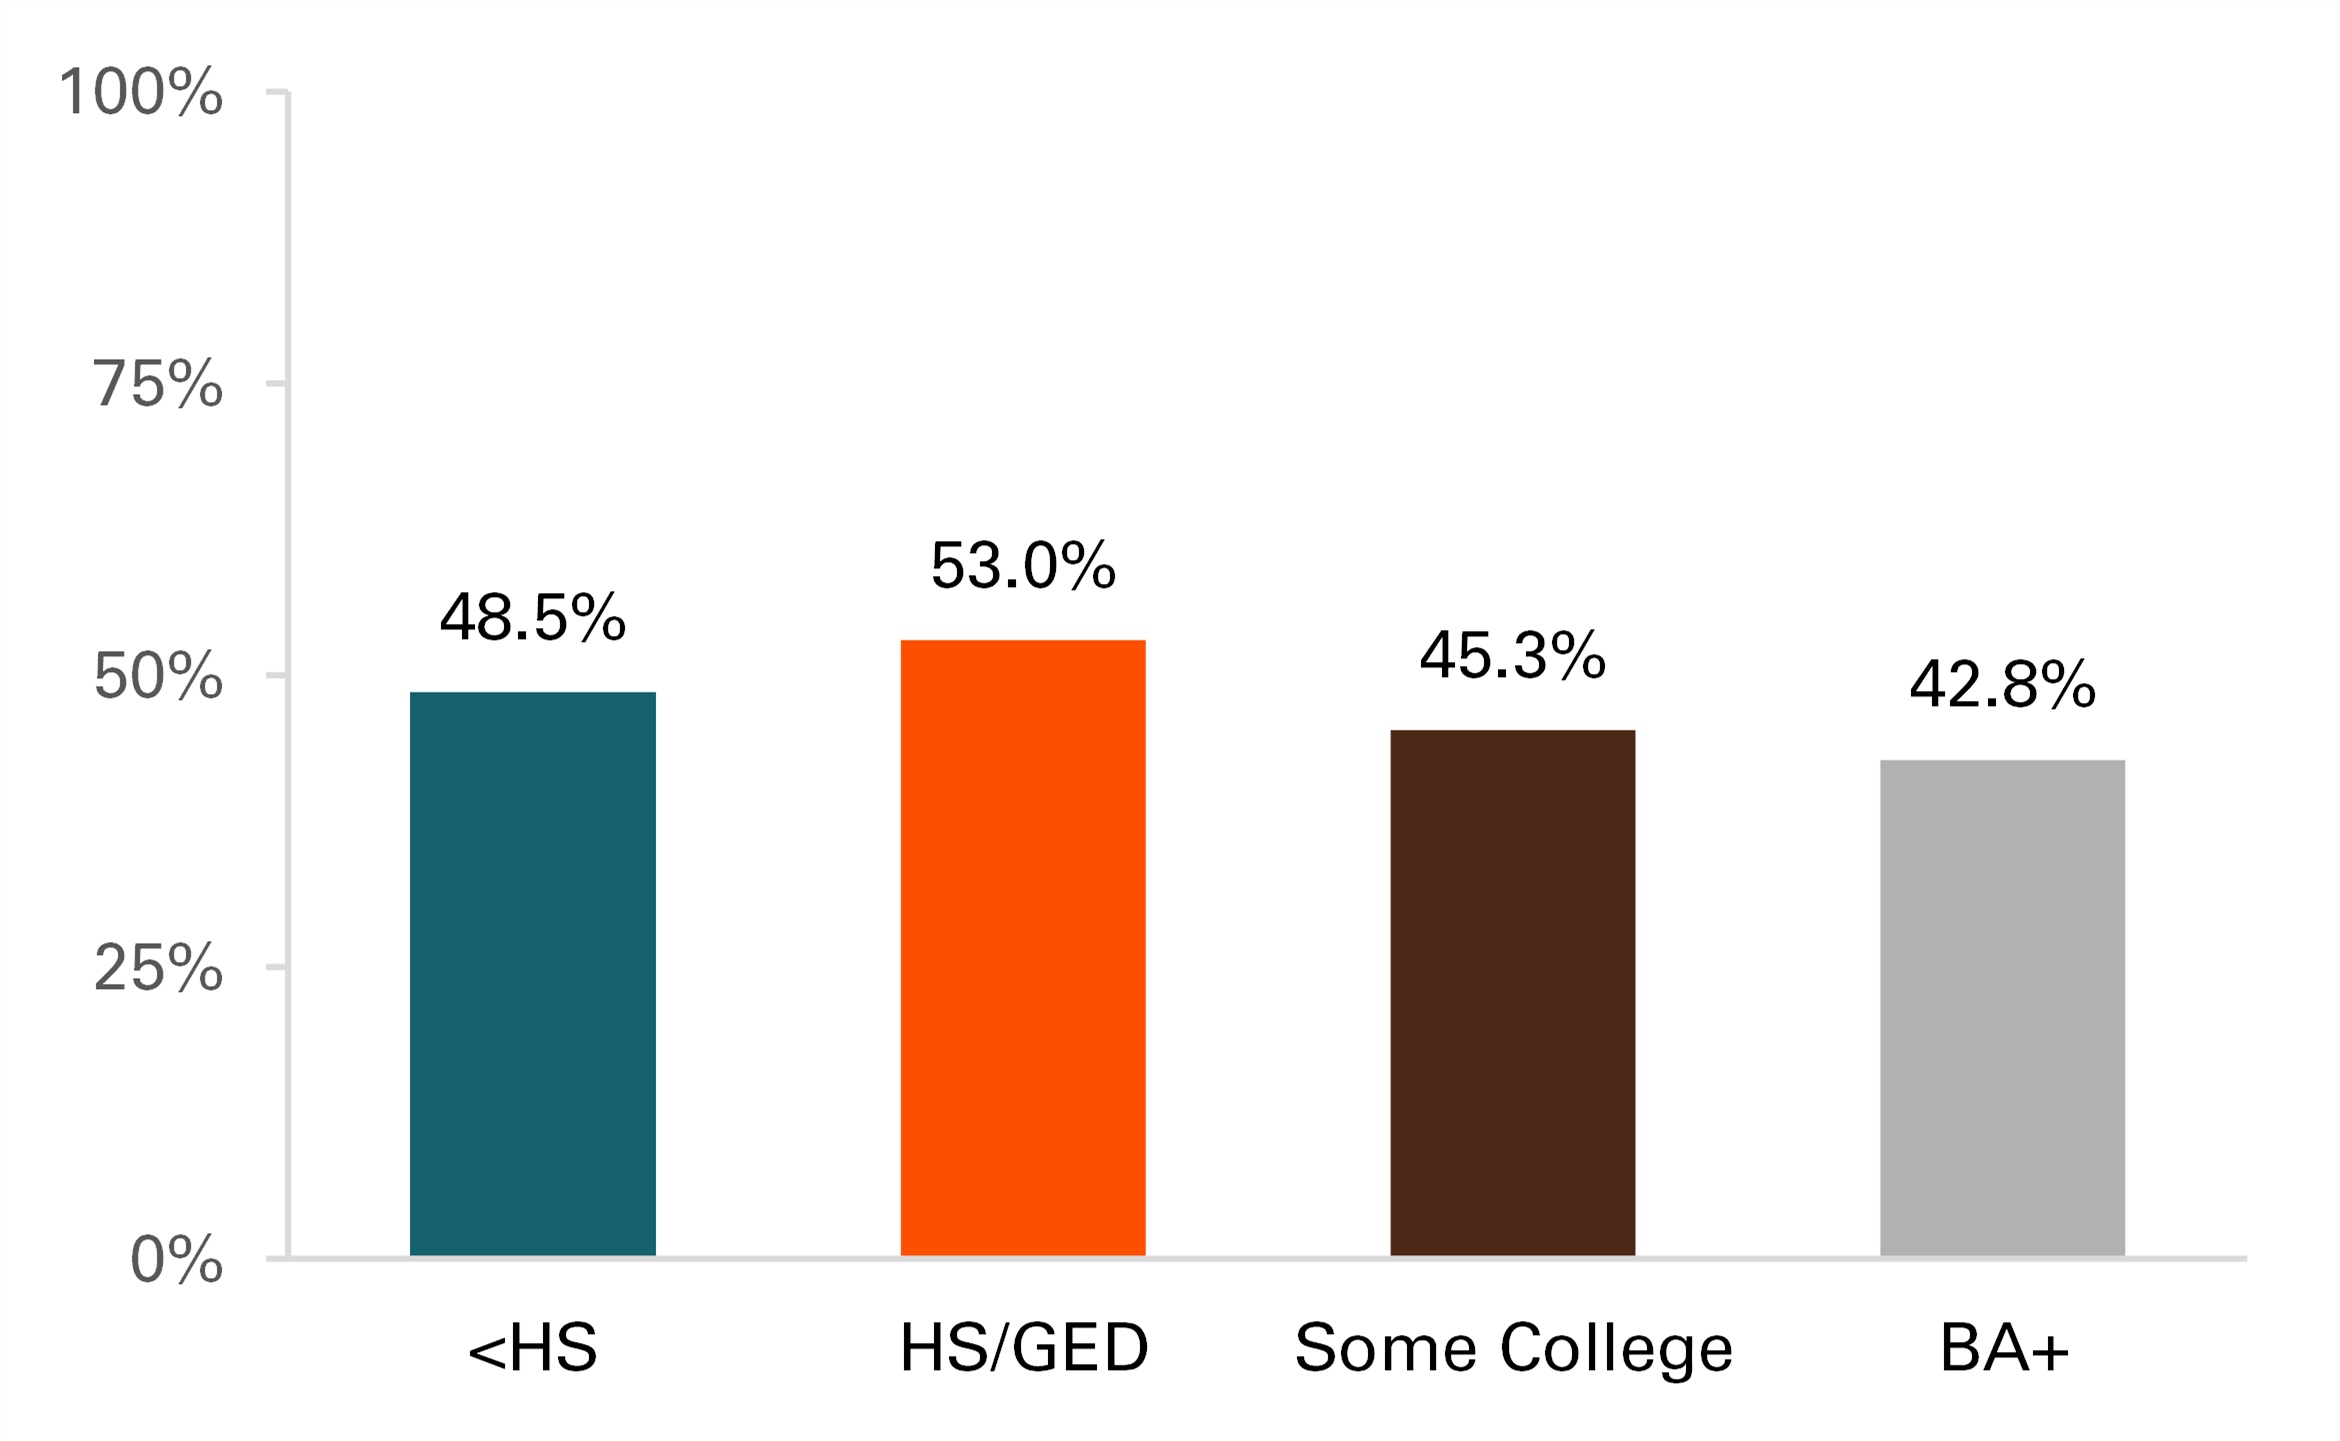
- There is an educational gradient to long-term marriages. The only educational group with more than half of currently married older adults being in a marriage of at least 50 years was those with a High School degree/GED or equivalent at 53%.
- Those with a bachelor’s degree or more represented the group with the lowest proportion of current marriages lasting 50 years or more (42.8%).
Figure 3. Percentage of Currently Married Older U.S. Adults in Marriages of 50+ Years, by Educational Attainment, 2022
Geographic Variation of Long-Term Marriages
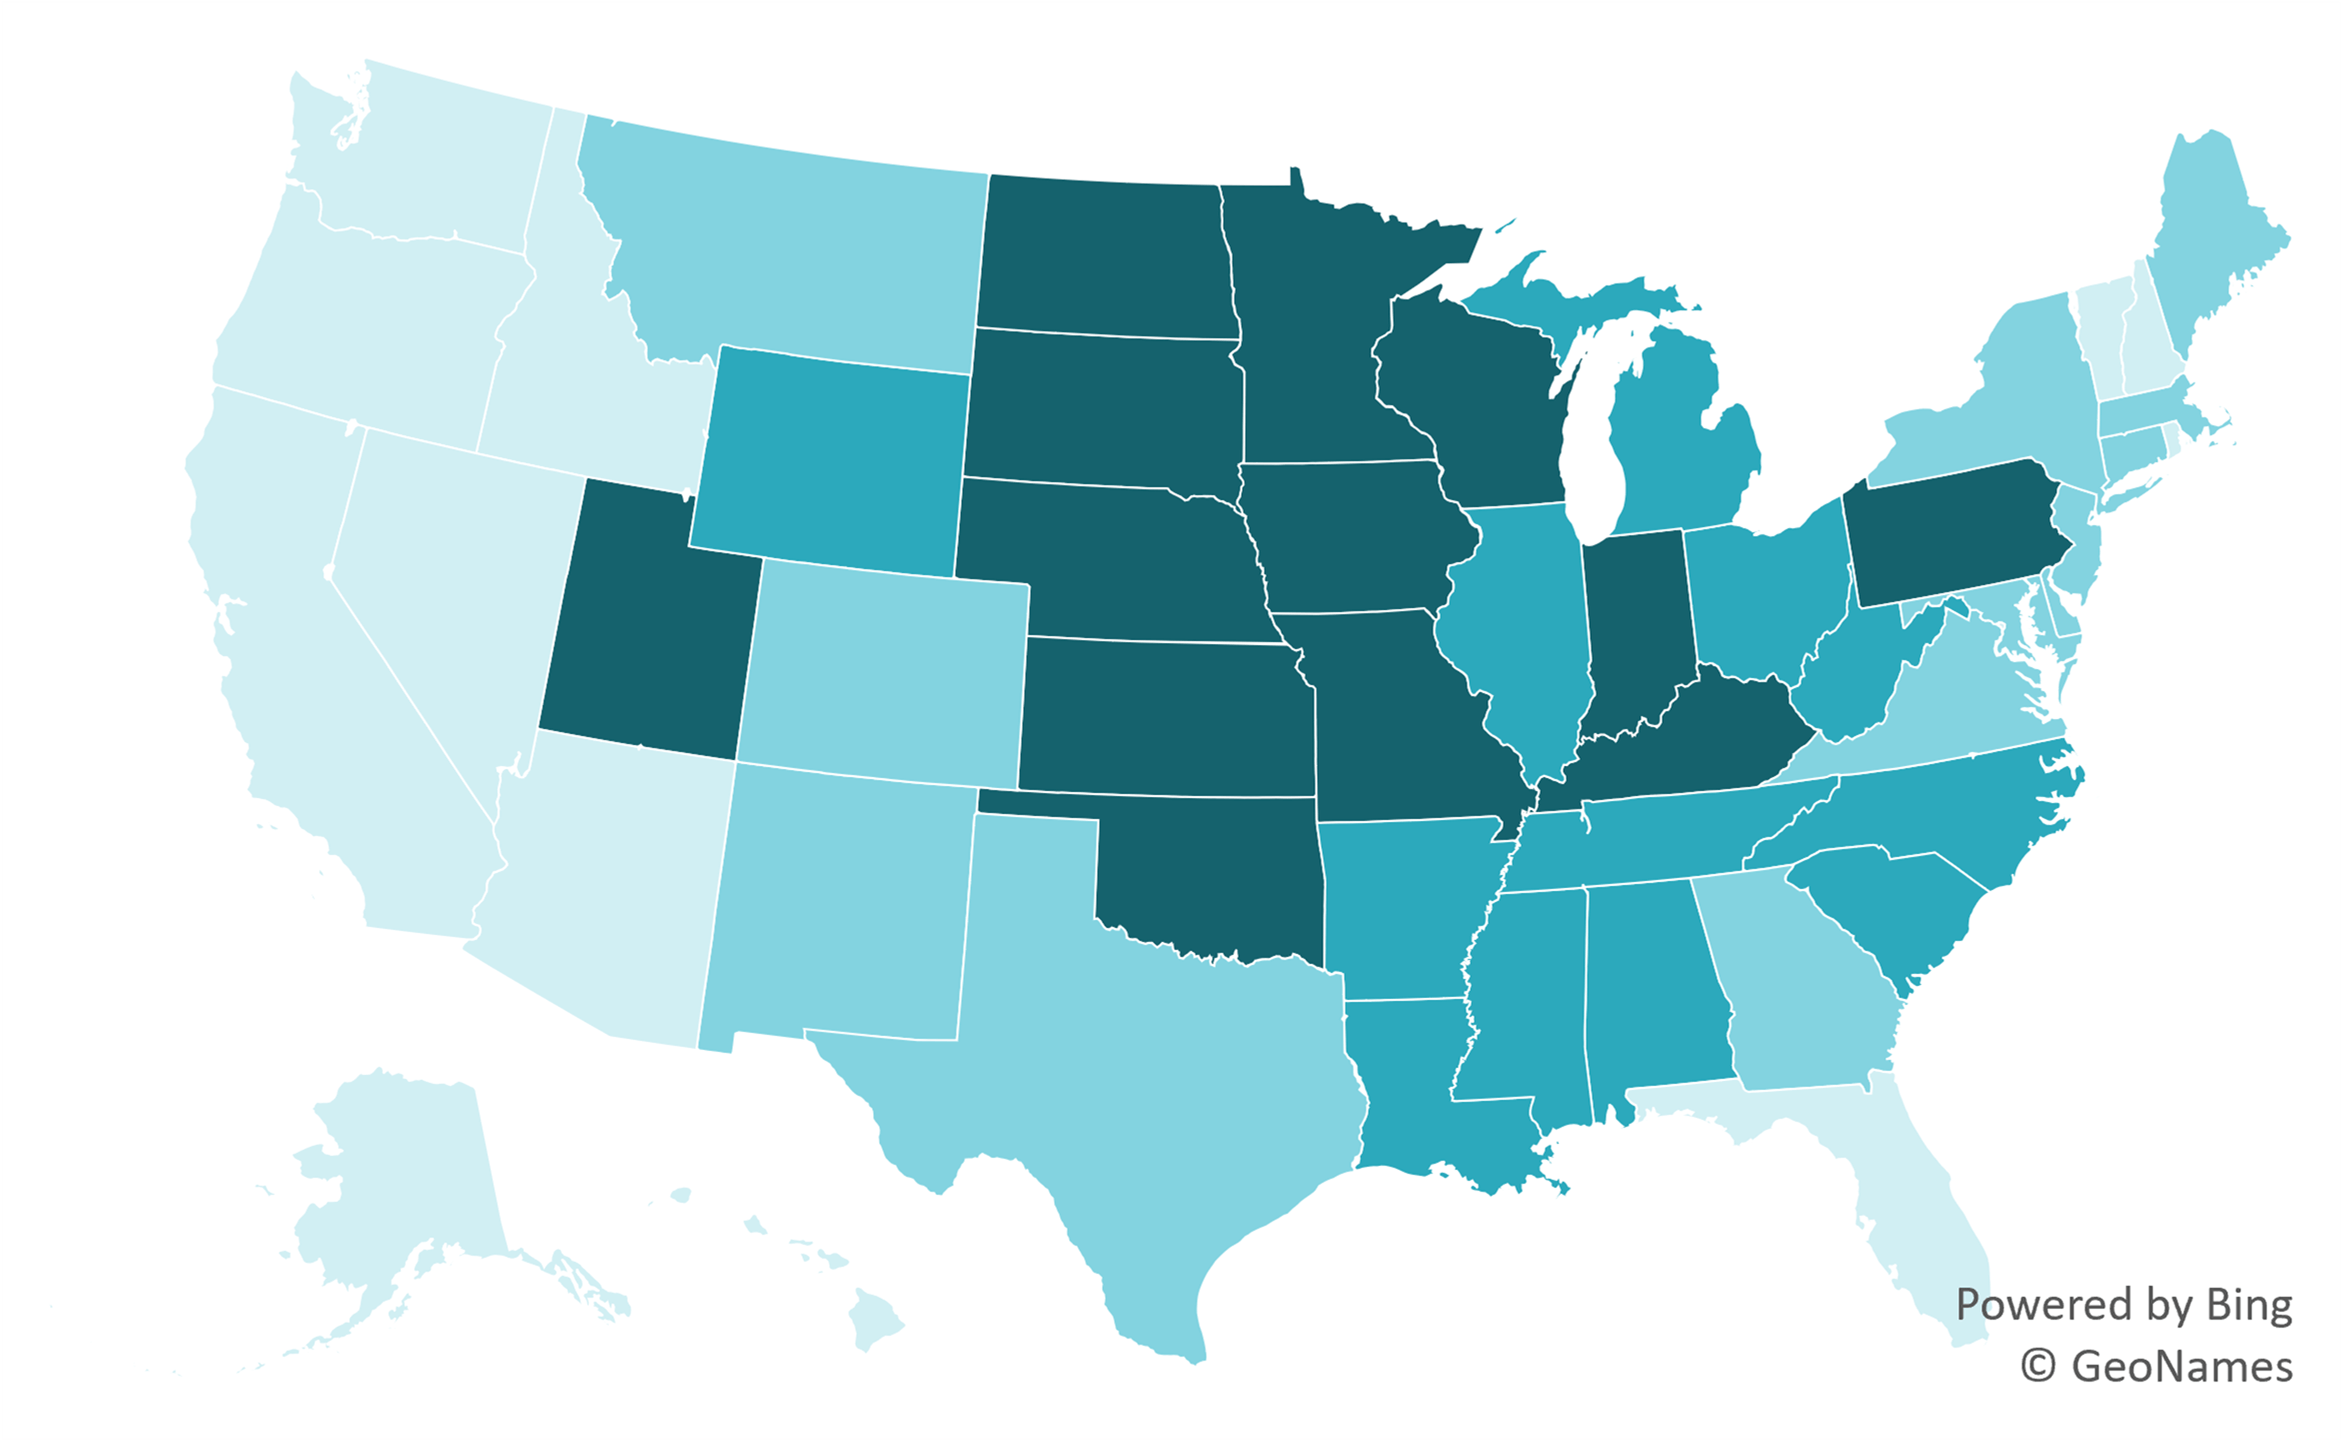
- There is considerable variation in the share of currently married older U.S. adults in long-term marriages by state ranging from a high of 58.2% in South Dakota to a low of 32.5% in Washington, DC.
- States with the highest shares— in the top quartile—were concentrated in the Midwestern region of the U.S., whereas states with the lowest shares—in the bottom quartile—were concentrated in the Western region.
Figure 4. Geographic Variation in the Percentage of Older Married Adults in Marriages of 50+ Duration by Quartile, 2022
Source: NCFMR analyses of IPUMS-USA, ACS1 year estimates, 2022
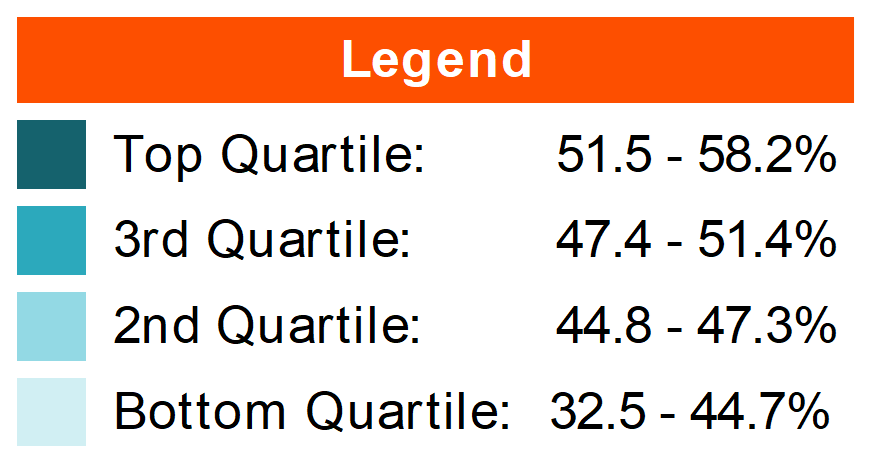
Figure 5. State-level Percentages of Older Married Adults in Marriages of 50+ Duration by Quartile, 2022
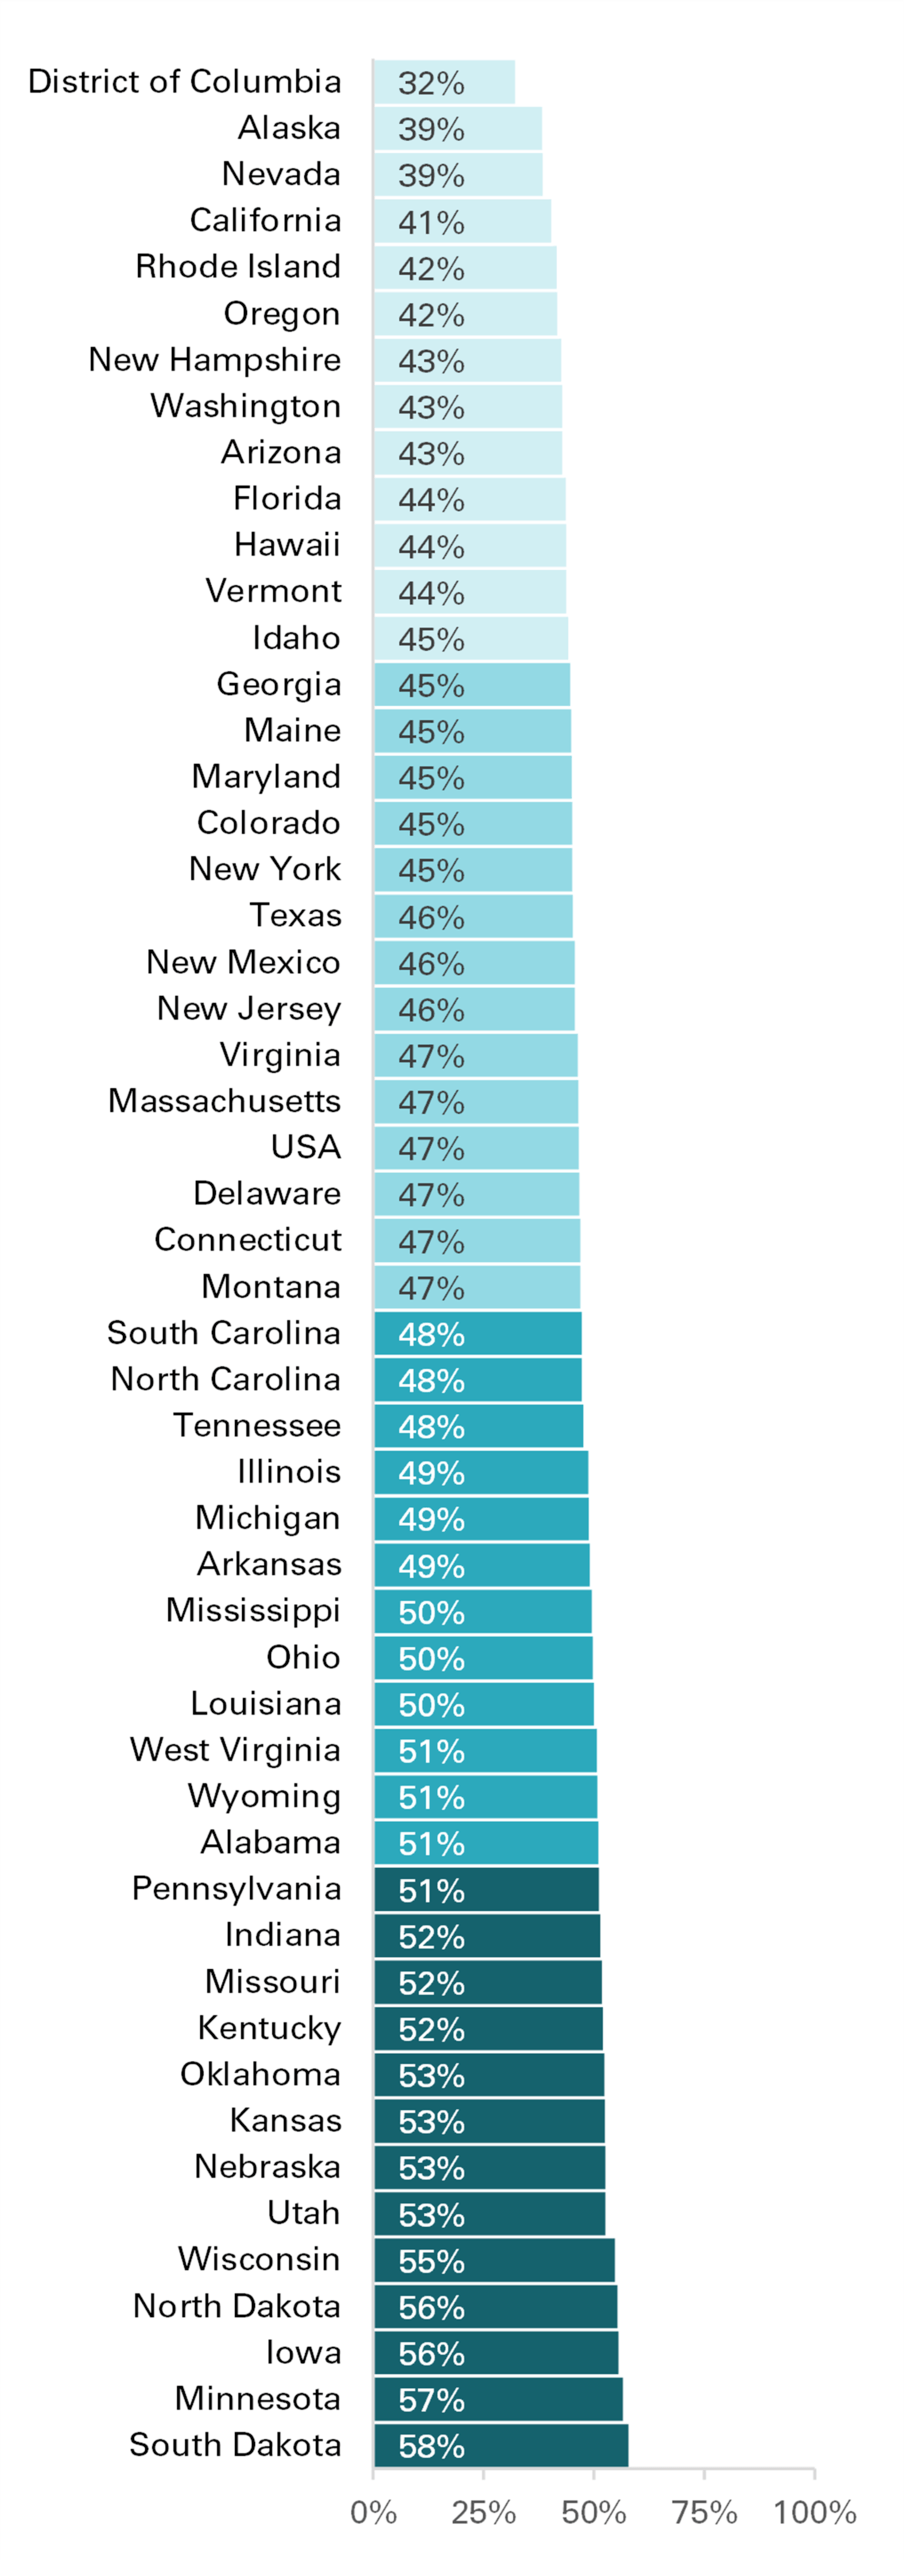
Source: NCFMR analyses of IPUMS-USA, ACS1 year estimates, 2022
Data Source:
Ruggles, S., Flood, S., Sobek, M., Backman, D., Chen, A., Cooper, G., Richards, S., Rodgers, R., & Schouweiler, M. (2023). IPUMS USA: Version 14.0 (14.0) American Community Survey. Minneapolis, MN: IPUMS. https://doi.org/10.18128/D010.V14.0
References:
Wu, H. & Brown, S.L. (2016). Long-term marriage among older adults. Family Profiles, FP-16-08. Bowling Green, OH: National Center for Family and Marriage Research. http://www.bgsu.edu/ncfmr/resources/data/family-profiles/wu-brown-long-term-marriage-older-adults-fp-16-08.html
Suggested Citation:
Loo, J. (2024). Long-term marriages among older U.S. adults, 2022. Family Profiles, FP-24-01. Bowling Green, OH: National Center for Family & Marriage Research. https://doi.org/10.25035/ncfmr/fp-24-01
This project is supported with assistance from Bowling Green State University. From 2007 to 2013 support was also provided by the U.S. Department of Health and Human Services, Office of the Assistant Secretary for Planning and Evaluation. The opinions and conclusions expressed herein are solely those of the author(s) and should not be construed as representing the opinions or policy of any agency of the state or federal government.
Updated: 03/13/2024 06:25PM

